Introduction
This document describes how to troubleshoot SecureX Module Errors for Secure Network Analytics Integration.
Prerequisites
Requirements
Cisco recommends that you have knowledge of these topics:
- Secure Network Analytics (SNA) Console
- Your Secure Network Analytics deployment generates security events and Alarms as expected
- Your SNA Console needs to be able to connect outbound to the Cisco clouds:
- North America clouds
| api-sse.cisco.com |
port 443 |
| visibility.amp.cisco.com |
port 443 |
| securex.us.security.cisco.com |
port 443 |
-
- EU clouds
| api.eu.sse.itd.cisco.com |
port 443 |
| visibility.eu.amp.cisco.com |
port 443 |
| securex.eu.security.cisco.com |
port 443 |
- Asia (APJC) clouds
| api.eu.sse.itd.cisco.com |
port 443 |
| visibility.apjc.amp.cisco.com |
port 443 |
| securex.apjc.security.cisco.com |
port 443 |
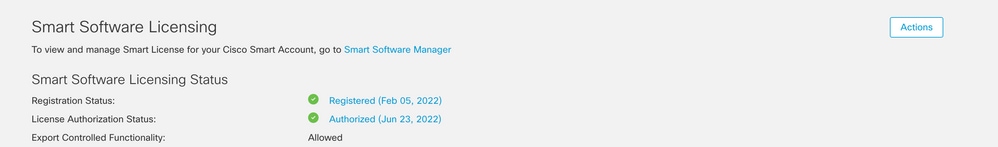
- Your SNA is Registered in Smart Licensing. Navigate to Central Management > Smart Licensing, as shown in the image:
- It is recommended to use the same Smart Account/Virtual Account that you use for the SecureX product
- You have an account to access SecureX. In order to use SecureX and associated tools, you need to have an account on the regional cloud you use
Note: If you or your organization already have accounts on your regional cloud, use the account that already exists. Do not create a new one.
Components Used
The information in this document is based on these software versions:
- Cisco Security Services Exchange (SSE) console
- Secure Network Analytics v7.2.1 or later
- SecureX Console
Note: The account in every console must have Administrator rights in order to perform a change.
The information in this document was created from the devices in a specific lab environment. All of the devices used in this document started with a cleared (default) configuration. If your network is live, ensure that you understand the potential impact of any command.
Background Information
Cisco SecureX is the platform in the Cisco cloud that helps you detect, investigate, analyze, and respond to threats and use the data aggregated from multiple products and sources. This integration enables you to do these tasks in Secure Network Analytics (formerly Stealthwatch):
- Use Secure Network Analytics (shown as Stealthwatch) tiles on the SecureX dashboard to monitor key operational metrics
- Utilize the SecureX menu to pivot to your other Cisco Security and third-party integrations
- Provide access to your SecureX ribbon
- Send Secure Network Analytics Alarms to the Cisco SecureX threat response (formerly Cisco Threat Response) Private Intelligence Store
- Allow SecureX to request Security Events from Secure Network Analytics to enrich the investigation context in threat response workflows
Please refer to the latest SecureX and Secure Network Analytics Integration Guide here.
Secure Network Analytics Module Errors
This document helps to troubleshoot any of these error messages on the Secure Network Analytics Integration Module:
"Module Error: Stealthwatch Enterprise remote-server-error: {:error (not (map? a-java.lang.String))} [:invalid-server-response]"
"There was an unexpected error in the module"
SNA CLI Login Methods
There are two user roles in order to log in via SSH into SNA CLI
You need to log in via SSH with the device IP address and Root user role. (You have limited actions as Sysadmin user role)
Troubleshoot
Note: The troubleshoot mentioned in this document must be performed and supervised by a Cisco TAC engineer. Please open a case in order to get the proper assistance from the Cisco TAC Support team.
Restart SSE and CTR services
Step 1. If SecureX SNA Module triggers any of the error messages, log in via SSH into the SNA device as the Root user.
Step 2. Run the next commands in order to restart sse-connector and ctr-integration services:
docker restart svc-sse-connector
docker restart svc-ctr-integration
Step 3. Run this command to verify services status:
docker ps
The services must show UP status (also, you can see the status time changes when the service is started/restarted), as shown in the image:

Step 4. Refresh the SNA Module tiles in SecureX portal, the dashboard starts to show the proper SNA data.
Configure the FQDN of the SMC
If restart sse-connector and ctr-integration services do not fix the issue, please navigate to the location /lancope/var/logs/containers and run this command:
cat the svc-sse-connector.log
Verify if you get this error message in the logs:
docker/svc-sse-connector[1193]: time="2021-05-26T09:19:20.921548198Z" level=info msg="[FlowID:<FLOW_UUID>;MsgID:<MSG_UUID>] HTTP command [/ctr/health] with cmdID [<UUID>] failed: Post https://X.X.X.X/ctr/health: x509: cannot validate certificate for X.X.X.X because it doesn't contain any IP SANs"
If the line exists, you need to edit the docker-compose.yml file in order to fix this error.
Step 1. Navigate into /lancope/manifests/ path and locate docker-compose.yml file, as shown in the image:

Step 2. Run this command in order to edit docker-compose.yml file:
cat docker-compose.yml
You can use your preferred method to edit it (Nano or Vim) in order to search the container sse-connector details, as shown in the image:
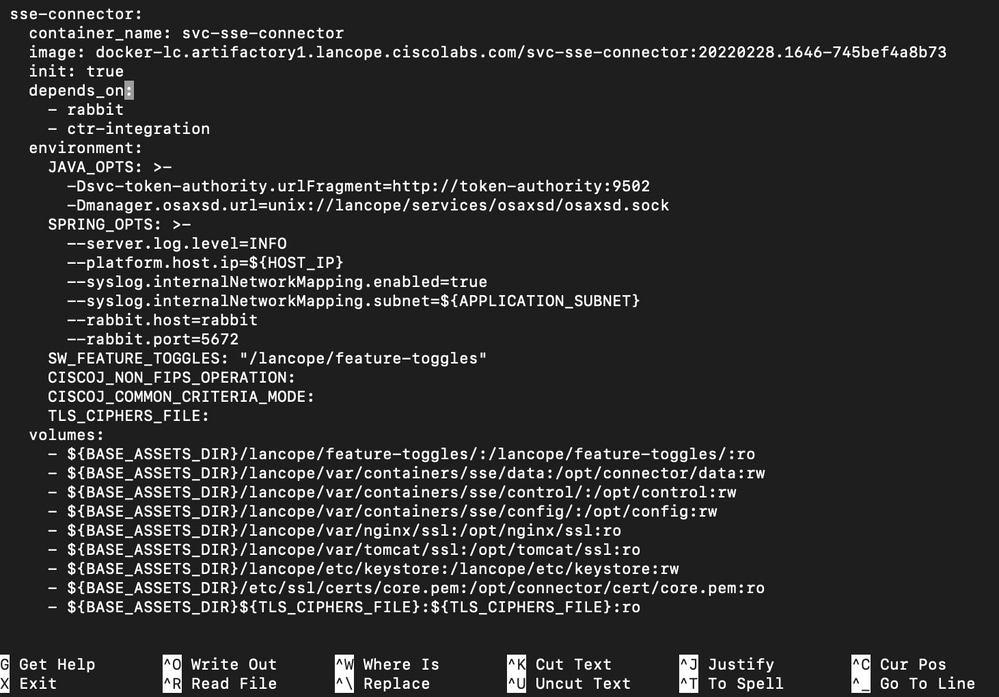
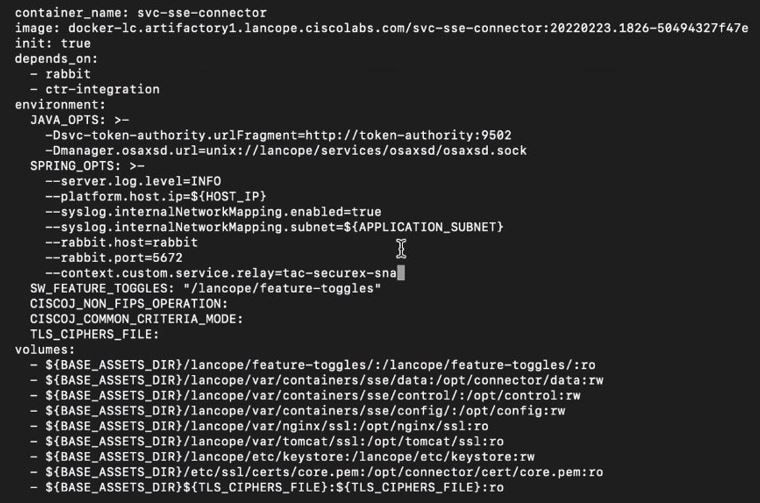
Step 3. Navigate to SPRING_OPTS line and add the next command line:
--context.custom.service.relay=smc_hostname
The smc_hostname is the FQDN of your SNA, as shown in the image:
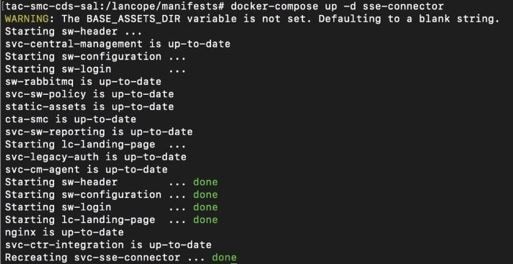
Step 4. Save the new change and run this command:
docker-compose up -d sse-connector
It recreates the docker-compose.yml file with the proper SNA details, the output must show done status, as shown in the image:
Verify
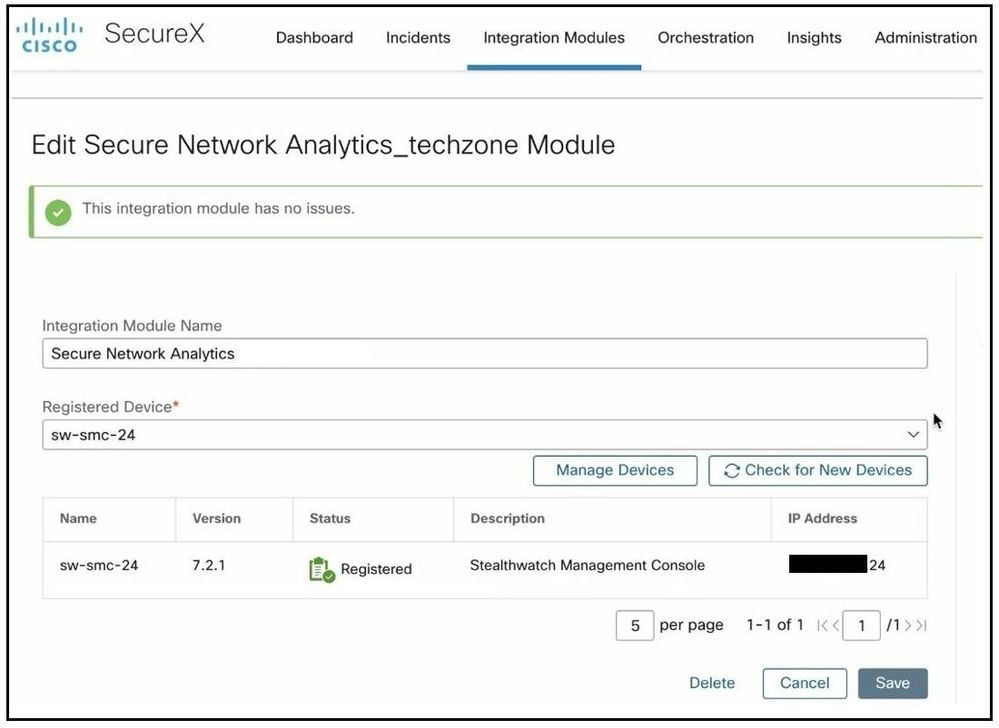
From the SecureX portal, verify the SNA device is registered properly and the module has no issues, as shown in the image:
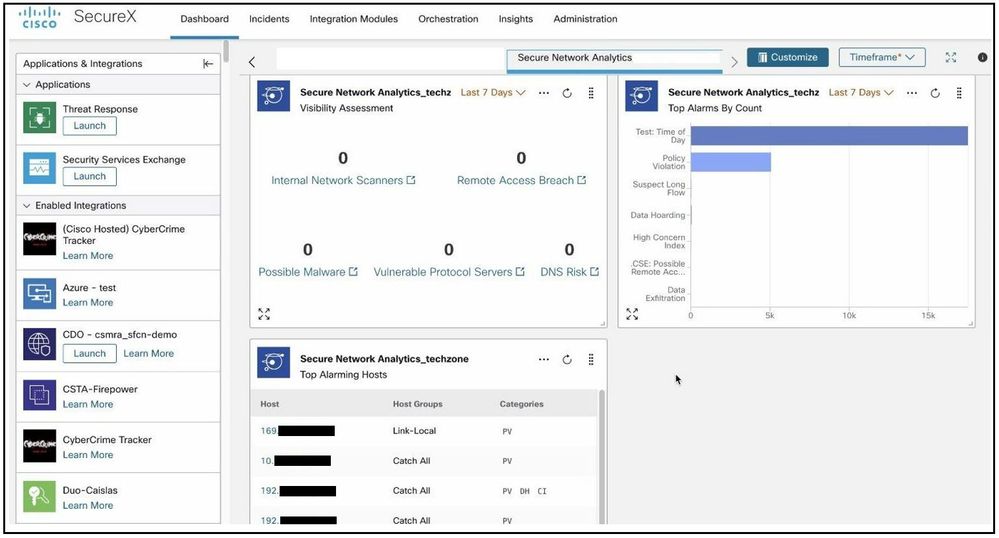
Refresh the SNA Module tiles, the dashboard start to show the proper SNA data, as shown in the image:
Related Information
 Feedback