Information About Embedded Event Manager
Embedded Event Manager
Event tracking and management has traditionally been performed by devices external to the networking device. Embedded Event Manager (EEM) has been designed to offer event management capability directly in Cisco IOS devices. The on-device, proactive event management capabilities of EEM are useful because not all event management can be done off device because some problems compromise communication between the device and the external network management device. Capturing the state of the device during such situations can be invaluable in taking immediate recovery actions and gathering information to perform root-cause analysis. Network availability is also improved if automatic recovery actions are performed without the need to fully reboot the routing device.
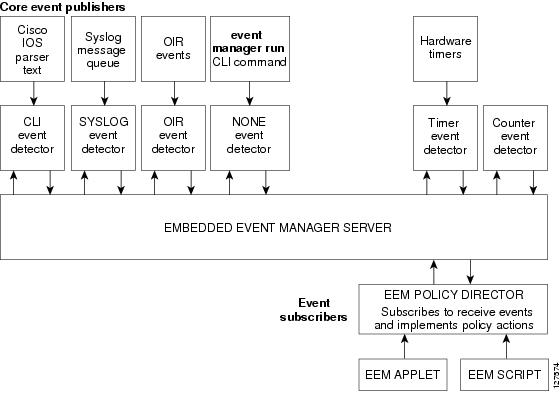
EEM is a flexible, policy-driven framework that supports in-box monitoring of different components of the system with the help of software agents known as event detectors. The figure below shows the relationship between the EEM server, core event publishers (event detectors), and the event subscribers (policies). Basically, event publishers screen events and publish them when there is a match on an event specification that is provided by the event subscriber. Event detectors notify the EEM server when an event of interest occurs. The EEM policies that are configured using the Cisco command-line interface (CLI) then implement recovery on the basis of the current state of the system and the actions specified in the policy for the given event.
EEM offers the ability to monitor events and take informational or corrective action when the monitored events occur or when a threshold is reached. An EEM policy is an entity that defines an event and the actions to be taken when that event occurs. There are two types of EEM policies: an applet or a script. An applet is a simple form of policy that is defined within the CLI configuration. A script is a form of policy that is written in Tool Command Language (Tcl).
 Note |
If your network has a higher version of EEM, that version would include the previous releases of EEM version as well. |
Embedded Event Manager 1.0
EEM 1.0 introduced Embedded Event Manager. EEM 1.0 introduced the following event detectors:
-
SNMP—The Simple Network Management Protocol (SNMP) event detector allows a standard SNMP MIB object to be monitored and an event to be generated when the object matches specified values or crosses specified thresholds.
-
Syslog—The syslog event detector allows for screening syslog messages for a regular expression pattern match.
EEM 1.0 introduced the following actions:
-
Generating prioritized syslog messages.
-
Generating a Cisco Networking Services (CNS) event for upstream processing by CNS devices.
-
Reloading the Cisco software.
-
Switching to a secondary processor in a fully redundant hardware configuration.
Embedded Event Manager 2.0
EEM 2.0 introduced some new features. EEM 2.0 introduced the following event detectors:
-
Application-Specific—The application-specific event detector allows any Embedded Event Manager policy to publish an event.
-
Counter—The counter event detector publishes an event when a named counter crosses a specified threshold.
-
Interface Counter—The interface counter event detector publishes an event when a generic Cisco IOS interface counter for a specified interface crosses a defined threshold.
-
Timer—The timer event detector publishes events for the following four different types of timers: absolute-time-of-day, countdown, watchdog, and CRON.
-
Watchdog System Monitor (IOSWDSysMon)—The Cisco IOS watchdog system monitor event detector publishes an event when CPU or memory utilization for a Cisco IOS process crosses a threshold.
EEM 2.0 introduced the following actions:
-
Setting or modifying a named counter.
-
Publishing an application-specific event
-
Generating an SNMP trap.
The ability to run a Cisco defined sample policy written using Tool Command Language (Tcl) was introduced. A sample policy was provided that could be stored in the system policy directory.
Embedded Event Manager 2.1
EEM 2.1 and introduced some new features. EEM 2.1 introduced the following new event detectors:
-
CLI—The CLI event detector screens command-line interface (CLI) commands for a regular expression match.
-
None—The none event detector publishes an event when the Cisco IOS event manager run command executes an EEM policy.
-
OIR—The online insertion and removal (OIR) event detector publishes an event when a particular hardware insertion or removal event occurs.
EEM 2.1 introduced the following actions:
-
Executing a Cisco CLI command.
-
Requesting system information when an event occurs.
-
Sending a short e-mail.
-
Manually running an EEM policy.
EEM 2.1 also permits multiple concurrent policies to be run using the new event manager scheduler script command. Support for SNMP event detector rate-based events is provided as is the ability to create policies using Tool Command Language (Tcl).
Embedded Event Manager 2.1 (Software Modularity)
EEM 2.1 (Software Modularity) is supported on Cisco Software Modularity images. EEM 2.1 (Software Modularity) introduced the following event detectors:
-
GOLD—The Generic Online Diagnostic (GOLD) event detector publishes an event when a GOLD failure event is detected on a specified card and subcard.
-
System Manager—The system manager event detector generates events for Cisco IOS Software Modularity process start, normal or abnormal stop, and restart events. The events generated by the system manager allows policies to change the default behavior of the process restart.
-
Watchdog System Monitor (WDSysMon)—The Cisco Software Modularity watchdog system monitor event detector detects infinite loops, deadlocks, and memory leaks in Cisco IOS Software Modularity processes.
EEM 2.1 for Software Modularity introduced the ability to display EEM reliability metric data for processes.
Note |
EEM 2.1 for Software Modularity images also supports the resource and RF event detectors introduced in EEM 2.2, but it does not support the enhanced object tracking event detector or the actions to read and set tracked objects. |
Embedded Event Manager 2.2
EEM 2.2 introduced some new features. EEM 2.2 introduced the following event detectors:
-
Enhanced Object Tracking—The enhanced object tracking event detector publishes an event when the tracked object changes. Enhanced object tracking provides complete separation between the objects to be tracked and the action to be taken by a client when a tracked object changes.
-
Resource—The resource event detector publishes an event when the Embedded Resource Manager (ERM) reports an event for the specified policy.
-
RF—The redundancy framework (RF) event detector publishes an event when one or more RF events occur during synchronization in a dual Route Processor (RP) system. The RF event detector can also detect an event when a dual RP system continuously switches from one RP to another RP (referred to as a ping-pong situation).
EEM 2.2 introduced the following actions:
-
Reading the state of a tracked object.
-
Setting the state of a tracked object.
Embedded Event Manager 2.3
EEM 2.3 is supported on the Cisco Catalyst 6500 Series switches and introduces enhancements to the Generic Online Diagnostics (GOLD) Event Detector on that product.
-
The event gold command was enhanced with the addition of the action-notify , testing-type , test-name , test-id , consecutive-failure , platform-action , and maxrun keywords for improved reaction to GOLD test failures and conditions.
-
The following platform-wide GOLD Event Detector information can be accessed through new read-only EEM built-in environment variables: - Boot-up diagnostic level
- Card index, name, serial number
- Port counts
- Test counts
-
The following test-specific GOLD Event Detector information can be accessed through new read-only EEM built-in environment variables (available to EEM applets only): - Test name, attribute, total run count
- Test result per test, port, or device
- Total failure count, last fail time
- Error code
- Occurrence of consecutive failures
These enhancements result in reduced mean time to recovery (MTTR) and higher availability through improved automation and fault detection.
Embedded Event Manager 2.4
EEM 2.4 introduced the following event detectors:
-
SNMP Notification—The SNMP notification event detector provides the ability to intercept SNMP trap and inform messages coming into the device. An SNMP notification event is generated when an incoming SNMP trap or inform message matches specified values or crosses specified thresholds.
-
RPC—The remote procedure call (RPC) event detector provides the ability to invoke EEM policies from outside the device over an encrypted connection using Secure Shell (SSH). The RPC event detector uses Simple Object Access Protocol (SOAP) data encoding for exchanging XML-based messages. This event detector can be used to run EEM policies and then receive output in a SOAP XML-formatted reply.
EEM 2.4 added enhancements to the following event detectors:
-
Interface counter rate-based trigger—This feature adds the ability for an interface event to be triggered based on a rate of change over a period of time. A rate can be specified both for the entry value and the exit value. This feature copies the rate-based functionality that currently exists for the SNMP event detector.
-
SNMP delta value—The difference between the monitored Object Identifier (OID) value at the beginning of the monitored period and the actual OID value when the event is published will be provided in the event reqinfo data for both the SNMP event detector and the Interface Counter event detector.
EEM 2.4 introduced the following actions:
-
Multiple event support—The ability to run multiple events was introduced. and show event manager commands were enhanced to show multiple events.
-
Support for parameters—The parameter argument has been added to the event manager run command. A maximum of 15 parameters can be used.
-
Display of Job IDs and completion status--Some of the show event manager commands were enhanced to display Job IDs and completion status.
-
Bytecode support—Tcl 8 defines a specialized bytecode language (BCL) and includes a just-in-time compiler that translates Tcl scripts to BCL. Byte sequence is executed by a “virtual machine,” Tcl_ExecuteByteCode(), or TEBC for short, as often as needed. Currently EEM accepts file extensions, such as *.tcl for user policies and *.tm for system policies. Tcl standard extension for bytecode scripts are *.tbc. Now EEM will accept *.tbc as valid EEM policies.
-
Registration substitution enhancement—Supports replacing multiple parameters in the event registration statement lines with a single environment variable.
-
Tcl package support
Embedded Event Manager 3.0
EEM 3.0 introduces the following new event detectors:
-
Custom CLI--The custom CLI event detector publishes an event to add and enhance existing CLI command syntax.
-
Routing--The Routing event detector publishes an event when route entries change in the Routing Information Base (RIB).
-
NetFlow-- The NetFlow event detector publishes an event when a NetFlow event is triggered.
-
IP SLA--The IP SLA event detector publishes an event when an IP SLA reaction is triggered.
EEM 3.0 introduces the following features.
-
Class-based scheduling--The EEM policies will be assigned a class using the class keyword when they are registered. EEM policies registered without a class will be assigned to the default class.
-
High performance Tcl policies--Three new Tcl commands are introduced event_completion , event_wait , and event_completion_with_wait .
-
Interactive cli support--The synchronous applets are enhanced to support interaction with the local console (TTY). Two new IOS commands, action gets and action puts, are introduced to allow users to enter and display input directly on the console.
-
Variable logic for applets--The Variable Logic for EEM Applets feature adds the ability to apply conditional logic within EEM applets. Conditional logic introduces a control structure that can change the flow of actions within applets depending on conditional expressions.
-
Digital signature support--A new API performs digital signature verification for a Tcl script to check it the script is signed by Cisco before execution.
-
Support authenticating e-mail servers--The action mail command is modified to include an optional username and password.
-
SMTP IPv6 support--The keyword sourceaddr is added in Tcl e-mail templates to specify either an IPv6 or IPv4 address.
-
SNMP library extensions--The EEM applet action info and Tcl sys_reqinfo_snmp commands are enhanced to include functionality for SNMP getid, inform, trap, and set-type operations.
-
SNMP Notification IPv6 support--IPv6 address is supported for the source and destination IP addresses.
-
CLI Library XML-PI support--Provides a programmable interface which encapsulates IOS command-line interface (CLI) show commands in XML format in a consistent way across different Cisco products. Customers using XML-PI will be able to parse IOS show command output from within Tcl scripts using well-known keywords instead of having to depend on the use of regular expression support.
Embedded Event Manager 3.1
EEM 3.1 introduced one new event detector:
-
SNMP Object--The Simple Network Management Protocol (SNMP) object trap event detector provides an extension to replace the value when an SNMP trap with the specified SNMP object ID (OID) is encountered on a specific interface or address.
EEM 3.1 added an enhancement to the following event detector:
-
SNMP Notification--The SNMP notification event detector now can wait and intercept the outgoing SNMP traps and informs.
EEM 3.1 added enhancement to the following action:
-
Specify facility--The action syslog command has been enhanced to specify syslog facility.
EEM 3.1 introduces the following features:
-
Provides the ability to create a short description for the registered policy--A new description command has been introduced to register policies with a brief description in Cisco IOS CLI and Tcl policies. The show event manager policy available command and the show event manager policy registered command have been enhanced to add the description keyword to display the description of the registered applet.
-
Enables EEM policies to bypass AAA authorization--The event manager application command has been enhanced to provide authorization and bypass keywords to disable AAA.
-
Introduces CLI Library enhancements--Provides two new commands in the CLI library: cli_run and cli_run_interactive .
Embedded Event Manager 3.2
EEM 3.2 introduced the following new event detectors:
-
Neighbor Discovery--Neighbor Discovery event detector provides the ability to publish a policy to respond to automatic neighbor detection when: - a Cisco Discovery Protocol (CDP) cache entry is added, deleted or updated.
- a Link Layer Discovery Protocol (LLDP) cache entry is added, deleted, or updated.
- an interface link status changes.
- an interface line status changes.
-
Identity--Identity event detector generates an event when AAA authorization and authentication is successful, when failure occurs, or after normal user traffic on the port is allowed to flow.
-
Mac-Address-Table--Mac-Address-Table event detector generates an event when a MAC address is learned in the MAC address table.
Note |
The Mac-Address-Table event detector is supported only on switch platforms and can be used only on Layer 2 interfaces where MAC addresses are learned. Layer 3 interfaces do not learn addresses and devices do not usually support the mac-address-table infrastructure needed to notify EEM of a learned MAC address. |
EEM 3.2 also introduces new CLI commands to support the applets to work with the new event detectors.
Embedded Event Manager 4.0
EEM 4.0 introduces the following new features:
-
EEM Email Action Enhancements - TLS support for SMTP mail actions—The new optional secure keyword is added to the action mail CLI with tls and none keyword options. There are no updates to the corresponding Tcl Policy.
- Custom port for SMTP mail actions—The new optional port keyword is added to the action mail CLI. In the Tcl policy, the port number can be specified by adding a line to the e-mail template.
-
EEM Security Enhancements - Checksum-based script integrity—Where digital signature is not supported or unavailable, users can still enforce some basic integrity check on the TCL policy by using the Unix command openssl sha1 . The new optional checksum , md5 , and sha-1 keywords have been added to the event manager policy command.
- Third-party digital signature support—Requires Tcl secure mode and a trustpoint to associate with the TCL scripts in order to verify the signature.
- Script owner identification—If a policy is successfully registered with a digital signature, the owner (or signer) of the policy can be identified by using the show event manager policy registered command and checking the Dsig keyword in the show output.
- Registration of remote Tcl policies—The new optionalremote keyword has been added to the event manager policy command.
-
EEM Resource Management - Resource consumption throttling—The new optional resource-limit keyword has been added to the event manager scheduler command.
- Rate limiting of triggered policies per event—The new optional rate-limit keyword has been added to the event syslog command.
-
EEM Usability Enhancements - File operations in EEM applet actions—The new CLI action file has been added to allow file selection.
- New fields are added in EEM to track statistics of queue size, dropped events, and run-time using the show event manager statistics EXEC command. A set of new clear commands—clear event manager detector counters and clear event manager server counters —are introduced to clear the event manager queue counters.
-
EEM Event Detector Enhancements - CLI event detector enhancement—Provides the ability to detect the session where the user enters the event cli command. Four new keywords and built-in environmental variables—username, host, privilege, and tty— are added to the event cli applet and event_reqinfo array names to the event_register_cli event detector. The show event manager detector EXEC command has also been modified to reflect the enhancement.
- Syslog event detector performance enhancement—Provides the option to perform string matching on specific log message fields. The four new keywords—facility , mnemonic , sequence , and timestamp keywords— are added to the action syslog command, event syslog command, and to the event_register_syslog event detector. The show event manager detector EXEC command has also been modified to reflect the enhancement.
EEM Event Detectors Available by Cisco IOS Release
EEM uses software programs known as event detectors to determine when an EEM event occurs. Some event detectors are available on every Cisco IOS release, but most event detectors have been introduced in a specific release. Use the table below to determine which event detectors are available in your specific Cisco IOS release. A blank entry (--) indicates that the event detector is not available: the text “Yes” indicates that the event detector is available. The event detectors shown in the table are supported in later releases of the same Cisco IOS release train. For more details on each event detector, see the Event Detectors concept in the “Embedded Event Manager Overview” module.
|
Event Detector |
12.2(25)S |
12.3(14)T 12.2(18)SXF5 12.2(28)SB 12.2(33)SRA |
12.4(2)T 12.2(31)SB3 12.2(33)SRB |
12.2(18)SXF4 Cisco IOS Software Modularity |
12.2(33)SXH |
12.4(20)T 12.2(33)SXI |
12.4(22)T 12.2(33)SRE |
15.0(1)M 15.1(3)T |
15.1(2)SY |
15 E XE 3E |
|---|---|---|---|---|---|---|---|---|---|---|
|
Application-Specific |
Yes |
Yes |
Yes |
Yes |
Yes |
Yes |
Yes |
Yes |
Yes |
Yes |
|
CLI |
-- |
Yes |
Yes |
Yes |
Yes |
Yes |
Yes |
Yes |
-- |
Yes |
|
Counter |
Yes |
Yes |
Yes |
Yes |
Yes |
Yes |
Yes |
Yes |
Yes |
Yes |
|
Custom CLI |
-- |
-- |
-- |
-- |
-- |
-- |
Yes |
Yes |
-- |
-- |
|
Enhanced Object Tracking |
-- |
-- |
Yes |
-- |
Yes |
Yes |
Yes |
Yes |
-- |
-- |
|
Environmental |
-- |
-- |
-- |
-- |
-- |
-- |
-- |
-- |
-- |
Yes |
|
GOLD |
-- |
-- |
-- |
Yes |
Yes |
Yes |
Yes |
Yes |
-- |
Yes |
|
Identity |
-- |
-- |
-- |
-- |
-- |
-- |
-- |
Yes |
Yes |
Yes |
|
Interface Counter |
Yes |
Yes |
Yes |
Yes |
Yes |
Yes |
Yes |
Yes |
-- |
Yes |
|
IPSLA |
-- |
-- |
-- |
-- |
-- |
-- |
Yes |
Yes |
-- |
Yes |
|
Mac-Address-Table |
-- |
-- |
-- |
-- |
-- |
-- |
-- |
Yes |
Yes |
Yes |
|
Neighbor Discovery |
-- |
-- |
-- |
-- |
-- |
-- |
-- |
Yes |
Yes |
Yes |
|
NF |
-- |
-- |
-- |
-- |
-- |
-- |
Yes |
Yes |
-- |
-- |
|
None |
-- |
Yes |
Yes |
Yes |
Yes |
Yes |
Yes |
Yes |
Yes |
Yes |
|
OIR |
-- |
Yes |
Yes |
Yes |
Yes |
Yes |
Yes |
Yes |
Yes |
Yes |
|
Resource |
-- |
-- |
Yes |
Yes |
Yes |
Yes |
Yes |
Yes |
-- |
-- |
|
RF |
-- |
-- |
Yes |
Yes |
Yes |
Yes |
Yes |
Yes |
-- |
Yes |
|
Routing |
-- |
-- |
-- |
-- |
-- |
-- |
Yes |
Yes |
-- |
Yes |
|
RPC |
-- |
-- |
-- |
-- |
-- |
Yes |
Yes |
Yes |
Yes |
-- |
|
SNMP |
Yes |
Yes |
Yes |
Yes |
Yes |
Yes |
Yes |
Yes |
-- |
Yes |
|
SNMP Proxy |
-- |
-- |
-- |
-- |
-- |
-- |
-- |
-- |
Yes |
-- |
|
SNMP Notification |
-- |
-- |
-- |
-- |
-- |
Yes |
Yes |
Yes |
-- |
Yes |
|
SNMP Object |
-- |
-- |
-- |
-- |
-- |
-- |
-- |
Yes |
-- |
Yes |
|
Syslog |
Yes |
Yes |
Yes |
Yes |
Yes |
Yes |
Yes |
Yes |
Yes |
Yes |
|
System Manager |
-- |
-- |
-- |
Yes |
Yes |
Yes |
Yes |
Yes |
Yes |
-- |
|
Timer |
Yes |
Yes |
Yes |
Yes |
Yes |
Yes |
Yes |
Yes |
Yes |
Yes |
|
IOSWDSysMon (Cisco IOS watchdog) |
Yes |
Yes |
Yes |
Yes |
Yes |
Yes |
Yes |
Yes |
-- |
Yes |
|
WDSysMon (Cisco IOS Software Modularity watchdog) |
-- |
-- |
-- |
Yes |
-- |
-- |
-- |
-- |
-- |
Event Detectors
Embedded Event Manager (EEM) uses software programs known as event detectors to determine when an EEM event occurs. Event detectors are separate systems that provide an interface between the agent being monitored, for example Simple Network Management Protocol (SNMP), and the EEM policies where an action can be implemented. Some event detectors are available on every Cisco IOS release, but most event detectors have been introduced in a specific release. For details of which event detector is supported in each Cisco IOS release, see the EEM Event Detectors Available by Cisco IOS Release concept in the “Writing Embedded Event Manager Policies Using the Cisco IOS CLI” or the “Writing Embedded Event Manager Policies Using Tcl” modules. EEM contains the following event detectors.
Application-Specific Event Detector
The application-specific event detector allows any Embedded Event Manager policy to publish an event. When an EEM policy publishes an event it must use an EEM subsystem number of 798 with any event type. If an existing policy is registered for subsystem 798 and a specified event type, a second policy of the same event type will trigger the first policy to run when the specified event is published.
CLI Event Detector
The CLI event detector screens command-line interface (CLI) commands for a regular expression match. When a match is found, an event is published. The match logic is performed on the fully expanded CLI command after the command is successfully parsed and before it is executed. The CLI event detector supports three publish modes:
-
Synchronous publishing of CLI events--The CLI command is not executed until the EEM policy exits, and the EEM policy can control whether the command is executed. The read/write variable, _exit_status, allows you to set the exit status at policy exit for policies triggered from synchronous events. If _exit_status is 0, the command is skipped, if _exit_status is 1, the command is run.
-
Asynchronous publishing of CLI events--The CLI event is published, and then the CLI command is executed.
-
Asynchronous publishing of CLI events with command skipping--The CLI event is published, but the CLI command is not executed.
Counter Event Detector
The counter event detector publishes an event when a named counter crosses a specified threshold. There are two or more participants that affect counter processing. The counter event detector can modify the counter, and one or more subscribers define the criteria that cause the event to be published. After a counter event has been published, the counter monitoring logic can be reset to start monitoring the counter immediately or it can be reset when a second threshold--called an exit value--is crossed.
Custom CLI Event Detector
The custom CLI event detector publishes an event to add and enhance existing CLI command syntax. When the special parser characters Tab, ? (question mark), and Enter are entered, the parser sends the input to the custom CLI event detector for processing. The custom CLI event detector then compares this input against registered strings to determine if this is a new or enhanced CLI command. Upon a match the custom CLI event detector takes appropriate actions, such as displaying help for the command if ? is entered, displaying the entire command if Tab is entered, or executing the command if Enter was entered. If a match does not occur, the parser regains control and processes the information as usual.
Enhanced Object Tracking Event Detector
The enhanced object tracking (EOT) event detector publishes an event when the status of a tracked object changes. Object tracking was first introduced into the Hot Standby Router Protocol (HSRP) as a simple tracking mechanism that allowed you to track the interface line-protocol state only. If the line-protocol state of the interface went down, the HSRP priority of the device was reduced, allowing another HSRP device with a higher priority to become active.
Object tracking was enhanced to provide complete separation between the objects to be tracked and the action to be taken by a client when a tracked object changes. Thus, several clients such as HSRP, VRRP, or GLBP can register their interest with the tracking process, track the same object, and each take different action when the object changes. Each tracked object is identified by a unique number that is specified on the tracking command-line interface (CLI). Client processes use this number to track a specific object. The tracking process periodically polls the tracked objects and notes any change of value. The changes in the tracked object are communicated to interested client processes, either immediately or after a specified delay. The object values are reported as either up or down.
Enhanced object tracking is now integrated with EEM to allow EEM to report on a status change of a tracked object and to allow enhanced object tracking to track EEM objects. A new type of tracking object--a stub object--is created. The stub object can be manipulated using the existing CLI commands that already allow tracked objects to be manipulated.
GOLD Event Detector
The GOLD event detector publishes an event when a GOLD failure event is detected on a specified card and subcard.
Interface Counter Event Detector
The interface counter event detector publishes an event when a generic Cisco IOS interface counter for a specified interface crosses a defined threshold. A threshold can be specified as an absolute value or an incremental value. If the incremental value is set to 50, for example, an event would be published when the interface counter increases by 50.
After an interface counter event has been published, the interface counter monitoring logic is reset using two methods. The interface counter is reset either when a second threshold--called an exit value--is crossed or when an elapsed period of time occurs.
IP SLA Event Detector
The IP SLA event detector publishes an event when an IP SLA reaction is triggered.
NetFlow Event Detector
The NetFlow event detector publishes an event when a NetFlow event is triggered.
None Event Detector
The none event detector publishes an event when the Cisco IOS event manager run CLI command executes an EEM policy. EEM schedules and runs policies on the basis of an event specification that is contained within the policy itself. An EEM policy must be identified and registered to be permitted to run manually before the event manager run command will execute.
OIR Event Detector
The online insertion and removal (OIR) event detector publishes an event when one of the following hardware insertion or removal events occurs:
-
A card is removed.
-
A card is inserted.
Route Processors (RPs), line cards, or feature cards can be monitored for OIR events.
Resource Event Detector
The resource event detector publishes an event when the Embedded Resource Manager (ERM) reports an event for the specified policy. The ERM infrastructure tracks resource depletion and resource dependencies across processes and within a system to handle various error conditions. The error conditions are handled by providing an equitable sharing of resources between various applications. The ERM framework provides a communication mechanism for resource entities and allows communication between these resource entities from numerous locations. The ERM framework also helps in debugging CPU and memory-related issues. The ERM monitors system resource usage to better understand scalability needs by allowing you to configure threshold values for resources such as the CPU, buffers, and memory. The ERM event detector is the preferred method for monitoring resources in Cisco software but the ERM event detector is not supported in Software Modularity images. For more details about ERM, go to “Embedded Resource Manager” module.
RF Event Detector
The redundancy framework (RF) event detector publishes an event when one or more RF events occur during synchronization in a dual Route Processor (RP) system. The RF event detector can also detect an event when a dual RP system continuously switches from one RP to another RP (referred to as a ping-pong situation).
RPC Event Detector
The remote procedure call (RPC) event detector provides the ability to invoke EEM policies from outside the device over an encrypted connection using Secure Shell (SSH). The RPC event detector uses Simple Object Access Protocol (SOAP) data encoding for exchanging XML-based messages. This event detector can be used to run EEM policies and then receive output in a SOAP XML-formatted reply.
Routing Event Detector
The routing event detector publishes an event when a route entry changes in the Routing Information Base (RIB).
SNMP Event Detector
The SNMP event detector allows a standard SNMP MIB object to be monitored and an event to be generated when the object matches specified values or crosses specified thresholds.
SNMP Notification Event Detector
The SNMP notification event detector provides the ability to intercept SNMP trap and inform messages coming into or going out of the device. An SNMP notification event is generated when an incoming or outgoing SNMP trap or inform message matches specified values or crosses specified thresholds. The SNMP event detector can wait and intercept the outgoing SNMP traps and informs.
SNMP Object Event Detector
The Simple Network Management Protocol (SNMP) object trap event detector provides an extension to replace the value when an SNMP trap with the specified SNMP object ID (OID) is encountered on a specific interface or address.
Syslog Event Detector
The syslog event detector allows for screening syslog messages for a regular expression pattern match. The selected messages can be further qualified, requiring that a specific number of occurrences be logged within a specified time. A match on a specified event criteria triggers a configured policy action.
System Manager Event Detector
The system manager event detector generates events for Cisco IOS Software Modularity process start, normal or abnormal stop, and restart events. The events generated by the system manager allows policies to change the default behavior of the process restart.
Timer Event Detector
The timer event detector publishes events for the following four different types of timers:
-
An absolute-time-of-day timer publishes an event when a specified absolute date and time occurs.
-
A countdown timer publishes an event when a timer counts down to zero.
-
A watchdog timer publishes an event when a timer counts down to zero and then the timer automatically resets itself to its initial value and starts to count down again.
-
A CRON timer publishes an event using a UNIX standard CRON specification to indicate when the event is to be published. A CRON timer never publishes events more than once per minute.
Watchdog System Monitor (IOSWDSysMon) Event Detector for Cisco IOS
The Cisco IOS watchdog system monitor event detector publishes an event when one of the following occurs:
-
CPU utilization for a Cisco IOS task crosses a threshold.
-
Memory utilization for a Cisco IOS task crosses a threshold.
Note |
Cisco IOS processes are now referred to as tasks to distinguish them from Cisco IOS Software Modularity processes. |
Two events may be monitored at the same time, and the event publishing criteria can be specified to require one event or both events to cross their specified thresholds.
Watchdog System Monitor (WDSysMon) Event Detector for Cisco IOS Software Modularity
The Cisco IOS Software Modularity watchdog system monitor event detector detects infinite loops, deadlocks, and memory leaks in Cisco IOS Software Modularity processes.
EEM Actions Available by Cisco IOS Release
The CLI-based corrective actions that are taken when event detectors report events enable a powerful on-device event management mechanism. Some actions are available in every Cisco IOS release, but most actions have been introduced in a specific release. Use the table below to determine which actions are available in your specific Cisco IOS release. A blank entry (--) indicates that the action is not available; the text “Yes” indicates that the action is available. The actions shown in the table are supported in later releases of the same Cisco IOS release train. For more details on each action, see the Embedded Event Manager Actions concept in the “Embedded Event Manager Overview” module.
|
Action |
12.2(25)S |
12.3(14)T 12.2(18)SXF5 12.2(28)SB 12.2(33)SRA |
12.4(2)T 12.2(31)SB3 12.2(33)SRB |
12.2(18)SXF4 Cisco IOS Software Modularity |
12.2(33)SXH |
12.4(20)T |
12.4(22)T |
15.0(1)M |
15E XE 3E |
|---|---|---|---|---|---|---|---|---|---|
|
Execute a CLI command |
-- |
Yes |
Yes |
Yes |
Yes |
Yes |
Yes |
Yes |
Yes |
|
Generate a CNS event |
Yes |
Yes |
Yes |
Yes |
Yes |
Yes |
Yes |
Yes |
Yes |
|
Generate a prioritized syslog message |
Yes |
Yes |
Yes |
Yes |
Yes |
Yes |
Yes |
Yes |
Yes |
|
Generate an SNMP trap |
Yes |
Yes |
Yes |
Yes |
Yes |
Yes |
Yes |
Yes |
Yes |
|
Manually run an EEM policy |
-- |
Yes |
Yes |
Yes |
Yes |
Yes |
Yes |
Yes |
Yes |
|
Publish an application-specific event |
Yes |
Yes |
Yes |
Yes |
Yes |
Yes |
Yes |
Yes |
Yes |
|
Read the state of a tracked object |
-- |
-- |
Yes |
-- |
Yes |
Yes |
Yes |
Yes |
|
|
Reload the Cisco software |
Yes |
Yes |
Yes |
Yes |
Yes |
Yes |
Yes |
Yes |
Yes |
|
Request system information |
-- |
Yes |
Yes |
Yes |
Yes |
Yes |
Yes |
Yes |
Yes |
|
Send a short e-mail |
-- |
Yes |
Yes |
Yes |
Yes |
Yes |
Yes |
Yes |
Yes |
|
Set or modify a named counter |
Yes |
Yes |
Yes |
Yes |
Yes |
Yes |
Yes |
Yes |
Yes |
|
Set the state of a tracked object |
-- |
-- |
Yes |
-- |
Yes |
Yes |
Yes |
Yes |
|
|
Switch to a secondary RP |
Yes |
Yes |
Yes |
Yes |
Yes |
Yes |
Yes |
Yes |
Yes |
Embedded Event Manager Actions
The CLI-based corrective actions that are taken when event detectors report events enable a powerful on-device event management mechanism. Some EEM actions are available on every Cisco IOS release, but most EEM actions have been introduced in a specific release. For details of which EEM action is supported in each Cisco IOS release, see the EEM Actions Available by Cisco IOS Release concept in the “Writing Embedded Event Manager Policies Using the Cisco IOS CLI” or the “Writing Embedded Event Manager Policies Using Tcl” modules. EEM supports the following actions:
-
Executing a Cisco IOS command-line interface (CLI) command.
-
Generating a CNS event for upstream processing by Cisco CNS devices.
-
Setting or modifying a named counter.
-
Switching to a secondary processor in a fully redundant hardware configuration.
-
Requesting system information when an event occurs.
-
Sending a short e-mail.
-
Manually running an EEM policy.
-
Publishing an application-specific event.
-
Reloading the Cisco software.
-
Generating an SNMP trap.
-
Generating prioritized syslog messages.
-
Reading the state of a tracked object.
-
Setting the state of a tracked object.
EEM action CLI commands contain an EEM action label that is a unique identifier that can be any string value. Actions are sorted and run in ascending alphanumeric (lexicographical) key sequence using the label as the sort key. If you are using numbers as labels be aware that alphanumerical sorting will sort 10.0 after 1.0, but before 2.0, and in this situation we recommend that you use numbers such as 01.0, 02.0, and so on, or use an initial letter followed by numbers.
Embedded Event Manager Environment Variables
EEM allows environment variables to be used in EEM policies. Tool Command Language (Tcl) allows global variables to be defined that are known to all procedures within a Tcl script. EEM allows environment variables to be defined using a CLI command, the event manager environment command, for use within an EEM policy. All EEM environment variables are automatically assigned to Tcl global variables before a Tcl script is run. There are three different types of environment variables associated with Embedded Event Manager:
-
User-defined--Defined by you if you create an environment variable in a policy that you have written.
-
Cisco-defined--Defined by Cisco for a specific sample policy.
-
Cisco built-in (available in EEM applets)--Defined by Cisco and can be read only or read/write. The read only variables are set by the system before an applet starts to execute. The single read/write variable, _exit_status, allows you to set the exit status at policy exit for policies triggered from synchronous events.
Cisco-defined environment variables (see the table below) and Cisco system-defined environment variables may apply to one specific event detector or to all event detectors. Environment variables that are user-defined or defined by Cisco in a sample policy are set using the event manager environment command. Variables that are used in the EEM policy must be defined before you register the policy. A Tcl policy contains a section called “Environment Must Define” that can be defined to check that any required environment variables are defined before the policy runs.
Cisco built-in environment variables are a subset of the Cisco-defined environment variables and the built-in variables are available to EEM applets only. The built-in variables can be read-only or can be read and write, and these variables may apply to one specific event detector or to all event detectors. For more details and a table listing the Cisco system-defined variables, see the ““Writing Embedded Event Manager Policies Using the Cisco IOS CLI” module.
Note |
Cisco-defined environment variables begin with an underscore character (_). We strongly recommend that customers avoid the same naming convention to prevent naming conflicts. |
The table below describes the Cisco-defined variables used in the sample EEM policies. Some of the environment variables do not have to be specified for the corresponding sample policy to run and these are marked as optional.
|
Environment Variable |
Description |
Example |
|---|---|---|
|
_config_cmd1 |
The first configuration command that is executed. |
interface Ethernet1/0 |
|
_config_cmd2 |
(Optional) The second configuration command that is executed. |
no shutdown |
|
_crash_reporter_debug |
(Optional) A value that identifies whether debug information for tm_crash_reporter.tcl will be enabled. |
1 |
|
_crash_reporter_url |
The URL location to which the crash report is sent. |
http://www.yourdomain.com/ fm/interface_tm.cgi |
|
_cron_entry |
A CRON specification that determines when the policy will run. See the “Writing Embedded Event Manager Policies Using Tcl” module for more information about how to specify a cron entry. |
0-59/1 0-23/1 * * 0-7 |
|
_email_server |
A Simple Mail Transfer Protocol (SMTP) mail server used to send e-mail. |
mailserver.yourdomain.com |
|
_email_to |
The address to which e-mail is sent. |
engineer@yourdomain.com |
|
_email_from |
The address from which e-mail is sent. |
devtest@yourdomain.com |
|
_email_cc |
The address to which the e-mail is be copied. |
manager@yourdomain.com |
|
_email_ipaddr |
The source IP address of the recipient. |
209.165.201.1 or (IPv6 address) 2001:0DB8::1 |
|
_info_snmp_oid |
The SNMP object ID. |
1.3.6.1.2.1.2 or iso.internet.mgmt.mib-2.interfaces |
|
_info_snmp_value |
The value string of the associated SNMP data element. |
|
|
_show_cmd |
The CLI show command to be executed when the policy is run. |
show version |
|
_syslog_pattern |
A regular expression pattern match string that is used to compare syslog messages to determine when the policy runs. |
.*UPDOWN.*FastEthernet 0/0.* |
|
_tm_fsys_usage_cron |
(Optional) A CRON specification that is used in the event_register keyword extension. If unspecified, the _tm_fsys_usage.tcl policy is triggered once per minute. |
0-59/1 0-23/1 * * 0-7 |
|
_tm_fsys_usage_debug |
(Optional) When this variable is set to a value of 1, disk usage information is displayed for all entries in the system. |
1 |
|
_tm_fsys_usage_ freebytes |
(Optional) Free byte threshold for systems or specific prefixes. If free space falls below a given value, a warning is displayed. |
disk2:98000000 |
|
_tm_fsys_usage_percent |
(Optional) Disk usage percentage thresholds for systems or specific prefixes. If disk usage percentage exceeds a given percentage, a warning is displayed. If unspecified, the default disk usage percentage is 80 percent for all systems. |
nvram:25 disk2:5 |
Embedded Event Manager Policy Creation
EEM is a policy driven process in which the EEM policy engine receives notifications when faults and other events occur in the Cisco software system. Embedded Event Manager policies implement recovery based on the current state of the system and the actions specified in the policy for a given event. Recovery actions are triggered when the policy is run.
Although there are some EEM CLI configuration and show commands, EEM is implemented through the creation of policies. An EEM policy is an entity that defines an event and the actions to be taken when that event occurs. There are two types of EEM policies: an applet or a script. An applet is a simple form of policy that is defined within the CLI configuration. A script is a form of policy that is written in Tcl.
The creation of an EEM policy involves:
-
Selecting the event for which the policy is run.
-
Defining the event detector options associated with logging and responding to the event.
-
Defining the environment variables, if required.
-
Choosing the actions to be performed when the event occurs.
There are two ways to create an EEM policy. The first method is to write applets using CLI commands, and the second method is to write Tcl scripts. Cisco provides enhancements to Tcl in the form of Tcl command extensions that facilitate the development of EEM policies. Scripts are defined off the networking device using an ASCII editor. The script is then copied to the networking device and registered with EEM. When a policy is registered with the Embedded Event Manager, the software examines the policy and registers it to be run when the specified event occurs. Policies can be unregistered or suspended. Both types of policies can be used to implement EEM in your network.
For details on writing EEM policies using the Cisco IOS CLI, go to “Writing Embedded Event Manager Policies Using the Cisco IOS CLI” module.
For details on writing EEM policies using Tcl, go to “Writing Embedded Event Manager Policies Using Tcl” module.
 Feedback