Feedback
Table Of Contents
Troubleshooting the 4200 Series Appliance
Cannot Access the Sensor CLI Through Telnet or SSH
Duplicate IP Address Shuts Interface Down
Physical Connectivity, SPAN, or VACL Port Issue
Cleaning Up a Corrupted SensorApp Configuration
Verifying Network Access Controller is Running
Verifying Network Access Controller Connections are Active
Verifying the Interfaces and Directions on the Network Device
Enabling SSH Connections to the Network Device
Blocking Not Occurring for a Signature
Verifying the Master Blocking Sensor Configuration
Directing cidLog Messages to SysLog
Verifying the Sensor is Synchronized with the NTP Server
TCP Reset Not Occurring for a Signature
IDS-4235 and IDS-4250 Hang During A Software Upgrade
Which Updates to Apply and Their Prerequisites
Updating a Sensor with the Update Stored on the Sensor
Increasing the Memory Size of the Java Plug-In
Java Plug-In on Linux and Solaris
Cannot Launch IDM - Loading Java Applet Failed
Cannot Launch IDM -Analysis Engine Busy
IDM, Remote Manager, or Sensing Interfaces Cannot Access the Sensor
Signatures Not Producing Alerts
Switch Commands for Troubleshooting
Status LED On But IDSM-2 Does Not Come Online
Cannot Communicate With IDSM-2 Command and Control Port
Connecting a Serial Cable to IDSM-2
Displaying Tech Support Information
Displaying Version Information
Uploading and Accessing Files on the Cisco FTP Site
Troubleshooting
This appendix contains troubleshooting tips and procedures for sensors and software. It contains the following sections:
•
Troubleshooting the 4200 Series Appliance
Bug Toolkit
For the most complete and up-to-date list of caveats, use the Bug Toolkit to refer to the caveat release note. You can use the Bug Toolkit to search for known bugs based on software version, feature set, and keywords. The resulting matrix shows when each bug was integrated, or fixed if applicable. It also lets you save the results of a search in Bug Groups, and also create persistent Alert Agents that can feed those groups with new defect alerts.
Note
If you are a registered Cisco.com user, you can view the Bug Toolkit at this URL:
http://tools.cisco.com/Support/BugToolKit/action.do?hdnAction=searchBugs
To become a registered cisco.com user, go to this URL:
http://tools.cisco.com/RPF/register/register.do
Preventive Maintenance
The following actions will help you maintain your sensor:
•
•
•
•
A service account is needed for password recovery and other special debug situations directed by TAC. For the procedure, refer to Creating the Service Account.
Caution
Note
Disaster Recovery
This section provides recommendations and steps to take if you need to recover your sensor after a disaster.
Follow these recommendations so that you are ready in case of a disaster:
•
Note
Note
•
Note
Note
When a disaster happens and you need to recover the sensor, try the following:
1.
2.
Note
3.
4.
Warning5.
6.
7.
Password Recovery
The following password recovery options exist:
•
•
You can reimage the sensor using either the recovery partition or a system image file. For more information, refer to Upgrading, Downgrading, and Installing System Images.
.
Troubleshooting the 4200 Series Appliance
This section contains information to troubleshoot the 4200 series appliance.
Tip
This section contains the following topics:
•
•
Communication Problems
This section helps you troubleshoot communication problems with the 4200 series sensor. It contains the following topics:
•
•
Cannot Access the Sensor CLI Through Telnet or SSH
If you cannot access the sensor CLI through Telnet (if you already have it enabled) or SSH, follow these steps:
Note
Step 1
For the various ways to open a CLI session directly on the sensor, refer to Logging In to the Sensor.
Step 2
sensor# show interfacesInterface StatisticsTotal Packets Received = 0Total Bytes Received = 0Missed Packet Percentage = 0Current Bypass Mode = Auto_offMAC statistics from interface GigabitEthernet0/1Media Type = backplaneMissed Packet Percentage = 0Inline Mode = UnpairedPair Status = N/ALink Status = UpLink Speed = Auto_1000Link Duplex = Auto_FullTotal Packets Received = 0Total Bytes Received = 0Total Multicast Packets Received = 0Total Broadcast Packets Received = 0Total Jumbo Packets Received = 0Total Undersize Packets Received = 0Total Receive Errors = 0Total Receive FIFO Overruns = 0Total Packets Transmitted = 0Total Bytes Transmitted = 0Total Multicast Packets Transmitted = 0Total Broadcast Packets Transmitted = 0Total Jumbo Packets Transmitted = 0Total Undersize Packets Transmitted = 0Total Transmit Errors = 0Total Transmit FIFO Overruns = 0MAC statistics from interface GigabitEthernet0/0Media Type = TXLink Status = UpLink Speed = Auto_100Link Duplex = Auto_FullTotal Packets Received = 944333Total Bytes Received = 83118358Total Multicast Packets Received = 0Total Receive Errors = 0Total Receive FIFO Overruns = 0Total Packets Transmitted = 397633Total Bytes Transmitted = 435730956Total Transmit Errors = 0Total Transmit FIFO Overruns = 0sensor#The management interface is the interface in the list with the status line
Media Type = TX. If the Link Status isDown, go to Step 3. If the Link Status isUp, go to Step 5.Step 3
sensor# setup--- System Configuration Dialog ---At any point you may enter a question mark '?' for help.User ctrl-c to abort configuration dialog at any prompt.Default settings are in square brackets '[]'.Current Configuration:service hostnetwork-settingshost-ip 10.89.130.108/23,10.89.130.1host-name sensortelnet-option enabledaccess-list 0.0.0.0/0ftp-timeout 300no login-banner-textexit--MORE--If the management interface detects that another device on the network has the same IP address, it will not come up.
For more information, refer to Changing the IP Address, Netmask, and Gateway.
Step 4
If the management port is not connected to an active network connection, the management interface will not come up.
Step 5
sensor# setup--- System Configuration Dialog ---At any point you may enter a question mark '?' for help.User ctrl-c to abort configuration dialog at any prompt.Default settings are in square brackets '[]'.Current Configuration:service hostnetwork-settingshost-ip 10.89.130.108/23,10.89.130.1host-name sensortelnet-option enabledaccess-list 0.0.0.0/0ftp-timeout 300no login-banner-textexit--MORE--If the workstation's network address is permitted in the sensor's access list, go to Step 6.
Step 6
For more information, refer to Changing the Access List.
Step 7
If the sensor is protected behind a firewall and the workstation is in front of the firewall, make sure the firewall is configured to allow the workstation to access the sensor. Or if the workstation is behind a firewall that is performing network address translation on the workstation's IP address, and the sensor is in front of the firewall, make sure that the sensor's access list contains a permit entry for the workstation's translated address.
For more information, refer to Changing the Access List.
Misconfigured Access List
To correct a misconfigured access list, follow these steps:
Step 1
Step 2
sensor# show configuration | include access-listaccess-list 10.0.0.0/8access-list 64.0.0.0/8sensor#Step 3
sensor# configure terminalsensor(config)# service hostsensor(config-hos)# network-settingssensor(config-hos-net)# access-list 171.69.70.0/24Step 4
sensor(config-hos-net)# show settingsnetwork-settings-----------------------------------------------host-ip: 10.89.149.238/25,10.89.149.254 default: 10.1.9.201/24,10.1.9.1host-name: qsensor-238 default: sensortelnet-option: enabled default: disabledaccess-list (min: 0, max: 512, current: 3)-----------------------------------------------network-address: 10.0.0.0/8-----------------------------------------------network-address: 64.0.0.0/8-----------------------------------------------network-address: 171.69.70.0/24----------------------------------------------------------------------------------------------ftp-timeout: 300 seconds <defaulted>login-banner-text: <defaulted>-----------------------------------------------sensor(config-hos-net)#
Duplicate IP Address Shuts Interface Down
If you have two newly imaged sensors with the same IP address that come up on the same network at the same time, the interface shuts down. Linux prevents the command and control interface from activating if it detects an address conflict with another host.
To verify that the sensor in question does not have an IP address conflict with another host on the network, follow these steps:
Step 1
Step 2
sensor# show interfacesInterface StatisticsTotal Packets Received = 0Total Bytes Received = 0Missed Packet Percentage = 0Current Bypass Mode = Auto_offMAC statistics from interface GigabitEthernet0/1Media Type = backplaneMissed Packet Percentage = 0Inline Mode = UnpairedPair Status = N/ALink Status = UpLink Speed = Auto_1000Link Duplex = Auto_FullTotal Packets Received = 0Total Bytes Received = 0Total Multicast Packets Received = 0Total Broadcast Packets Received = 0Total Jumbo Packets Received = 0Total Undersize Packets Received = 0Total Receive Errors = 0Total Receive FIFO Overruns = 0Total Packets Transmitted = 0Total Bytes Transmitted = 0Total Multicast Packets Transmitted = 0Total Broadcast Packets Transmitted = 0Total Jumbo Packets Transmitted = 0Total Undersize Packets Transmitted = 0Total Transmit Errors = 0Total Transmit FIFO Overruns = 0MAC statistics from interface GigabitEthernet0/0Media Type = TXLink Status = UpLink Speed = Auto_100Link Duplex = Auto_FullTotal Packets Received = 1822323Total Bytes Received = 131098876Total Multicast Packets Received = 20Total Receive Errors = 0Total Receive FIFO Overruns = 0Total Packets Transmitted = 219260Total Bytes Transmitted = 103668610Total Transmit Errors = 0Total Transmit FIFO Overruns = 0sensor#If the output says the command and control interface link status is down, there is a hardware issue or an IP address conflict.
Step 3
Refer to the chapter for your sensor in Installing Cisco Intrusion Prevention System Appliances and Modules 5.0.
Step 4
For the procedure, see Initializing the Sensor.
SensorApp and Alerting
This section helps you troubleshoot issues with SensorApp and alerting. It contains the following topics:
•
•
SensorApp Not Running
The sensing process, SensorApp, should always be running. If it is not, you do not receive any alerts. SensorApp is part of AnalysisEngine, so you must make sure the AnalysisEngine is running.
To make sure AnalysisEngine is running, follow these steps:
Step 1
Step 2
sensor# show versionApplication Partition:Cisco Intrusion Prevention System, Version 5.0(1)S149.0OS Version 2.4.26-IDS-smp-bigphysPlatform: ASA-SSM-20Serial Number: 021No license presentSensor up-time is 19 days.Using 505495552 out of 1984704512 bytes of available memory (25% usage)system is using 17.3M out of 29.0M bytes of available disk space (59% usage)application-data is using 37.7M out of 166.6M bytes of available disk space (24% usage)boot is using 40.5M out of 68.5M bytes of available disk space (62% usage)MainApp 2005_Mar_04_14.23 (Release) 2005-03-04T14:35:11-0600 RunningAnalysisEngine 2005_Mar_04_14.23 (Release) 2005-03-04T14:35:11-0600 Not RunningCLI 2005_Mar_04_14.23 (Release) 2005-03-04T14:35:11-0600Upgrade History:IDS-K9-maj-5.0-1- 14:16:00 UTC Thu Mar 04 2004Recovery Partition Version 1.1 - 5.0(1)S149sensor#Step 3
sensor# show events error fatal past 13:00:00 | include AnalysisEngineevError: eventId=1077219258696330005 severity=warningoriginator:hostId: sensorappName: sensorAppappInstanceId: 1045time: 2004/02/19 19:34:20 2004/02/19 19:34:20 UTCerrorMessage: name=errUnclassified Generating new Analysis Engine configuration file.
Note
Step 4
sensor# show versionUpgrade History:IDS-K9-maj-5.0-1- 14:16:00 UTC Thu Mar 04 2004Recovery Partition Version 1.1 - 5.0(1)S149If you do not have the latest software updates, download them from Cisco.com. For the procedure, see Obtaining Cisco IPS Software.
Step 5
Physical Connectivity, SPAN, or VACL Port Issue
If the sensor is not connected properly, you do not receive any alerts.
To make sure the sensor is connected properly, follow these steps:
Step 1
Step 2
sensor# show interfacesInterface StatisticsTotal Packets Received = 0Total Bytes Received = 0Missed Packet Percentage = 0Current Bypass Mode = Auto_offMAC statistics from interface GigabitEthernet0/1Media Type = backplaneMissed Packet Percentage = 0Inline Mode = UnpairedPair Status = N/ALink Status = UpLink Speed = Auto_1000Link Duplex = Auto_FullTotal Packets Received = 0Total Bytes Received = 0Total Multicast Packets Received = 0Total Broadcast Packets Received = 0Total Jumbo Packets Received = 0Total Undersize Packets Received = 0Total Receive Errors = 0Total Receive FIFO Overruns = 0Total Packets Transmitted = 0Total Bytes Transmitted = 0Total Multicast Packets Transmitted = 0Total Broadcast Packets Transmitted = 0Total Jumbo Packets Transmitted = 0Total Undersize Packets Transmitted = 0Total Transmit Errors = 0Total Transmit FIFO Overruns = 0MAC statistics from interface GigabitEthernet0/0Media Type = TXLink Status = UpLink Speed = Auto_100Link Duplex = Auto_FullTotal Packets Received = 1830137Total Bytes Received = 131624465Total Multicast Packets Received = 20Total Receive Errors = 0Total Receive FIFO Overruns = 0Total Packets Transmitted = 220052Total Bytes Transmitted = 103796666Total Transmit Errors = 0Total Transmit FIFO Overruns = 0sensor#Step 3
a.
b.
Step 4
a.
b.
Step 5
sensor# show interfaces
Unable to See Alerts
If you are not seeing alerts, try the following:
•
•
•
Note
•
•
To make sure you can see alerts, follow these steps:
Step 1
Step 2
sensor# configure terminalsensor(config)# service signature-definition sig0sensor(config-sig)# signatures 1300 0sensor(config-sig-sig)# statussensor(config-sig-sig-sta)# show settingsstatus-----------------------------------------------enabled: true <defaulted>retired: false <defaulted>-----------------------------------------------sensor(config-sig-sig-sta)#Step 3
sensor# configure terminalsensor(config)# service signature-definition sig0sensor(config-sig)# signatures 1300 0sensor(config-sig-sig)# engine ?normalizer Signature enginesensor(config-sig-sig)# engine normalizersensor(config-sig-sig-nor)# event-action produce-alertsensor(config-sig-sig-nor)# show settingsnormalizer-----------------------------------------------event-action: produce-alert default: produce-alert|deny-connection-inlineedit-default-sigs-only-----------------------------------------------sensor#Step 4
sensor# show interfaces FastEthernet0/1MAC statistics from interface FastEthernet0/1Media Type = backplaneMissed Packet Percentage = 0Inline Mode = UnpairedPair Status = N/ALink Status = UpLink Speed = Auto_100Link Duplex = Auto_FullTotal Packets Received = 267581Total Bytes Received = 24886471Total Multicast Packets Received = 0Total Broadcast Packets Received = 0Total Jumbo Packets Received = 0Total Undersize Packets Received = 0Total Receive Errors = 0Total Receive FIFO Overruns = 0Total Packets Transmitted = 57301Total Bytes Transmitted = 3441000Total Multicast Packets Transmitted = 0Total Broadcast Packets Transmitted = 0Total Jumbo Packets Transmitted = 0Total Undersize Packets Transmitted = 0Total Transmit Errors = 1Total Transmit FIFO Overruns = 0sensor#Step 5
sensor# show statistics virtual-sensorSigEvent Preliminary Stage StatisticsNumber of Alerts received = 0Number of Alerts Consumed by AlertInterval = 0Number of Alerts Consumed by Event Count = 0Number of FireOnce First Alerts = 0Number of FireOnce Intermediate Alerts = 0Number of Summary First Alerts = 0Number of Summary Intermediate Alerts = 0Number of Regular Summary Final Alerts = 0Number of Global Summary Final Alerts = 0Number of Alerts Output for further processing = 0alertDetails: Traffic Source: int0 ;
Sensor Not Seeing Packets
If the sensor is not seeing any packets on the network, you could have the interfaces set up incorrectly.
If the sensor is not seeing packets, follow these steps:
Step 1
Step 2
sensor# show interfaces GigabitEthernet0/1MAC statistics from interface GigabitEthernet0/1Media Type = backplaneMissed Packet Percentage = 0Inline Mode = UnpairedPair Status = N/ALink Status = DownLink Speed = Auto_1000Link Duplex = Auto_FullTotal Packets Received = 0Total Bytes Received = 0Total Multicast Packets Received = 0Total Broadcast Packets Received = 0Total Jumbo Packets Received = 0Total Undersize Packets Received = 0Total Receive Errors = 0Total Receive FIFO Overruns = 0Total Packets Transmitted = 0Total Bytes Transmitted = 0Total Multicast Packets Transmitted = 0Total Broadcast Packets Transmitted = 0Total Jumbo Packets Transmitted = 0Total Undersize Packets Transmitted = 0Total Transmit Errors = 0Total Transmit FIFO Overruns = 0sensor#Step 3
a.
b.
sensor# configure terminalsensor(config)# service interfacesensor(config-int)# physical-interfaces GigabitEthernet0/1sensor(config-int-phy)# admin-state enabledsensor(config-int-phy)# show settings<protected entry>name: GigabitEthernet0/1-----------------------------------------------media-type: tx <protected>description: <defaulted>admin-state: enabled default: disabledduplex: auto <defaulted>speed: auto <defaulted>alt-tcp-reset-interface-----------------------------------------------none--------------------------------------------------------------------------------------------------------------------------------------------------------------------------------------------sensor(config-int-phy)#Step 4
sensor# show interfacesMAC statistics from interface GigabitEthernet0/1Media Type = TXMissed Packet Percentage = 0Inline Mode = UnpairedPair Status = N/ALink Status = UpLink Speed = Auto_100Link Duplex = Auto_FullTotal Packets Received = 3Total Bytes Received = 900Total Multicast Packets Received = 3Total Broadcast Packets Received = 0Total Jumbo Packets Received = 0Total Undersize Packets Received = 0Total Receive Errors = 0Total Receive FIFO Overruns = 0Total Packets Transmitted = 0Total Bytes Transmitted = 0Total Multicast Packets Transmitted = 0Total Broadcast Packets Transmitted = 0Total Jumbo Packets Transmitted = 0Total Undersize Packets Transmitted = 0Total Transmit Errors = 0Total Transmit FIFO Overruns = 0 ...
Cleaning Up a Corrupted SensorApp Configuration
If the SensorApp configuration has become corrupted and SensorApp cannot run, you must delete it entirely and restart SensorApp.
To delete the SensorApp configuration, follow these steps:
Step 1
Step 2
Step 3
/etc/init.d/cids stopStep 4
cp /usr/cids/idsRoot/etc/defVirtualSensorConfig.xml
/usr/cids/idsRoot/etc/VS-Config/virtualSensor.xml
Step 5
rm /usr/cids/idsRoot/var/virtualSensor/*.pmzStep 6
Step 7
Step 8
sensor# cids startStep 9
Step 10
sensor# resetWarning: Executing this command will stop all applications and reboot the node.Continue with reset? [yes]:yesRequest Succeeded.sensor#
Bad Memory on IDS-4250-XL
Some IDS-4250-XLs were shipped with faulty DIMMs on the XL cards. The faulty DIMMs cause the sensor to hang or SensorApp to stop functioning and generate a core file. See the Partner Field 52563 for the procedure for checking IDS-4250-XL for faulty memory.
Blocking
This section provides troubleshooting help for blocking and the Network Access Controller service. It contains the following topics.
•
•
•
•
•
•
Troubleshooting Blocking
After you have configured Network Access Controller, you can verify if it is running properly by using the show version command. To verify that Network Access Controller is connecting to the network devices, use the show statistics network-access command.
To troubleshoot Network Access Controller, follow these steps:
1.
2.
3.
4.
Note
Verifying Network Access Controller is Running
To verify that Network Access Controller is running, use the show version command. If MainApp is not running, Network Access Controller cannot run. Network Access Controller is part of MainApp.
Step 1
Step 2
sensor# show versionApplication Partition:Cisco Intrusion Prevention System, Version 5.0(1.1)S152.0OS Version 2.4.26-IDS-smp-bigphysPlatform: IPS-4255-K9Serial Number: JAB0815R017No license presentSensor up-time is 3 days.Using 734863360 out of 3974291456 bytes of available memory (18% usage)system is using 17.3M out of 29.0M bytes of available disk space (59% usage)application-data is using 35.6M out of 166.8M bytes of available disk space (23% usage)boot is using 40.5M out of 68.6M bytes of available disk space (62% usage)MainApp 2005_Mar_04_14.23 (Release) 2005-03-04T14:35:11-0600 Not RunningAnalysisEngine 2005_Mar_18_12.53 (Release) 2005-03-18T13:03:21-0600 RunningCLI 2005_Mar_04_14.23 (Release) 2005-03-04T14:35:11-0600Upgrade History:IDS-K9-sp-5.0-1.1- 12:53:00 UTC Fri Mar 18 2005Recovery Partition Version 1.1 - 5.0(1.1)sensor#Step 3
Not Running, Network Access Controller has failed. Contact the TAC.
Verifying Network Access Controller Connections are Active
If the State is not
Activein the Network Access Controller statistics, there is a problem.To verify that the State is Active in the statistics, follow these steps:
Step 1
Step 2
sensor# show statistics network-accessCurrent ConfigurationLogAllBlockEventsAndSensors = trueEnableNvramWrite = falseEnableAclLogging = falseAllowSensorBlock = falseBlockMaxEntries = 250MaxDeviceInterfaces = 250NetDeviceType = CiscoIP = 10.89.147.54NATAddr = 0.0.0.0Communications = telnetBlockInterfaceInterfaceName = fa0/0InterfaceDirection = inStateBlockEnable = trueNetDeviceIP = 10.89.147.54AclSupport = uses Named ACLsVersion = 12.2State = Activesensor#Step 3
sensor# show events error hh:mm:ss month day year | include : nacExample:
sensor# show events error 00:00:00 Apr 01 2005 | include : nacStep 4
sensor# show versionUpgrade History:IDS-K9-maj-5.0-1- 14:16:00 UTC Thu Mar 04 2004Recovery Partition Version 1.1 - 5.0(1)S149If you do not have the latest software updates, download them from Cisco.com. For the procedure, see Obtaining Cisco IPS Software.
Step 5
Step 6
Step 7
Step 8
Step 9
Device Access Issues
Network Access Controller may not be able to access the devices it is managing. Make sure the you have the correct IP address and username and password for the managed devices and the correct interface and direction configured.
Note
To troubleshoot device access issues, follow these steps:
Step 1
Step 2
sensor# configure terminalsensor (config)# service network-accesssensor(config-net)# show settingsgeneral-----------------------------------------------log-all-block-events-and-errors: true <defaulted>enable-nvram-write: false <defaulted>enable-acl-logging: false <defaulted>allow-sensor-block: false <defaulted>block-enable: true <defaulted>block-max-entries: 250 <defaulted>max-interfaces: 250 <defaulted>master-blocking-sensors (min: 0, max: 100, current: 0)----------------------------------------------------------------------------------------------never-block-hosts (min: 0, max: 250, current: 0)----------------------------------------------------------------------------------------------never-block-networks (min: 0, max: 250, current: 0)----------------------------------------------------------------------------------------------block-hosts (min: 0, max: 250, current: 0)----------------------------------------------------------------------------------------------block-networks (min: 0, max: 250, current: 0)---------------------------------------------------------------------------------------------------------------------------------------------user-profiles (min: 0, max: 250, current: 1)-----------------------------------------------profile-name: r7200-----------------------------------------------enable-password: <hidden>password: <hidden>username: netrangr default:----------------------------------------------------------------------------------------------cat6k-devices (min: 0, max: 250, current: 0)----------------------------------------------------------------------------------------------router-devices (min: 0, max: 250, current: 1)-----------------------------------------------ip-address: 10.89.147.54-----------------------------------------------communication: telnet default: ssh-3desnat-address: 0.0.0.0 <defaulted>profile-name: r7200block-interfaces (min: 0, max: 100, current: 1)-----------------------------------------------interface-name: fa0/0direction: in-----------------------------------------------pre-acl-name: <defaulted>post-acl-name: <defaulted>--------------------------------------------------------------------------------------------------------------------------------------------------------------------------------------------firewall-devices (min: 0, max: 250, current: 0)----------------------------------------------------------------------------------------------sensor(config-net)#Step 3
a.
b.
c.
d.
Step 4
Verifying the Interfaces and Directions on the Network Device
To verify that each interface and direction on each controlled device is correct, you can send a manual block to a bogus host and then check to see if deny entries exist for the blocked addresses in the router's ACL.
Note
To initiate a manual block to a bogus host, follow these steps:
Step 1
sensor# configure terminalsensor(config)# service network-accesssensor(config-net)# generalStep 2
sensor(config-net-gen)# block-hosts 10.16.0.0Step 3
sensor(config-net-gen)# exitsensor(config-net)# exitApply Changes:? [yes]:Step 4
Step 5
Step 6
sensor(config-net-gen)# no block-hosts 10.16.0.0
Enabling SSH Connections to the Network Device
If you are using SSH-DES or SSH-3DES as the communication protocol for the network device, you must make sure you have enabled it on the device.
To enable SSH connections to the network device, follow these steps:
Step 1
Step 2
sensor# configure terminalStep 3
sensor(config)# ssh host blocking_device_ip_ addressStep 4
Blocking Not Occurring for a Signature
If blocking is not occurring for a specific signature, check that the event action is set to block the host.
To make sure blocking is occurring for a specific signature, follow these steps:
Step 1
Step 2
sensor# configure terminalsensor(config)# service signature-definition sig0sensor(config-sig)#Step 3
Note
sensor(config-sig)# signatures 1300 0sensor(config-sig-sig)# engine normalizersensor(config-sig-sig-nor)# event-action produce-alert|request-block-hostsensor(config-sig-sig-nor)# show settingsnormalizer-----------------------------------------------event-action: produce-alert|request-block-host default: produce-alert|deny-connection-inlineedit-default-sigs-only-----------------------------------------------default-signatures-only-----------------------------------------------specify-service-ports-----------------------------------------------no---------------------------------------------------------------------------------------------------------------------------------------------specify-tcp-max-mss-----------------------------------------------no---------------------------------------------------------------------------------------------------------------------------------------------specify-tcp-min-mss-----------------------------------------------no------------------------------------------------------------------------------------------------MORE--Step 4
sensor(config-sig-sig-nor)# exitsensor(config-sig-sig)# exitsensor(config-sig)# exitApply Changes:?[yes]:Step 5
Verifying the Master Blocking Sensor Configuration
To verify that a master blocking sensor is set up properly or to troubleshoot a master blocking sensor that is not set up properly, you can use the show statistics network-access command. Make sure that the forwarding sensor is set up as TLS trusted host if the remote master blocking sensor is using TLS for web access.
To verify a sensor's master blocking sensor configuration, follow these steps:
Step 1
sensor# show statistics network-accessCurrent ConfigurationAllowSensorShun = falseShunMaxEntries = 250MasterBlockingSensorSensorIp = 10.89.149.46SensorPort = 443UseTls = 1StateShunEnable = trueShunnedAddrHostIP = 122.122.122.44ShunMinutes = 60MinutesRemaining = 59Step 2
Step 3
sensor# configure terminalsensor(config)# service network-accesssensor(config-net)# generalsensor(config-net-gen)# block-hosts 10.16.0.0Step 4
sensor(config-net-gen)# exitsensor(config-net)# exitApply Changes:? [yes]:Step 5
Step 6
sensor# show statistics network-accessCurrent ConfigurationAllowSensorShun = falseShunMaxEntries = 100StateShunEnable = trueShunnedAddrHostIP = 10.16.0.0ShunMinutes =Step 7
sensor# show statistics network-accessCurrent ConfigurationAllowSensorShun = falseShunMaxEntries = 250MasterBlockingSensorSensorIp = 10.89.149.46SensorPort = 443UseTls = 1StateShunEnable = trueShunnedAddrHostIP = 10.16.0.0ShunMinutes = 60MinutesRemaining = 59Step 8
sensor# configure terminalsensor(config)# tls trust ip master_blocking_sensor_ip_address
Logging
TAC may suggest that you turn on debug logging for troubleshooting purposes. LogApp controls what log messages are generated by each application by controlling the logging severity for different logging zones. By default, debug logging is not turned on.
If you enable individual zone control, each zone uses the level of logging that it is configured for. Otherwise, the same logging level is used for all zones.
This section contains the following topics:
•
Enabling Debug Logging
Caution
To enable debug logging, follow these steps:
Step 1
Step 2
vi /usr/cids/idsRoot/etc/log.confStep 3
fileMaxSizeInK=500tofileMaxSizeInK=5000.Step 4
severity=debugStep 5
Step 6
Step 7
sensor# configure terminalsensor(config)# service loggersensor(config-log)# master-controlStep 8
sensor(config-log-mas)# enable-debug truesensor(config-log-mas)# show settingsmaster-control-----------------------------------------------enable-debug: true default: falseindividual-zone-control: false <defaulted>-----------------------------------------------sensor(config-log-mas)#Step 9
sensor(config-log-mas)# individual-zone-control truesensor(config-log-mas)# show settingsmaster-control-----------------------------------------------enable-debug: true default: falseindividual-zone-control: true default: false-----------------------------------------------sensor(config-log-mas)#Step 10
sensor(config-log-mas)# exitStep 11
sensor(config-log)# show settingsmaster-control-----------------------------------------------enable-debug: false <defaulted>individual-zone-control: true default: false-----------------------------------------------zone-control (min: 0, max: 999999999, current: 14)-----------------------------------------------<protected entry>zone-name: AuthenticationAppseverity: warning <defaulted><protected entry>zone-name: Cidseverity: debug <defaulted><protected entry>zone-name: Cliseverity: warning <defaulted><protected entry>zone-name: IdapiCtlTransseverity: warning <defaulted><protected entry>zone-name: IdsEventStoreseverity: warning <defaulted><protected entry>zone-name: MpInstallerseverity: warning <defaulted><protected entry>zone-name: cmgrseverity: warning <defaulted><protected entry>zone-name: cplaneseverity: warning <defaulted><protected entry>zone-name: csiseverity: warning <defaulted><protected entry>zone-name: ctlTransSourceseverity: warning <defaulted><protected entry>zone-name: intfcseverity: warning <defaulted><protected entry>zone-name: nacseverity: warning <defaulted><protected entry>zone-name: sensorAppseverity: warning <defaulted><protected entry>zone-name: tlsseverity: warning <defaulted>-----------------------------------------------sensor(config-log)#For a list of what each zone name refers to, see Zone Names.
Step 12
sensor(config-log)# zone-control IdsEventStore severity errorsensor(config-log)# show settingsmaster-control-----------------------------------------------enable-debug: true default: falseindividual-zone-control: true default: false-----------------------------------------------zone-control (min: 0, max: 999999999, current: 14)-----------------------------------------------<protected entry>zone-name: AuthenticationAppseverity: warning <defaulted><protected entry>zone-name: Cidseverity: debug <defaulted><protected entry>zone-name: Cliseverity: warning <defaulted><protected entry>zone-name: IdapiCtlTransseverity: warning <defaulted><protected entry>zone-name: IdsEventStoreseverity: error default: warning<protected entry>zone-name: MpInstallerseverity: warning <defaulted><protected entry>zone-name: cmgrseverity: warning <defaulted><protected entry>zone-name: cplaneseverity: warning <defaulted><protected entry>zone-name: csiseverity: warning <defaulted><protected entry>zone-name: ctlTransSourceseverity: warning <defaulted><protected entry>zone-name: intfcseverity: warning <defaulted><protected entry>zone-name: nacseverity: warning <defaulted><protected entry>zone-name: sensorAppseverity: warning <defaulted><protected entry>zone-name: tlsseverity: warning <defaulted>-----------------------------------------------sensor(config-log)#Step 13
sensor(config-log)# zone-control nac severity debugsensor(config-log)# show settingsmaster-control-----------------------------------------------enable-debug: true default: falseindividual-zone-control: true default: false-----------------------------------------------zone-control (min: 0, max: 999999999, current: 14)-----------------------------------------------<protected entry>zone-name: AuthenticationAppseverity: warning <defaulted><protected entry>zone-name: Cidseverity: debug <defaulted><protected entry>zone-name: Cliseverity: warning <defaulted><protected entry>zone-name: IdapiCtlTransseverity: warning <defaulted><protected entry>zone-name: IdsEventStoreseverity: error default: warning<protected entry>zone-name: MpInstallerseverity: warning <defaulted><protected entry>zone-name: cmgrseverity: warning <defaulted><protected entry>zone-name: cplaneseverity: warning <defaulted><protected entry>zone-name: csiseverity: warning <defaulted><protected entry>zone-name: ctlTransSourceseverity: warning <defaulted><protected entry>zone-name: intfcseverity: warning <defaulted><protected entry>zone-name: nacseverity: debug default: warning<protected entry>zone-name: sensorAppseverity: warning <defaulted><protected entry>zone-name: tlsseverity: warning <defaulted>-----------------------------------------------sensor(config-log)#Step 14
sensor(config-log)# exitApply Changes:?[yes]:Step 15
Zone Names
Table B-1 lists the debug logger zone names:
Table B-1 Debug Logger Zone Names
AuthenticationApp
Authentication zone
Cid
General logging zone
Cli
CLI zone
IdapiCtlTrans
All control transactions zone
IdsEventStore
Event Store zone
MpInstaller
IDSM-2 master partition installer zone
cmgr
Card Manager service zone1
cplane
Control Plane zone2
csi
CIDS Servlet Interface3
ctlTransSource
Outbound control transactions zone
intfc
Interface zone
nac
Network Access Controller zone
sensorApp
AnalysisEngine zone
tls
SSL and TLS zone
1 The Card Manager service is used on AIP-SSM to exchange control and state information between modules in the chassis.
2 The Control Plane is the transport communications layer used by Card Manager on AIP-SSM.
3 The CIDS servlet interface is the interface layer between the CIDS web server and the servlets.
Directing cidLog Messages to SysLog
It might be useful to direct cidLog messages to syslog.
To direct cidLog messages to syslog, follow these steps:
Step 1
Step 2
a.
enabled=falseComment out the
enabled=truebecauseenabled=falseis the default.b.
type=syslogThe following example shows the logging configuration file:
timemode=local;timemode=utc[logApp];enabled=true;-------- FIFO parameters --------fifoName=logAppFifofifoSizeInK=240;-------- logApp zone and drain parameters --------zoneAndDrainName=logAppfileName=main.logfileMaxSizeInK=500[zone/Cid]severity=warningdrain=main[zone/IdsEventStore]severity=debugdrain=main[drain/main]type=syslogThe syslog output is sent to the syslog facility local6 with the following correspondence to syslog message priorities:
LOG_DEBUG, // debug
LOG_INFO, // timing
LOG_WARNING, // warning
LOG_ERR, // error
LOG_CRIT // fatal
Note
Caution
Verifying the Sensor is Synchronized with the NTP Server
In IPS 5.0, you cannot apply an incorrect NTP configuration, such as an invalid NTP key value or ID, to the sensor. If you try to apply an incorrect configuration, you receive an error message. To verify the NTP configuration, use the show statistics host command to gather sensor statistics. The NTP statistics section provides NTP statistics including feedback on sensor synchronization with the NTP server.
To verify the NTP configuration, follow these steps:
Step 1
Step 2
sensor# show statistics host...NTP Statisticsremote refid st t when poll reach delay offset jitter11.22.33.44 CHU_AUDIO(1) 8 u 36 64 1 0.536 0.069 0.001LOCAL(0) 73.78.73.84 5 l 35 64 1 0.000 0.000 0.001ind assID status conf reach auth condition last_event cnt1 10372 f014 yes yes ok reject reachable 12 10373 9014 yes yes none reject reachable 1status = Not Synchronized...Step 3
sensor# show statistics host...NTP Statisticsremote refid st t when poll reach delay offset jitter*11.22.33.44 CHU_AUDIO(1) 8 u 22 64 377 0.518 37.975 33.465LOCAL(0) 73.78.73.84 5 l 22 64 377 0.000 0.000 0.001ind assID status conf reach auth condition last_event cnt1 10372 f624 yes yes ok sys.peer reachable 22 10373 9024 yes yes none reject reachable 2status = SynchronizedStep 4
Not Synchronized, check with the NTP server administrator to make sure the NTP server is configured correctly.
TCP Reset Not Occurring for a Signature
If you do not have the event action set to reset, the TCP reset does not occur for a specific signature.
To troubleshoot a reset not occurring for a specific signature, follow these steps:
Step 1
Step 2
sensor# configure terminalsensor(config)# service signature-definition sig0sensor(config-sig)# signatures 1000 0sensor(config-sig-sig)# engine atomic-ipsensor(config-sig-sig-ato)# event-action reset-tcp-connection|produc-alertsensor(config-sig-sig-ato)# show settingsatomic-ip-----------------------------------------------event-action: produce-alert|reset-tcp-connection default: produce-alertfragment-status: any <defaulted>specify-l4-protocol-----------------------------------------------no---------------------------------------------------------------------------------------------------------------------------------------------specify-ip-payload-length-----------------------------------------------no---------------------------------------------------------------------------------------------------------------------------------------------specify-ip-header-length-----------------------------------------------no---------------------------------------------------------------------------------------------------------------------------------------------specify-ip-tos-------------------------------------------------MORE--Step 3
sensor(config-sig-sig-ato)# exitsensor(config-sig-sig)# exitsensor(config-sig)# exitApply Changes:?[yes]:Step 4
Step 5
sensor# show events alertevAlert: eventId=1047575239898467370 severity=mediumoriginator:hostId: sj_4250_40appName: sensorAppappInstanceId: 1004signature: sigId=20000 sigName=STRING.TCP subSigId=0 version=Unknownaddr: locality=OUT 172.16.171.19port: 32771victim:addr: locality=OUT 172.16.171.13 port: 23actions:tcpResetSent: trueStep 6
Step 7
root# ./tcpdump -i eth0 src host 172.16.171.19tcpdump: WARNING: eth0: no IPv4 address assignedtcpdump: listening on eth013:58:03.823929 172.16.171.19.32770 > 172.16.171.13.telnet: R 79:79(0) ack 62 win 013:58:03.823930 172.16.171.19.32770 > 172.16.171.13.telnet: R 80:80(0) ack 62 win 013:58:03.823930 172.16.171.19.32770 > 172.16.171.13.telnet: R 80:80(0) ack 62 win 013:58:03.823930 172.16.171.19.32770 > 172.16.171.13.telnet: R 80:80(0) ack 62 win 0
Software Upgrades
This section helps in troubleshooting software upgrades. It contains the following topics:
•
•
•
•
IDS-4235 and IDS-4250 Hang During A Software Upgrade
If the BIOS of IDS-4235 and IDS-4250 is at A03, you must upgrade it to A04 before applying the most recent IPS software, otherwise, the appliances hang during the software upgrade process. For the procedure for upgrading the BIOS, refer to Upgrading the BIOS. For the procedure for applying the latest IPS software, see Obtaining Cisco IPS Software.
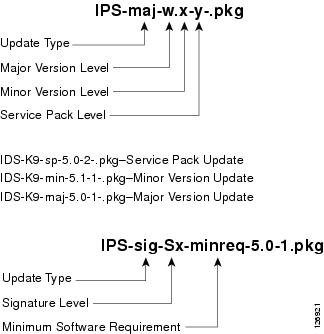
Which Updates to Apply and Their Prerequisites
You must have the correct service pack and minor and major version of the software. If you are having trouble with applying new software, make sure that you are applying the proper updates with the proper prerequisites:
•
•
•
•
Figure B-1 demonstrates how to interpret the IPS software filenames.
Figure B-1 IPS Software Filenames
Issues With Automatic Update
The following list provides suggestions for troubleshooting automatic update:
•
–
–
–
•
The directory must be specified correctly. This has caused issues with Windows FTP servers. Sometimes an extra "/" or even two "/" are needed in front of the directory name.
To verify this, use the same FTP commands you see in the tcpDump output through your own FTP connection.
•
If you modify the FTP prompts to give security warnings, for example, this causes a problem, because the sensor is expecting a hard-coded list of responses.
Note
•
•
Try the manual upgrade command before attempting the automatic update. If it works with the upgrade command and does not work with the automatic update, try the following:
•
Version 4.0(1) has a known problem with automatic update. Upgrade manually to 4.1(1) before trying to configure and use automatic update.
•
•
Some Windows FTP servers allow access to the file with the incorrect capitalization but the sensor ultimately rejects the file because the name has changed.
If necessary, run tcpDump on automatic update. You can compare the successful manual update with the unsuccessful automatic update and troubleshoot from there.
Updating a Sensor with the Update Stored on the Sensor
You can store the update package in the /var directory on the sensor and update the sensor from there if you need to.
To update the sensor with an update stored on the sensor, follow these steps:
Step 1
Step 2
Step 3
Step 4
chmod 644 ips_package_file_nameStep 5
Step 6
Step 7
sensor# configure terminalsensor(config)# service sshsensor(config-ssh)# rsa1-keys sensor_ip_addressStep 8
sensor(config)# upgrade scp://service@sensor_ip_address/upgrade/ips_package_file_nameEnter password: *****Re-enter password: *****
UNIX-Style Directory Listings
To configure Auto update using an FTP server, the FTP server must provide directory listing responses in UNIX style. MS-DOS style directory listing is not supported by the sensor Auto update feature.
Note
To change Microsoft IIS to use UNIX-style directory listings, follow these steps:
Step 1
Step 2
Step 3
Troubleshooting IDM
This section contains troubleshooting procedures for IDM.
Note
This section contains the following topics:
•
•
•
•
•
Increasing the Memory Size of the Java Plug-In
To correctly run IDM, your browser must have Java Plug-in 1.4.2 or 1.5 installed. By default the Java Plug-in allocates 64 MB of memory to IDM. IDM can run out of memory while in use, which can cause IDM to freeze or display blank screens. Running out of memory can also occur when you click Refresh. An
OutofMemoryErrormessage appears in the Java console whenever this occurs.You must change the memory settings of Java Plug-in before using IDM. The mandatory minimum memory size is 256 MB.
This section contains the following topics:
•
Java Plug-In on Windows
To change the settings of Java Plug-in on Windows for Java Plug-in 1.4.2 and 1.5, follow these steps:
Step 1
Step 2
Step 3
a.
b.
c.
d.
Step 4
a.
b.
c.
d.
e.
Java Plug-In on Linux and Solaris
To change the settings of Java Plug-in 1.4.2 or 1.5 on Linux and Solaris, follow these steps:
Step 1
Step 2
Note
Note
Step 3
a.
b.
c.
Step 4
a.
b.
c.
d.
Cannot Launch IDM - Loading Java Applet Failed
Symptom The browser displays
Loading Cisco IDM. Please wait ...At the bottom left corner of the window,Loading Java Applet Failedis displayed.Possible Cause This condition can occur if multiple Java Plug-ins (1.4.x and/or 1.3.x) are installed on the machine on which you are launching the IDM.
Recommended Action Clear the Java cache and remove temp files and clear history in the browser you are using. The result is that neither of these plug-ins will be used by default and each applet should use the correct plug-in.
To clear the cache, follow these steps:
Step 1
Step 2
a.
b.
c.
d.
e.
Step 3
a.
b.
c.
d.
e.
f.
g.
Step 4
Cannot Launch IDM -Analysis Engine Busy
Error Message    Error connecting to sensor. Failed to load
sensor-errNotAvailable-Analysis Engine is busy. Exiting IDM.
Possible Cause This condition can occur if the Analysis Engine in the sensor is busy getting ready to perform a task and so does not respond to IDM.
Recommended Action Wait for a while and try again to connect.
IDM, Remote Manager, or Sensing Interfaces Cannot Access the Sensor
If IDM, a remote manager, or sensing interfaces cannot access the sensor, but you can access the sensor's CLI using SSH or Telnet (if enabled), follow these steps:
Note
Step 1
sensor# setup--- System Configuration Dialog ---At any point you may enter a question mark '?' for help.User ctrl-c to abort configuration dialog at any prompt.Default settings are in square brackets '[]'.Current Configuration:service hostnetwork-settingshost-ip 10.89.130.108/23,10.89.130.1host-name sensortelnet-option enabledaccess-list 0.0.0.0/0ftp-timeout 300no login-banner-textexittime-zone-settingsoffset 0standard-time-zone-name UTCexitsummertime-option disabledntp-option disabledexitservice web-serverport 443exitFor more information, refer to Changing Web Server Settings.
Step 2
All remote management communication is performed by the sensor's web server.
For more information, refer to Changing Web Server Settings.
Signatures Not Producing Alerts
If you are not seeing any alerts when signatures are firing, make sure that you have configured Produce Alert as an event action.
Caution
For example, if you choose Produce Alert, but later add another event action and do not add Produce Alert to the new configuration, alerts will not be sent to the Event Store.
To make sure you are getting alerts, use statistics for the virtual sensor and event store.
Troubleshooting IDSM-2
IDSM-2 has the same software architecture as the 4200 series sensors. You can use the same troubleshooting tools as outlined in Troubleshooting the 4200 Series Appliance.
This section pertains specifically to troubleshooting IDSM-2. It contains the following topics:
•
•
•
•
•
Diagnosing IDSM-2 Problems
Use the following list to diagnose IDSM-2 problems:
•
During physical handling of the module, the connector can come loose from the base card, and cause the daughter card and the base card to lose contact with each other. A loose ribbon cable connector causes an on-line diagnostic error on ports 7 and 8. The module cannot operate when this condition exists.
See Partner Field Notice 52816 for more information.
•
See the Partner Field 52563 for the procedure for checking IDSM-2 for faulty memory.
•
When the hard-disk drive has been in constant use for extended periods of time (for more than 2 weeks), multiple symptoms, such as the following, can occur:
–
–
–
The switch reports that the module is ok, but if you log in to the Service account and try to execute commands, you see that the problem exists. The 4.1(4) service pack alleviates this problem, but if you reimage IDSM-2 with the 4.1(4) application partition image, you must apply the 4.1(4b) patch. See CSCef12198 for more information.
•
•
This defect is related to using SWAP. IDSM-2 responds to pings. Apply the 4.1(4) service pack to resolve this issue. See CSCed54146 for more information.
•
•
For more information, refer to "Supported IDSM-2 Configurations.
If you have confirmed that IDSM-2 does not suffer from any of the problems listed above and yet it appears unresponsive, for example, you cannot log in through SSH or Telnet, nor can you session to the switch, determine if IDSM-2 responds to pings and if you can log in through the service account. If you can log in, obtain a cidDump and any core files and contact TAC.
Switch Commands for Troubleshooting
The following switch commands help you troubleshoot IDSM-2:
•
•
•
•
•
•
•
•
•
•
Status LED Off
If the status indicator is off on IDSM-2, you need to turn power on to IDSM-2.
To determine status of IDSM-2, follow these steps:
Step 1
Step 2
For Catalyst Software:
cat6k> enableEnter password:cat6k> (enable) show moduleMod Slot Ports Module-Type Model Sub Status--- ---- ----- ------------------------- ------------------- --- --------1 1 2 1000BaseX Supervisor WS-X6K-SUP1A-2GE yes ok15 1 1 Multilayer Switch Feature WS-F6K-MSFC no ok2 2 48 10/100BaseTX Ethernet WS-X6248-RJ-45 no ok3 3 48 10/100/1000BaseT Ethernet WS-X6548-GE-TX no ok4 4 16 1000BaseX Ethernet WS-X6516A-GBIC no ok6 6 8 Intrusion Detection Mod WS-SVC-IDSM2 yes okMod Module-Name Serial-Num--- -------------------- -----------1 SAD041308AN15 SAD04120BRB2 SAD034754003 SAD073906RC4 SAL0751QYN06 SAD062004LVMod MAC-Address(es) Hw Fw Sw--- -------------------------------------- ------ ---------- ----------------1 00-d0-c0-cc-0e-d2 to 00-d0-c0-cc-0e-d3 3.1 5.3.1 8.4(1)00-d0-c0-cc-0e-d0 to 00-d0-c0-cc-0e-d100-30-71-34-10-00 to 00-30-71-34-13-ff15 00-30-7b-91-77-b0 to 00-30-7b-91-77-ef 1.4 12.1(23)E2 12.1(23)E22 00-30-96-2b-c7-2c to 00-30-96-2b-c7-5b 1.1 4.2(0.24)V 8.4(1)3 00-0d-29-f6-01-98 to 00-0d-29-f6-01-c7 5.0 7.2(1) 8.4(1)4 00-0e-83-af-15-48 to 00-0e-83-af-15-57 1.0 7.2(1) 8.4(1)6 00-e0-b0-ff-3b-80 to 00-e0-b0-ff-3b-87 0.102 7.2(0.67) 5.0(0.30)Mod Sub-Type Sub-Model Sub-Serial Sub-Hw Sub-Sw--- ----------------------- ------------------- ----------- ------ ------1 L3 Switching Engine WS-F6K-PFC SAD041303G6 1.16 IDS 2 accelerator board WS-SVC-IDSUPG . 2.0cat6k> (enable)For Cisco IOS software:
cat6k#show moduleMod Ports Card Type Model Serial No.--- ----- -------------------------------------- ------------------ -----------1 48 48 port 10/100 mb RJ-45 ethernet WS-X6248-RJ-45 SAD0401012S2 48 48 port 10/100 mb RJ45 WS-X6348-RJ-45 SAL04483QBL3 48 SFM-capable 48 port 10/100/1000mb RJ45 WS-X6548-GE-TX SAD073906GH5 8 Intrusion Detection System WS-SVC-IDSM-2 SAD0751059U6 16 SFM-capable 16 port 1000mb GBIC WS-X6516A-GBIC SAL0740MMYJ7 2 Supervisor Engine 720 (Active) WS-SUP720-3BXL SAD08320L2T9 1 1 port 10-Gigabit Ethernet Module WS-X6502-10GE SAD071903BT11 8 Intrusion Detection System WS-SVC-IDSM2 SAD0538060813 8 Intrusion Detection System WS-SVC-IDSM-2 SAD072405D8Mod MAC addresses Hw Fw Sw Status--- ---------------------------------- ------ ------------ ------------ -------1 00d0.d328.e2ac to 00d0.d328.e2db 1.1 4.2(0.24)VAI 8.5(0.46)ROC Ok2 0003.6c14.e1d0 to 0003.6c14.e1ff 1.4 5.4(2) 8.5(0.46)ROC Ok3 000d.29f6.7a80 to 000d.29f6.7aaf 5.0 7.2(1) 8.5(0.46)ROC Ok5 0003.fead.651a to 0003.fead.6521 4.0 7.2(1) 5.0(1.1) Ok6 000d.ed23.1658 to 000d.ed23.1667 1.0 7.2(1) 8.5(0.46)ROC Ok7 0011.21a1.1398 to 0011.21a1.139b 4.0 8.1(3) 12.2(PIKESPE Ok9 000d.29c1.41bc to 000d.29c1.41bc 1.3 Unknown Unknown PwrDown11 00e0.b0ff.3340 to 00e0.b0ff.3347 0.102 7.2(0.67) 5.0(1.1) Ok13 0003.feab.c850 to 0003.feab.c857 4.0 7.2(1) 5.0(1) OkMod Sub-Module Model Serial Hw Status--- --------------------------- ------------------ ------------ ------- -------5 IDS 2 accelerator board WS-SVC-IDSUPG 07E91E508A 2.0 Ok7 Policy Feature Card 3 WS-F6K-PFC3BXL SAD083305A1 1.3 Ok7 MSFC3 Daughterboard WS-SUP720 SAD083206JX 2.1 Ok11 IDS 2 accelerator board WS-SVC-IDSUPG . 2.0 Ok13 IDS 2 accelerator board WS-SVC-IDSUPG 0347331976 2.0 OkMod Online Diag Status--- -------------------1 Pass2 Pass3 Pass5 Pass6 Pass7 Pass9 Unknown11 Pass13 Passcat6k#
Note
otherwhen IDSM-2 is first installed. After IDSM-2 completes the diagnostics routines and comes online, the status readsok. Allow up to 5 minutes for IDSM-2 to come online.Step 3
ok, turn the module on:router# set module power up module_number
Status LED On But IDSM-2 Does Not Come Online
If the status indicator is on, but IDSM-2 does not come online, try the following troubleshooting tips:
•
•
•
To enable IDSM-2, follow these steps:
Step 1
Step 2
router# show moduleStep 3
ok, enable IDSM-2:router# set module enable module_numberStep 4
router# reset module_numberWait for about 5 minutes for IDSM-2 to come online.
Step 5
router# show test module_numberStep 6
portstatus readsfail, make sure IDSM-2 is firmly connected in the switch.Step 7
hddstatus readsfail, you must reimage the application partition.For the procedure, refer to Upgrading, Downgrading, and Installing System Images.
Cannot Communicate With IDSM-2 Command and Control Port
If you cannot communicate with the IDSM-2 command and control port, the command and control port may not be in the correct VLAN.
To communicate with the command and control port of IDSM-2, follow these steps:
Step 1
Step 2
Step 3
router# show configurationStep 4
For Catalyst software:
cat6k> (enable) show port 6/8* = Configured MAC Address# = 802.1X Authenticated Port Name.Port Name Status Vlan Duplex Speed Type----- -------------------- ---------- ---------- ------ ----------- ------------6/8 connected trunk full 1000 IDSPort Status ErrDisable Reason Port ErrDisableTimeout Action on Timeout---- ---------- ------------------- ---------------------- -----------------6/8 connected - Enable No ChangePort Align-Err FCS-Err Xmit-Err Rcv-Err UnderSize----- ---------- ---------- ---------- ---------- ---------6/8 0 0 0 0 0Port Single-Col Multi-Coll Late-Coll Excess-Col Carri-Sen Runts Giants----- ---------- ---------- ---------- ---------- --------- --------- ---------6/8 0 0 0 0 0 0 -Port Last-Time-Cleared----- --------------------------6/8 Wed Mar 2 2005, 15:29:49Idle Detection----------------cat6k> (enable)For Cisco IOS software:
cat6k#show intrusion-detection module 5 management-port stateIntrusion-detection module 5 management-port:Switchport: EnabledAdministrative Mode: dynamic desirableOperational Mode: static accessAdministrative Trunking Encapsulation: negotiateOperational Trunking Encapsulation: nativeNegotiation of Trunking: OnAccess Mode VLAN: 1 (default)Trunking Native Mode VLAN: 1 (default)Trunking VLANs Enabled: ALLPruning VLANs Enabled: 2-1001Vlans allowed on trunk:1Vlans allowed and active in management domain: 1Vlans in spanning tree forwarding state and not pruned:1Access Vlan = 1cat6k#Step 5
For the procedure, refer to Configuring the Catalyst 6500 Series Switch for Command and Control Access to IDSM-2.
Using the TCP Reset Interface
IDSM-2 has a TCP reset interface—port 1. IDSM-2 has a specific TCP reset interface because it cannot send TCP resets on its sensing ports.
If you have TCP reset problems with IDSM-2, try the following:
•
•
Connecting a Serial Cable to IDSM-2
You can connect a serial cable directly to the serial console port on IDSM-2. This lets you bypass the switch and module network interfaces.
To connect a serial cable to IDSM-2, follow these steps:
Step 1
You can find them approximately in the center of the mother board. If you are facing the module faceplate, the RJ-45 port on the right is the serial console port.
Step 2
Step 3
You can now log directly in to IDSM-2.
Note
Troubleshooting AIP-SSM
AIP-SSM has the same software architecture as the 4200 series sensors. You can use the same troubleshooting tools as outlined in Troubleshooting the 4200 Series Appliance.
The following section contains commands that are specific to troubleshooting AIP-SSM.
To see the general health of AIP-SSM, use the show module 1 details command:
asa# show module 1 detailsGetting details from the Service Module, please wait...ASA 5500 Series Security Services Module-20Model: ASA-SSM-20Hardware version: 0.2Serial Number: P2B000005D0Firmware version: 1.0(10)0Software version: 5.1(0.1)S153.0Status: UpMgmt IP addr: 10.89.149.219Mgmt web ports: 443Mgmt TLS enabled: trueasa#The output shows that AIP-SSM is up. If the status reads
Down, you can reset AIP-SSM using the hw-module module 1 reset command:asa# hw-module module 1 resetThe module in slot 1 should be shut down beforeresetting it or loss of configuration may occur.Reset module in slot 1? [confirm]Reset issued for module in slot 1asa(config)# show moduleMod Card Type Model Serial No.--- -------------------------------------------- ------------------ -----------0 ASA 5520 Adaptive Security Appliance ASA5520 P2A000000141 ASA 5500 Series Security Services Module-10 ASA-SSM-10 P2A0000067UMod MAC Address Range Hw Version Fw Version Sw Version--- --------------------------------- ------------ ------------ ---------------0 000b.fcf8.7bdc to 000b.fcf8.7be0 0.2 1.0(10)0 7.0(1)1 000b.fcf8.0176 to 000b.fcf8.0176 0.2 1.0(10)0 5.1(0.1)S153.0Mod Status--- ------------------0 Up Sys1 Shutting Down****************************************************asa(config)# show moduleMod Card Type Model Serial No.--- -------------------------------------------- ------------------ -----------0 ASA 5520 Adaptive Security Appliance ASA5520 P2A000000141 ASA 5500 Series Security Services Module-10 ASA-SSM-10 P2A0000067UMod MAC Address Range Hw Version Fw Version Sw Version--- --------------------------------- ------------ ------------ ---------------0 000b.fcf8.7bdc to 000b.fcf8.7be0 0.2 1.0(10)0 7.0(1)1 000b.fcf8.0176 to 000b.fcf8.0176 0.2 1.0(10)0 5.1(0.1)S153.0Mod Status--- ------------------0 Up Sys1 Upasa(config)#If you have problems with recovering AIP-SSM, use the debug module-boot command to see the output as AIP-SSM boots. Make sure you have the correct IP address for the TFTP server and you have the correct file on the TFTP server. Then use the hw-module module 1 recover command again to recover AIP-SSM:
asa(config)# hw-module module 1 recover configureImage URL [tftp://0.0.0.0/]: tftp://10.89.146.1/IPS-SSM-K9-sys-1.1-a-5.1-0.1.i$Port IP Address [0.0.0.0]: 10.89.150.227VLAN ID [0]:Gateway IP Address [0.0.0.0]: 10.89.149.254asa(config)# debug module-bootdebug module-boot enabled at level 1asa(config)# hw-module module 1 recover bootThe module in slot 1 will be recovered. This may erase all configuration and all data on that device and attempt to download a new image for it.Recover module in slot 1? [confirm]Recover issued for module in slot 1asa(config)# Slot-1 140> Cisco Systems ROMMON Version (1.0(10)0) #0: Fri Mar 25 23:02:10 PST 2005Slot-1 141> Platform ASA-SSM-10Slot-1 142> GigabitEthernet0/0Slot-1 143> Link is UPSlot-1 144> MAC Address: 000b.fcf8.0176Slot-1 145> ROMMON Variable Settings:Slot-1 146> ADDRESS=10.89.150.227Slot-1 147> SERVER=10.89.146.1Slot-1 148> GATEWAY=10.89.149.254Slot-1 149> PORT=GigabitEthernet0/0Slot-1 150> VLAN=untaggedSlot-1 151> IMAGE=IPS-SSM-K9-sys-1.1-a-5.1-0.1.imgSlot-1 152> CONFIG=Slot-1 153> LINKTIMEOUT=20Slot-1 154> PKTTIMEOUT=4Slot-1 155> RETRY=20Slot-1 156> tftp IPS-SSM-K9-sys-1.1-a-5.1-0.1.img@10.89.146.1 via 10.89.149.254Slot-1 157> TFTP failure: Packet verify failed after 20 retriesSlot-1 158> Rebooting due to Autoboot error ...Slot-1 159> Rebooting....Slot-1 160> Cisco Systems ROMMON Version (1.0(10)0) #0: Fri Mar 25 23:02:10 PST 2005Slot-1 161> Platform ASA-SSM-10Slot-1 162> GigabitEthernet0/0Slot-1 163> Link is UPSlot-1 164> MAC Address: 000b.fcf8.0176Slot-1 165> ROMMON Variable Settings:Slot-1 166> ADDRESS=10.89.150.227Slot-1 167> SERVER=10.89.146.1Slot-1 168> GATEWAY=10.89.149.254Slot-1 169> PORT=GigabitEthernet0/0Slot-1 170> VLAN=untaggedSlot-1 171> IMAGE=IPS-SSM-K9-sys-1.1-a-5.1-0.1.imgSlot-1 172> CONFIG=Slot-1 173> LINKTIMEOUT=20Slot-1 174> PKTTIMEOUT=4Slot-1 175> RETRY=20Slot-1 176> tftp IPS-SSM-K9-sys-1.1-a-5.1-0.1.img@10.89.146.1 via 10.89.149.254Gathering Information
You can use the following CLI commands and scripts to gather information and diagnose the state of the sensor when problems occur. You can use the show tech-support command to gather all the sensor's information, or you can use the other individual commands listed in this section for specific information.
This section contains the following topics:
•
Tech Support Information
The show tech-support command is useful for capturing all the sensor's status and configuration information.
This section contains the following topics:
•
Overview
The show tech-support command captures all status and configuration information on the sensor and includes the current configuration, version information, and cidDump information. The output can be large, over 1 MB. You can transfer the output to a remote system. For the procedure for copying the output to a remote system, see Displaying Tech Support Information.
Note
Note
Displaying Tech Support Information
Use the show tech-support [page] [password] [destination-url destination-url] command to display system information on the screen or have it sent to a specific URL. You can use the information as a troubleshooting tool with TAC.
The following parameters are optional:
•
Press Enter to display the next line of output or use the spacebar to display the next page of information.
•
•
•
To display tech support information, follow these steps:
Step 1
Step 2
sensor# show tech-support pageThe system information appears on the screen, one page at a time. Press the spacebar to view the next page or press Ctrl-C to return to the prompt.
Step 3
a.
sensor# show tech-support destination-url destination-urlYou can specify the following destination types:
•
ftp:[[//username@location]/relativeDirectory]/filenameorftp:[[//username@location]//absoluteDirectory]/filename.•
scp:[[//username@]location]/relativeDirectory]/filenameorscp:[[//username@]location]//absoluteDirectory]/filename.For example, to send the tech support output to the file
/absolute/reports/sensor1Report.html:sensor# show tech support dest ftp://csidsuser@10.2.1.2//absolute/reports/sensor1Report.htmlThe
password:prompt appears.b.
The
Generating report:message is displayed.
Tech Support Command Output
The following is an example of the show tech-support command output:
Note
sensor# show tech-support pageSystem Status ReportThis Report was generated on Fri Feb 21 03:33:52 2003.Output from show interfacesInterface StatisticsTotal Packets Received = 0Total Bytes Received = 0Missed Packet Percentage = 0Current Bypass Mode = Auto_offMAC statistics from interface GigabitEthernet0/1Media Type = backplaneMissed Packet Percentage = 0Inline Mode = UnpairedPair Status = N/ALink Status = UpLink Speed = Auto_1000Link Duplex = Auto_FullTotal Packets Received = 0Total Bytes Received = 0Total Multicast Packets Received = 0Total Broadcast Packets Received = 0Total Jumbo Packets Received = 0Total Undersize Packets Received = 0Total Receive Errors = 0Total Receive FIFO Overruns = 0Total Packets Transmitted = 0Total Bytes Transmitted = 0Total Multicast Packets Transmitted = 0Total Broadcast Packets Transmitted = 0Total Jumbo Packets Transmitted = 0Total Undersize Packets Transmitted = 0Total Transmit Errors = 0Total Transmit FIFO Overruns = 0MAC statistics from interface GigabitEthernet0/0Media Type = TXLink Status = UpLink Speed = Auto_100Link Duplex = Auto_FullTotal Packets Received = 2208534Total Bytes Received = 157390286Total Multicast Packets Received = 20Total Receive Errors = 0Total Receive FIFO Overruns = 0Total Packets Transmitted = 239437Total Bytes Transmitted = 107163351Total Transmit Errors = 0Total Transmit FIFO Overruns = 0Output from show statistics networkAccessCurrent ConfigurationLogAllBlockEventsAndSensors = trueEnableNvramWrite = falseEnableAclLogging = falseAllowSensorBlock = trueBlockMaxEntries = 250MaxDeviceInterfaces = 250StateBlockEnable = trueOutput from cidDumpcidDiagCID Diagnostics Report Fri Feb 21 03:33:54 UTC 20035.0(1)<defaultVersions><defaultVersion aspect="S"><version>149.0</version><date>2005-03-04</date></defaultVersion></defaultVersions>1.1 - 5.0(1)S149Linux version 2.4.26-IDS-smp-bigphys (csailer@mcq) (gcc version 2.96 20000731 (Red Hat Linux 7.3 2.96-112)) #2 SMP Fri Mar 4 04:11:31 CST 200503:33:54 up 21 days, 23:15, 3 users, load average: 0.96, 0.86, 0.78--MORE--Version Information
The show version command is useful for establishing the general health of the sensor. This section describes the show version command, and it contains the following topics:
•
Overview
The show version command shows the general health of the sensor and can indicate where a failure is occurring. It gives the following information:
•
•
•
•
Note
Displaying Version Information
Use the show version command to display version information for all installed operating system packages, signature packages, and IPS processes running on the system. To view the configuration for the entire system, use the more current-config command.
To display the version and configuration, follow these steps:
Step 1
Step 2
sensor# show versionThe following examples show sample version output for the appliance and the NM-CIDS.
Sample version output for the appliance:
sensor# show versionApplication Partition:Cisco Intrusion Prevention System, Version 5.0(0.29)S135.0OS Version 2.4.26-IDS-smp-bigphysPlatform: IPS-4255-K9Serial Number: JAB0815R017No license presentSensor up-time is 5 days.Using 722145280 out of 3974291456 bytes of available memory (18% usage)system is using 17.3M out of 29.0M bytes of available disk space (59% usage)application-data is using 36.3M out of 166.8M bytes of available disk space (23% usage)boot is using 39.4M out of 68.6M bytes of available disk space (61% usage)MainApp 2005_Feb_18_03.00 (Release) 2005-02-18T03:13:47-0600 RunningAnalysisEngine 2005_Feb_18_03.00 (Release) 2005-02-18T03:13:47-0600 RunningCLI 2005_Feb_18_03.00 (Release) 2005-02-18T03:13:47-0600Upgrade History:IDS-K9-maj-5.0-0.29-S91-0.29-.pkg 03:00:00 UTC Mon Feb 16 2004Recovery Partition Version 1.1 - 5.0(0.29)S91(0.29)sensor#Sample version output for NM-CIDS:
nm-cids# show versionApplication Partition:Cisco Intrusion Prevention System, Version 5.0(0.27)S129.0OS Version 2.4.26-IDS-smp-bigphysPlatform: NM-CIDSSerial Number: JAD06490681No license presentSensor up-time is 1 day.Using 485675008 out of 509448192 bytes of available memory (95% usage)system is using 17.3M out of 29.0M bytes of available disk space (59% usage)application-data is using 31.1M out of 166.8M bytes of available disk space (20% usage)boot is using 39.5M out of 68.6M bytes of available disk space (61% usage)application-log is using 529.6M out of 2.8G bytes of available disk space (20% usage)MainApp 2005_Feb_09_03.00 (Release) 2005-02-09T03:22:27-0600 RunningAnalysisEngine 2005_Feb_09_03.00 (Release) 2005-02-09T03:22:27-0600 RunningCLI 2005_Feb_09_03.00 (Release) 2005-02-09T03:22:27-0600Upgrade History:IDS-K9-maj-5.0-0.27-S91-0.27-.pkg 03:00:00 UTC Thu Feb 05 2004Recovery Partition Version 1.1 - 5.0(0.27)S91(0.27)nm-cids#
Note
—-MORE-—prompt is displayed, press the spacebar to see more information or Ctrl-C to cancel the output and get back to the CLI prompt.Step 3
Note
sensor# more current-config! ------------------------------! Version 5.0(0.26)! Current configuration last modified Wed Feb 16 03:20:54 2005! ------------------------------display-serial! ------------------------------service analysis-engineexit! ------------------------------service authenticationexit! ------------------------------service event-action-rules rules0exit! ------------------------------service hostnetwork-settingshost-ip 10.89.147.31/25,10.89.147.126host-name sensoraccess-list 0.0.0.0/0login-banner-text This message will be displayed on banner login.exittime-zone-settings--MORE--
Statistics Information
The show statistics command is useful for examining the state of the sensor's services. This section describes the show statistics command, and it contains the following topics:
Overview
The show statistics command provides a snapshot of the state of the sensor's services. The following services provide statistics:
•
•
•
•
•
•
•
•
•
•
•
•
•
•
Note
Displaying Statistics
Use the show statistics virtual-sensor [clear] command to display the statistics for the virtual sensor. Use the show statistics [analysis-engine | authentication | denied-attackers | event-server | event-store | host | logger | network-access | notification | sdee-server | transaction-server | transaction-source | web-server] [clear] command to generate statistics for each sensor application.
Note
To display statistics for the sensor, follow these steps:
Step 1
Step 2
sensor# show statistics virtual-sensorVirtual Sensor StatisticsStatistics for Virtual Sensor vs0Name of current Signature-Definition instance = sig0Name of current Event-Action-Rules instance = rules0List of interfaces monitored by this virtual sensor = fe0_1General Statistics for this Virtual SensorNumber of seconds since a reset of the statistics = 1675Measure of the level of resource utilization = 0Total packets processed since reset = 241Total IP packets processed since reset = 12Total packets that were not IP processed since reset = 229Total TCP packets processed since reset = 0Total UDP packets processed since reset = 0Total ICMP packets processed since reset = 12Total packets that were not TCP, UDP, or ICMP processed since reset = 0Total ARP packets processed since reset = 0Total ISL encapsulated packets processed since reset = 0Total 802.1q encapsulated packets processed since reset = 0Total packets with bad IP checksums processed since reset = 0Total packets with bad layer 4 checksums processed since reset = 0Total number of bytes processed since reset = 22513The rate of packets per second since reset = 0The rate of bytes per second since reset = 13The average bytes per packet since reset = 93Denied Address InformationNumber of Active Denied Attackers = 0Number of Denied Attackers Inserted = 0Number of Denied Attackers Total Hits = 0Number of times max-denied-attackers limited creation of new entry = 0Number of exec Clear commands during uptime = 0Denied Attackers and hit count for each.The Signature Database Statistics.The Number of each type of node active in the system (can not be reset)Total nodes active = 0TCP nodes keyed on both IP addresses and both ports = 0UDP nodes keyed on both IP addresses and both ports = 0IP nodes keyed on both IP addresses = 0The number of each type of node inserted since resetTotal nodes inserted = 28TCP nodes keyed on both IP addresses and both ports = 0UDP nodes keyed on both IP addresses and both ports = 0IP nodes keyed on both IP addresses = 6The rate of nodes per second for each time since resetNodes per second = 0TCP nodes keyed on both IP addresses and both ports per second = 0UDP nodes keyed on both IP addresses and both ports per second = 0IP nodes keyed on both IP addresses per second = 0The number of root nodes forced to expire because of memory constraintsTCP nodes keyed on both IP addresses and both ports = 0Fragment Reassembly Unit Statistics for this Virtual SensorNumber of fragments currently in FRU = 0Number of datagrams currently in FRU = 0Number of fragments received since reset = 0Number of fragments forwarded since reset = 0Number of fragments dropped since last reset = 0Number of fragments modified since last reset = 0Number of complete datagrams reassembled since last reset = 0Fragments hitting too many fragments condition since last reset = 0Number of overlapping fragments since last reset = 0Number of Datagrams too big since last reset = 0Number of overwriting fragments since last reset = 0Number of Initial fragment missing since last reset = 0Fragments hitting the max partial dgrams limit since last reset = 0Fragments too small since last reset = 0Too many fragments per dgram limit since last reset = 0Number of datagram reassembly timeout since last reset = 0Too many fragments claiming to be the last since last reset = 0Fragments with bad fragment flags since last reset = 0TCP Normalizer stage statisticsPackets Input = 0Packets Modified = 0Dropped packets from queue = 0Dropped packets due to deny-connection = 0Current Streams = 0Current Streams Closed = 0Current Streams Closing = 0Current Streams Embryonic = 0Current Streams Established = 0Current Streams Denied = 0Statistics for the TCP Stream Reassembly UnitCurrent Statistics for the TCP Stream Reassembly UnitTCP streams currently in the embryonic state = 0TCP streams currently in the established state = 0TCP streams currently in the closing state = 0TCP streams currently in the system = 0TCP Packets currently queued for reassembly = 0Cumulative Statistics for the TCP Stream Reassembly Unit since resetTCP streams that have been tracked since last reset = 0TCP streams that had a gap in the sequence jumped = 0TCP streams that was abandoned due to a gap in the sequence = 0TCP packets that arrived out of sequence order for their stream = 0TCP packets that arrived out of state order for their stream = 0The rate of TCP connections tracked per second since reset = 0SigEvent Preliminary Stage StatisticsNumber of Alerts received = 491Number of Alerts Consumed by AlertInterval = 0Number of Alerts Consumed by Event Count = 0Number of FireOnce First Alerts = 6Number of FireOnce Intermediate Alerts = 480Number of Summary First Alerts = 0Number of Summary Intermediate Alerts = 0Number of Regular Summary Final Alerts = 0Number of Global Summary Final Alerts = 0Number of Alerts Output for further processing = 491SigEvent Action Override Stage StatisticsNumber of Alerts received to Action Override Processor = 0Number of Alerts where an override was applied = 0Actions Addeddeny-attacker-inline = 0deny-connection-inline = 0deny-packet-inline = 0modify-packet-inline = 0log-attacker-packets = 0log-pair-packets = 0log-victim-packets = 0produce-alert = 0produce-verbose-alert = 0request-block-connection = 0request-block-host = 0request-snmp-trap = 0reset-tcp-connection = 0SigEvent Action Filter Stage StatisticsNumber of Alerts received to Action Filter Processor = 0Number of Alerts where an action was filtered = 0Number of Filter Line matches = 0Actions Filtereddeny-attacker-inline = 0deny-connection-inline = 0deny-packet-inline = 0modify-packet-inline = 0log-attacker-packets = 0log-pair-packets = 0log-victim-packets = 0produce-alert = 0produce-verbose-alert = 0request-block-connection = 0request-block-host = 0request-snmp-trap = 0reset-tcp-connection = 0SigEvent Action Handling Stage Statistics.Number of Alerts received to Action Handling Processor = 491Number of Alerts where produceAlert was forced = 0Number of Alerts where produceAlert was off = 0Actions Performeddeny-attacker-inline = 0deny-connection-inline = 0deny-packet-inline = 0modify-packet-inline = 0log-attacker-packets = 0log-pair-packets = 0log-victim-packets = 0produce-alert = 11produce-verbose-alert = 0request-block-connection = 0request-block-host = 5request-snmp-trap = 0reset-tcp-connection = 0Deny Actions Requested in Promiscuous Modedeny-packet not performed = 0deny-connection not performed = 0deny-attacker not performed = 0modify-packet not performed = 0Number of Alerts where deny-connection was forced for deny-packet action = 0Number of Alerts where deny-packet was forced for non-TCP deny-connection action = 0Per-Signature SigEvent count since resetSig 2004 = 5Sig 2156 = 486sensor#Step 3
sensor# show statistics analysis-engineAnalysis Engine StatisticsNumber of seconds since service started = 1999Measure of the level of current resource utilization = 0Measure of the level of maximum resource utilization = 0The rate of TCP connections tracked per second = 0The rate of packets per second = 0The rate of bytes per second = 13Receiver StatisticsTotal number of packets processed since reset = 290Total number of IP packets processed since reset = 12Transmitter StatisticsTotal number of packets transmitted = 290Total number of packets denied = 0Total number of packets reset = 0Fragment Reassembly Unit StatisticsNumber of fragments currently in FRU = 0Number of datagrams currently in FRU = 0TCP Stream Reassembly Unit StatisticsTCP streams currently in the embryonic state = 0TCP streams currently in the established state = 0TCP streams currently in the closing state = 0TCP streams currently in the system = 0TCP Packets currently queued for reassembly = 0The Signature Database Statistics.Total nodes active = 0TCP nodes keyed on both IP addresses and both ports = 0UDP nodes keyed on both IP addresses and both ports = 0IP nodes keyed on both IP addresses = 0Statistics for Signature EventsNumber of SigEvents since reset = 491Statistics for Actions executed on a SigEventNumber of Alerts written to the IdsEventStore = 11sensor#Step 4
sensor# show statistics authenticationGeneraltotalAuthenticationAttempts = 2failedAuthenticationAttempts = 0sensor#Step 5
sensor# show statistics denied-attackersDenied Attackers and hit count for each.sensor#Step 6
sensor# show statistics event-serverGeneralopenSubscriptions = 0blockedSubscriptions = 0Subscriptionssensor#Step 7
sensor# show statistics event-storeEvent store statisticsGeneral information about the event storeThe current number of open subscriptions = 2The number of events lost by subscriptions and queries = 0The number of queries issued = 0The number of times the event store circular buffer has wrapped = 0Number of events of each type currently storedDebug events = 0Status events = 9904Log transaction events = 0Shun request events = 61Error events, warning = 67Error events, error = 83Error events, fatal = 0Alert events, informational = 60Alert events, low = 1Alert events, medium = 60Alert events, high = 0sensor#Step 8
sensor# show statistics hostGeneral StatisticsLast Change To Host Config (UTC) = 16:11:05 Thu Feb 10 2005Command Control Port Device = FastEthernet0/0Network Statisticsfe0_0 Link encap:Ethernet HWaddr 00:0B:46:53:06:AAinet addr:10.89.149.185 Bcast:10.89.149.255 Mask:255.255.255.128UP BROADCAST RUNNING MULTICAST MTU:1500 Metric:1RX packets:1001522 errors:0 dropped:0 overruns:0 frame:0TX packets:469569 errors:0 dropped:0 overruns:0 carrier:0collisions:0 txqueuelen:1000RX bytes:57547021 (54.8 MiB) TX bytes:63832557 (60.8 MiB)Interrupt:9 Base address:0xf400 Memory:c0000000-c0000038NTP Statisticsstatus = Not applicableMemory UsageusedBytes = 500592640freeBytes = 8855552totalBytes = 509448192Swap UsageUsed Bytes = 77824Free Bytes = 600649728Total Bytes = 600727552CPU StatisticsUsage over last 5 seconds = 0Usage over last minute = 1Usage over last 5 minutes = 1Memory StatisticsMemory usage (bytes) = 500498432Memory free (bytes) = 894976032Auto Update StatisticslastDirectoryReadAttempt = N/AlastDownloadAttempt = N/AlastInstallAttempt = N/AnextAttempt = N/Asensor#Step 9
sensor# show statistics loggerThe number of Log interprocessor FIFO overruns = 0The number of syslog messages received = 11The number of <evError> events written to the event store by severityFatal Severity = 0Error Severity = 64Warning Severity = 35TOTAL = 99The number of log messages written to the message log by severityFatal Severity = 0Error Severity = 64Warning Severity = 24Timing Severity = 311Debug Severity = 31522Unknown Severity = 7TOTAL = 31928sensor#Step 10
sensor# show statistics network-accessCurrent ConfigurationLogAllBlockEventsAndSensors = trueEnableNvramWrite = falseEnableAclLogging = falseAllowSensorBlock = falseBlockMaxEntries = 11MaxDeviceInterfaces = 250NetDeviceType = PIXIP = 10.89.150.171NATAddr = 0.0.0.0Communications = ssh-3desNetDeviceType = PIXIP = 10.89.150.219NATAddr = 0.0.0.0Communications = ssh-desNetDeviceType = PIXIP = 10.89.150.250NATAddr = 0.0.0.0Communications = telnetNetDeviceType = CiscoIP = 10.89.150.158NATAddr = 0.0.0.0Communications = telnetBlockInterfaceInterfaceName = ethernet0/1InterfaceDirection = outInterfacePostBlock = Post_Acl_TestBlockInterfaceInterfaceName = ethernet0/1InterfaceDirection = inInterfacePreBlock = Pre_Acl_TestInterfacePostBlock = Post_Acl_TestNetDeviceType = CAT6000_VACLIP = 10.89.150.138NATAddr = 0.0.0.0Communications = telnetBlockInterfaceInterfaceName = 502InterfacePreBlock = Pre_Acl_TestBlockInterfaceInterfaceName = 507InterfacePostBlock = Post_Acl_TestStateBlockEnable = trueNetDeviceIP = 10.89.150.171AclSupport = Does not use ACLsVersion = 6.3State = ActiveFirewall-type = PIXNetDeviceIP = 10.89.150.219AclSupport = Does not use ACLsVersion = 7.0State = ActiveFirewall-type = ASANetDeviceIP = 10.89.150.250AclSupport = Does not use ACLsVersion = 2.2State = ActiveFirewall-type = FWSMNetDeviceIP = 10.89.150.158AclSupport = uses Named ACLsVersion = 12.2State = ActiveNetDeviceIP = 10.89.150.138AclSupport = Uses VACLsVersion = 8.4State = ActiveBlockedAddrHostIP = 22.33.4.5Vlan =ActualIp =BlockMinutes =HostIP = 21.21.12.12Vlan =ActualIp =BlockMinutes =HostIP = 122.122.33.4Vlan =ActualIp =BlockMinutes = 60MinutesRemaining = 24NetworkIP = 111.22.0.0Mask = 255.255.0.0BlockMinutes =sensor#Step 11
sensor# show statistics notificationGeneralNumber of SNMP set requests = 0Number of SNMP get requests = 0Number of error traps sent = 0Number of alert traps sent = 0sensor#Step 12
sensor# show statistics sdee-serverGeneralOpen Subscriptions = 0Blocked Subscriptions = 0Maximum Available Subscriptions = 5Maximum Events Per Retrieval = 500Subscriptionssensor#Step 13
sensor# show statistics transaction-serverGeneraltotalControlTransactions = 35failedControlTransactions = 0sensor#Step 14
sensor# show statistics transaction-sourceGeneraltotalControlTransactions = 0failedControlTransactions = 0sensor#Step 15
sensor# show statistics web-serverlistener-443number of server session requests handled = 61number of server session requests rejected = 0total HTTP requests handled = 35maximum number of session objects allowed = 40number of idle allocated session objects = 10number of busy allocated session objects = 0crypto library version = 6.0.3sensor#Step 16
sensor# show statistics logger clearThe number of Log interprocessor FIFO overruns = 0The number of syslog messages received = 141The number of <evError> events written to the event store by severityFatal Severity = 0Error Severity = 14Warning Severity = 142TOTAL = 156The number of log messages written to the message log by severityFatal Severity = 0Error Severity = 14Warning Severity = 1Timing Severity = 0Debug Severity = 0Unknown Severity = 28TOTAL = 43The statistics were retrieved and cleared.
Step 17
sensor# show statistics loggerThe number of Log interprocessor FIFO overruns = 0The number of syslog messages received = 0The number of <evError> events written to the event store by severityFatal Severity = 0Error Severity = 0Warning Severity = 0TOTAL = 0The number of log messages written to the message log by severityFatal Severity = 0Error Severity = 0Warning Severity = 0Timing Severity = 0Debug Severity = 0Unknown Severity = 0TOTAL = 0sensor#The statistics all begin from 0.
Interfaces Information
The show interfaces command is useful for gathering information on the sensing and command and control interfaces. This section describes the show interfaces command, and it contains the following topics:
Overview
You can learn the following information from the show interfaces command:
•
•
•
•
The show interfaces command displays statistics for all system interfaces. Or you can use the individual commands to display statistics for the command and control interface (show interfaces command_control_interface_name), the sensing interface (show interfaces interface_name).
Interfaces Command Output
The following example shows the output from the show interfaces command:
sensor# show interfacesInterface StatisticsTotal Packets Received = 0Total Bytes Received = 0Missed Packet Percentage = 0Current Bypass Mode = Auto_offMAC statistics from interface GigabitEthernet0/1Media Type = backplaneMissed Packet Percentage = 0Inline Mode = UnpairedPair Status = N/ALink Status = UpLink Speed = Auto_1000Link Duplex = Auto_FullTotal Packets Received = 0Total Bytes Received = 0Total Multicast Packets Received = 0Total Broadcast Packets Received = 0Total Jumbo Packets Received = 0Total Undersize Packets Received = 0Total Receive Errors = 0Total Receive FIFO Overruns = 0Total Packets Transmitted = 0Total Bytes Transmitted = 0Total Multicast Packets Transmitted = 0Total Broadcast Packets Transmitted = 0Total Jumbo Packets Transmitted = 0Total Undersize Packets Transmitted = 0Total Transmit Errors = 0Total Transmit FIFO Overruns = 0MAC statistics from interface GigabitEthernet0/0Media Type = TXLink Status = UpLink Speed = Auto_100Link Duplex = Auto_FullTotal Packets Received = 2211296Total Bytes Received = 157577635Total Multicast Packets Received = 20Total Receive Errors = 0Total Receive FIFO Overruns = 0Total Packets Transmitted = 239723Total Bytes Transmitted = 107213390Total Transmit Errors = 0Total Transmit FIFO Overruns = 0sensor#Events Information
You can use the show events command to view the alerts generated by SensorApp and errors generated by an application. This section describes the show events command, and it contains these topics:
Sensor Events
There are five types of events:
•
•
•
•
•
Events remain in the Event Store until they are overwritten by newer events.
Overview
The show events command is useful for troubleshooting event capture issues in which you are not seeing events in Event Viewer or Security Monitor. You can use the show events command to determine which events are being generated on the sensor to make sure events are being generated and that the fault lies with the monitoring side.
You can clear all events from Event Store by using the clear events command.
Here are the parameters for the show events command:
sensor# show events<cr>alert Display local system alerts.error Display error events.hh:mm[:ss] Display start time.log Display log events.nac Display NAC shun events.past Display events starting in the past specified time.status Display status events.| Output modifiers.Displaying Events
Use the show events [{[alert [informational] [low] [medium] [high] [include-traits traits] [exclude-traits traits]] | error [warning] [error] [fatal] | log | NAC | status}] [hh:mm:ss [month day [year]] | past hh:mm:ss] command to display events from the Event Store.
Events are displayed beginning at the start time. If you do not specify a start time, events are displayed beginning at the current time. If you do not specify an event type, all events are displayed.
Note
The following options apply:
•
If no level is selected (informational, low, medium, or high), all alert events are displayed.
•
•
•
•
•
•
•
•
•
Note
To display events from the Event Store, follow these steps:
Step 1
Step 2
sensor#@ show eventsevError: eventId=1041472274774840147 severity=warning vendor=Ciscooriginator:hostId: sensor2appName: cidwebserverappInstanceId: 12075time: 2003/01/07 04:41:45 2003/01/07 04:41:45 UTCerrorMessage: name=errWarning received fatal alert: certificate_unknownevError: eventId=1041472274774840148 severity=error vendor=Ciscooriginator:hostId: sensor2appName: cidwebserverappInstanceId: 351time: 2003/01/07 04:41:45 2003/01/07 04:41:45 UTCerrorMessage: name=errTransport WebSession::sessionTask(6) TLS connection exception: handshake incomplete.The feed continues showing all events until you press Ctrl-C.
Step 3
sensor#@ show events NAC 10:00:00 Feb 9 2005evShunRqst: eventId=1106837332219222281 vendor=Ciscooriginator:deviceName: Sensor1appName: NetworkAccessControllerAppappInstance: 654time: 2005/02/09 10:33:31 2004/08/09 13:13:31shunInfo:host: connectionShun=falsesrcAddr: 11.0.0.1destAddr:srcPort:destPort:protocol: numericType=0 othertimeoutMinutes: 40evAlertRef: hostId=esendHost 123456789012345678sensor#Step 4
sensor# show events error warning 10:00:00 Feb 9 2005evError: eventId=1041472274774840197 severity=warning vendor=Ciscooriginator:hostId: sensorappName: cidwebserverappInstanceId: 12160time: 2003/01/07 04:49:25 2003/01/07 04:49:25 UTCerrorMessage: name=errWarning received fatal alert: certificate_unknownStep 5
sensor# show events alert past 00:00:45evIdsAlert: eventId=1109695939102805307 severity=medium vendor=Ciscooriginator:hostId: sensorappName: sensorAppappInstanceId: 367time: 2005/03/02 14:15:59 2005/03/02 14:15:59 UTCsignature: description=Nachi Worm ICMP Echo Request id=2156 version=S54subsigId: 0sigDetails: Nachi ICMPinterfaceGroup:vlan: 0participants:attacker:addr: locality=OUT 10.89.228.202target:addr: locality=OUT 10.89.150.185riskRatingValue: 70interface: fe0_1protocol: icmpevIdsAlert: eventId=1109695939102805308 severity=medium vendor=Ciscooriginator:--MORE--Step 6
sensor# show events past 00:00:30evStatus: eventId=1041526834774829055 vendor=Ciscooriginator:hostId: sensorappName: mainAppappInstanceId: 2215time: 2003/01/08 02:41:00 2003/01/08 02:41:00 UTCcontrolTransaction: command=getVersion successful=truedescription: Control transaction response.requestor:user: cidsapplication:hostId: 64.101.182.101appName: -cidcliappInstanceId: 2316evStatus: eventId=1041526834774829056 vendor=Ciscooriginator:hostId: sensorappName: login(pam_unix)appInstanceId: 2315time: 2003/01/08 02:41:00 2003/01/08 02:41:00 UTCsyslogMessage:description: session opened for user cisco by cisco(uid=0)
Clearing Events
Use the clear events command to clear Event Store.
To clear events from Event Store, follow these steps:
Step 1
Step 2
sensor# clear eventsWarning: Executing this command will remove all events currently stored in the event store.Continue with clear? []:Step 3
cidDump Script
If you do not have access to IDM or the CLI, you can run the underlying script cidDump from the Service account by logging in as root and running /usr/cids/idsRoot/bin/cidDump. The cidDump file's path is /usr/cids/idsRoot/htdocs/private/cidDump.html.
cidDump is a script that captures a large amount of information including the IPS processes list, log files, OS information, directory listings, package information, and configuration files.
To run the cidDump script, follow these steps:
Step 1
Step 2
Step 3
Step 4
gzip /usr/cids/idsRoot/log/cidDump.htmlStep 5
For the procedure, see Uploading and Accessing Files on the Cisco FTP Site.
Uploading and Accessing Files on the Cisco FTP Site
You can upload large files, for example, cidDump.html, the show tech-support command output, and cores, to the ftp-sj server.
To upload and access files on the Cisco FTP site, follow these steps:
Step 1
Step 2
Step 3
Step 4
Step 5