Network Summary
Available Languages
Table Of Contents
Navigation within the MARS Appliance
Setting the GUI and CLI Timeout Interval
Global Controller Activation Considerations
Automatic Activation Settings Page
Procedure to Set the Activation Interval
Network Summary
This chapter describes the web interface and the components of the Summary tab of the web interface and contains the following sections:
•
Navigation within the MARS Appliance
•
Setting the GUI and CLI Timeout Interval
Navigation within the MARS Appliance
The MARS web interface runs within a single brower window. The MARS product functions are categorized with labeled tabs, each tab subdivided with subtabs.

Note
Do not use the browser navigation buttons with the MARS Appliance GUI (for example, Back, Forward, Refresh, or Stop).
Logging In
Step 1
To login to the Local Controller, enter its IP or DNS address into the browser address field. The login box appears.
Figure 18-1 Local Controller Login Box

Step 2
Enter your login name and password. If you do not have a login name, contact your network administrator.
Step 3
From the Type drop-down list, select Local if you are logging in to a user account created on this MARS, or select Global if you are logging in to a user account created on the Global Controller to which this Local Controller reports.
Step 4
Click Login.
The first page to appear after a login is the Summary tab Dashboard page. The duration of the delay in displaying information results from a combination of the following causes:
•
How long the Local Controller has been powered up and connected to the network.
•
Amount of traffic on your networks
•
Reporting syslog levels of the reporting devices
•
Size of the network
•
The number and type of reporting devices
For most networks, the Summary page populates shortly after configuration. Some values are only relevant after an interval of time. For example, the values in the 24 Hour Events and 24 Hour Incidents tables.
Basic Navigation
The Local Controller uses a tab-based, hyperlinked user interface. When you mouse over an alphanumeric string or an icon that is a clickable hyper-link, the mouse cursor changes to a pointing finger cursor
. Figure 18-2 shows some of the clickable objects on the Dashboard page.
Figure 18-2 Links, Icons, and Filters

-
Click any of the seven tabs to navigate to the pages relevant to the tab's sub-tabs, as shown in Figure 18-3 though Figure 18-8.

Note
Do not use the browser navigation buttons with the MARS Appliance GUI (for example, Back, Forward, Refresh, or Stop).
Figure 18-3 Summary Tab

Figure 18-4 Incidents Tab

Figure 18-5 Query/Reports Tab

Figure 18-6 Rules Tab

Figure 18-7 Management Tab

Figure 18-8 Administration Tab

Figure 18-9 Help Tab

Help Page
The Help page, as shown in Figure 18-10, provides URLs to online documentation and a feedback form to submit constructive comments to the MARS development engineering team.
Figure 18-10 Help Page

Click About to display the software version number running on the MARS.
Click Documentation to display URLs to MARS documentation on the Cisco Systems, Inc. website (http://www.cisco.com).
Your Suggestions Welcomed
The Feedback button appears at the bottom of most pages, a shown in Figure 18-10.
When you click the feedback button, or navigate to the Feedback page, the feedback dialog box appears, as shown in Figure 18-11.
Figure 18-11 Feedback Dialog Box

To send your comments to the MARS development engineering team, type in your email address and comments then click Submit. When you click the Include log file a MARS log file is sent with your message.
Setting the GUI and CLI Timeout Interval
When a user is inactive on the GUI or CLI for a duration exceeding the timeout interval, that user is logged out and must login again to continue accessing the MARS Appliance. The settings for the timeout interval are Never (indefinite duration) 15, 30, 45, and 60 minutes.
In general, GUI activities that initiate access to the MARS webserver restart the timeout interval. Table 18-1 lists GUI activities that do not restart the timeout interval.
To set the timeout interval, do the following:
Step 1
Navigate to Admin > System Parameters > Timeout Settings, as shown in Figure 18-12.
Step 2
Select the timeout intervals for each role.
The timeout interval for the Administrator, Security Analyst, and Operator roles are set separately. The Admin timeout setting is also the timeout interval for the CLI.
Figure 18-12 Timeout Interval Configuration Page

Step 3
Click Submit.
End of Procedure
Activate Button
This section discusses the Activate button and contains the following subsections:
•
Activate Button Color Changes
•
Global Controller Activation Considerations
•
Automatic Activation Settings Page
•
Procedure to Set the Activation Interval
Activate Button Color and Activation Interval Features
3.x
The Activate button was introduced.
4.3.2 and 5.3.2
Activate button color change and activation setting page were introduced
Changes made to MARS configurations and settings, (most notably to devices, rules, and reports) must be passed to the MARS background processes by clicking Activate, or by scheduling an automatic activation process.
Note
The activation process is CPU intensive. It is best to activate after all changes are complete. For example, if you are adding multiple devices, it is better for system performance to activate the changes after adding all devices rather than activating after adding each device.
Activate Button Color Changes
The Activate button displays red with bold italic writing when a configuration change requires activation, as shown in Figure 18-13. The Activate button is on all tabs.
Figure 18-13 Activate Button Turns Red When GUI Configuration Change is Submitted

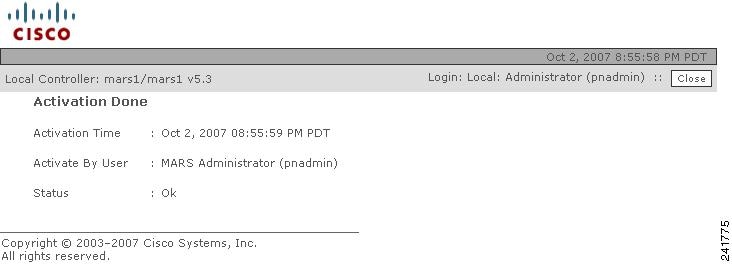
For the user account that made the changes, the Activate button displays red in every new session or already open session of that account. It does not display red in any sessions of any other accounts. When you click the red Activate button, a pop-up window appears displaying the time, login name, user role, and activation status, as shown in Figure 18-14. The Status field can display Ok, or Error. The action for Error is to try again later.
Figure 18-14 Popup Message Received when Activation Completed
When an Activation is complete, the Activate button displays white in all open and subsequently launched sessions, as shown in Figure 18-15.
Figure 18-15 Activate Button Resets to White When Activation Completes

Multiple Logged-in Users Making Changes at the Same Time
Clicking Activate, activates all changes made by all user accounts. If two different accounts both make changes, the red Activate button displays in both of their session GUIs. If one account clicks Activate, the changes of all other accounts are also activated, and the Activate button displays white in the GUI of all accounts (after a page refresh, or when clicking another tab).
Clicking the White Activate Button
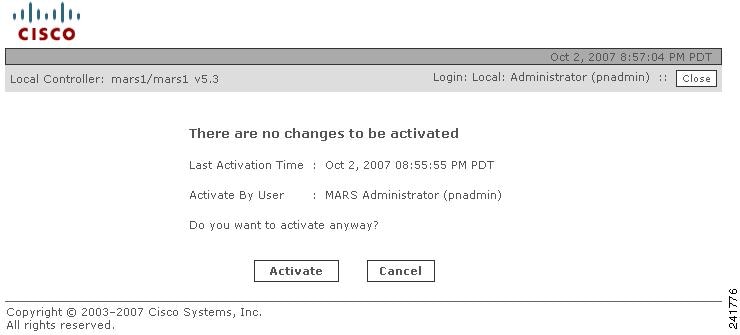
Clicking the white Activate button launches a pop-up message window displaying the last activation event time, the login name and role of the initiator, and an activate option as shown in Figure 18-16. Clicking the Activate option in the pop-up window forces an activation process. Any changes made by other accounts are activated, and an Activation Done pop-up window appears, as shown in Figure 18-14.
Figure 18-16 Popup Message When White Activate Button is Clicked
Global Controller Activation Considerations
A topology synchronization occurs between Global and Local Controllers when an activation process is initiated on either platform.
Automatic Activation Settings Page
A scheduler daemon that wakes up every minute can be configured to execute automatic activations.
The Activations Setting Page sets the time interval between automatic activations executed by the scheduler (Admin > System Parameters > Activation Settings). There is no CLI command for the scheduler.The time intervals are Never (default), 15, 30, 45, and 60 minutes.
Procedure to Set the Activation Interval
Complete the following steps to set the automatic activation schedule:
Step 1
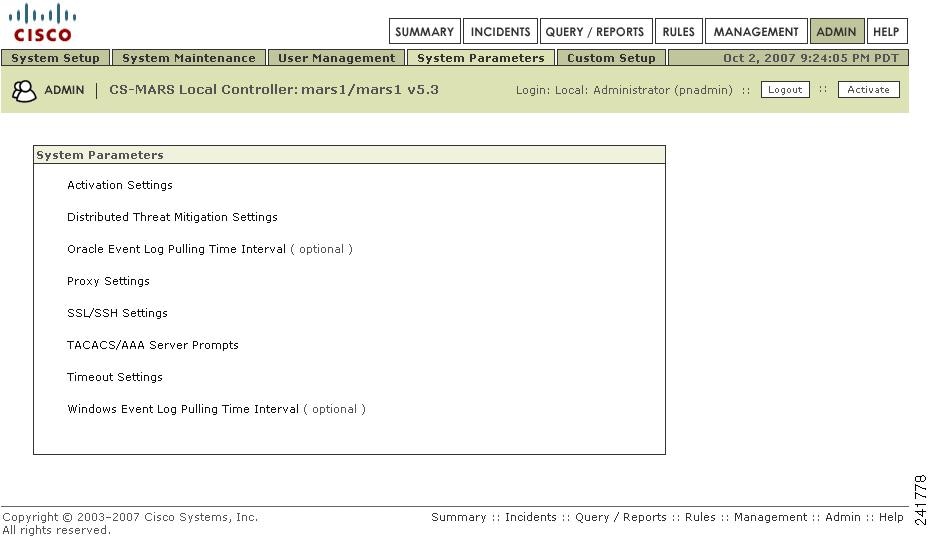
Navigate to the Admin > System Parameters page as shown in Figure 18-17.
Figure 18-17 Systems Parameters Page
Step 2
Click Activation Settings.
The Activation Interval page appears, as shown in Figure 18-18.
Figure 18-18 Automatic Activation Interval Page

Step 3
Select an Activation Interval from the drop-down list.
The possible values are NEVER (default), 15 minutes, 30 minutes, 45 minutes, and 60 minutes.
Step 4
Click Submit
End of Procedure to Set the Activation Interval.
Summary Page
This section contains the following subsections:
From the Summary pages, you can very quickly evaluate the state of the network. The Summary pages include the Dashboard, Network Status, and My Reports, a shown in Figure 18-19.
Figure 18-19 Summary Tab

Dashboard
This subsection contains the following subsections:

Note
When you first view the Summary page after upgrading the Local Controller, expect a small delay while the Java Server pages recompile.
Figure 18-20 The Working Areas on the Dashboard

Subtabs
Tabs
Case Bar (Local Controller only)
Recent incidents information
Links to Cases assigned to you.
HotSpot and Attack diagrams
Charts
Recent Incidents
The first feature to notice about the Dashboard are the recent incidents that have fired. The Local Controller comes with pre-defined rules, and these incidents are the result of those rules firing. These rules are generic, globally applicable, and should serve you well as a starting point once you begin to tune the Local Controller.
Figure 18-21 Drilling-down into Incidents

Sessions and Events
Within a given time window, a session is a collection of events that all share a common end-to-end:
•
Source and destination address
•
Source and destination port
•
Protocol
Event sessionization aggregates event data making it easier to sort and examine. Event sessionization lets the system treat events as single units of information and helps you understand if an attack truly has materialized. It gives you the context of the attack by giving you all the events on that session.
Sessionization works across NAT (network address translation) boundaries - if a session traverses a device that does NAT on that session, the Local Controller is able to sessionize events even if they are reported by two devices on either side of that firewall.
Networks start to show immediate action in the events and sessions categories. Note that the 24 Hour Events table and the Events and Sessions chart are different ways of presenting the same information.
Inactive Device Events
MARS generates an inactive device event for any device that does not report an event within 1 hour of the last received event. Inactive device events are generated for all security and monitoring devices except MARS, CSA, Symantec AntiVirus, FoundScan, eEye REM, QualysGuard, and Security Manager.
Data Reduction
Data Reduction is a representation of how much event data the Local Controller collapsed into sessions. For example a data reduction of 66% measures three events per session on the average - this number is dependent on many variables particular to your network.
Figure 18-22 Data Reduction

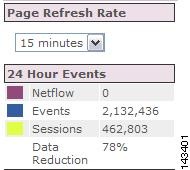
Page Refresh
The Page Refresh Rate polls the Local Controller according to the setting you assign. The default setting is fifteen minutes. The refresh setting remains the same until you log out. This setting only applies to the pages that have the Page Refresh pull-down.
Figure 18-23 Page Refresh

Note
You can change the refresh rate with the dropdown list.
Diagrams
This subsection contains the following subsections:
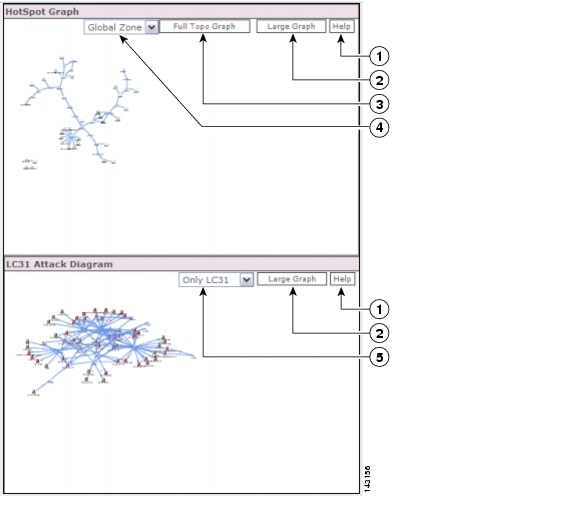
The Summary page has two diagrams: the Hot Spot Graph and the Attack Diagram. Local Controller uses the configuration and topology discovery information that you provide to generate these diagrams . The following table shows you the icons used in the diagrams.
You can start drilling-down into the diagrams by clicking any of the icons listed in Table 18-2. You can start drilling-down attack paths in the Attack Diagram by clicking the Path icon
. Drilling-down into these diagrams is one of the fastest ways to uncover real-time information about your network.
Figure 18-24 Clickable Hot Spots: Brown = Attackers & Red = Compromised


Note
Clouds can represent collections of gateways in the Hotspot graph. A gateway cloud is a device that is unknown to the Local Controller. You can discover gateway clouds by clicking them if you have the SNMP information.
Table 18-2 Icons and States in Topology
Clouds


Firewall


Reporting Host


Host


IDS


Network


Router


Switch


To see the diagrams, you need the Adobe SVG viewer plug-in. The Adobe SVG viewer plug-in should automatically install.

Note
If you click No on the SVG auto-installer, the Local Controller does not prompt you to install it again. If you want to run the auto-installer, open the browser and click Tools > Internet Options > General > Delete Cookies.
Figure 18-25 The Hot Spot Graph and Attack Diagram
Manipulating the Diagrams
•
Right-click the diagram to zoom in and out, to reset the diagram to its original size, to set the diagram's viewing quality, to search, and to manipulate the SVG image.
•
Alt+click to use the hand to move the image.
•
Ctrl+click to use the magnifying glass to zoom in.
•
Ctrl+click and drag to select an area.
•
Ctrl+shift+click to use the magnifying glass to zoom out.

Note
If the Local Controller discovers an unknown device, it displays that device using a unique name in the form of the string "eth" followed by a hyphen ("-"), followed by the IP address in 32 bit notation, such as "eth-168034561".
Display Devices in Topology
You can specify how to display a reporting device in the HotSpot Graph. By clicking the icon in the Device Display column, you can specify whether to display the device as an individual node on the graph or collapse it within a cloud. By having a device "hidden" in a cloud, you can cut down on the number of devices displayed in the graph, thus making it easier to read at a higher level.
A cloud identifies a collection of networks for which you do not want to define the complete physical topology. Much like when you draw a network diagram on a piece of paper, you can use a cloud to depict networks in which you have no direct interest, but which are needed to represent to complete the diagram. For example, you may want to display only gateway devices or mitigation devices, representing other reporting devices as part of a cloud.
To toggle the display status of a device, follow these steps:
Step 1
Click Admin > Security and Monitor Devices.
Step 2
Click the icon in the Device Display column of the device that you want to toggle.
Figure 18-26 The Device Display icons

The icon changes from a host icon to a host within a cloud or vice versa.
Step 3
Click Activate.
Network Status
The Network Status page is where you come to get the big picture. On the Network Status page, you can see the charts for:
· IncidentsRated by severity.
· Attacks: All - Top Rules FiredRated by the highest number of incidents fired.
· Activity: All - Top Event TypesRated by the highest numbers of events of that type.
· Activity: All - Top Reporting DevicesRated by the total number of events reported by each security device.
· Activity: All - Top SourcesThe top IP addresses that appear as session sources, ranked by session count.
· Activity: All - Top DestinationsThe top IP addresses that appear as session destinations, ranked by session count.
For all of the charts on this page, you can set different time frames, the size of the chart, view the latest report, and so on, by clicking on the buttons in the chart's window.
Reading Charts
These are stacked charts. You can tell which severity of incident your network has most experienced for the day by looking for the dominant shade. In the figure below, low priority green incidents cover less area than high priority red incidents because they have occurred less often.
Figure 18-27 A Day's Events and Netflow with the Legend Displayed

To read the charts most efficiently, note that it is solely the thickness of a particular color that determines its value at that point - and that a spike (or drop) in any particular color could be caused by a spike (or drop) of a different color lower down in the stack.
A perfectly flat line indicates that Local Controller received no data during that time period.
Figure 18-28 A Flat Line in a Week's Top Rules Fired

In the following Incidents chart, you can see the top incidents for the week, starting eight days in the past.
Figure 18-29 Eight Days of Incidents

A more drastic spike in red is not offset by the green incident
Incident spikes are built upon each other
My Reports
The My Reports page is where you can choose the reports that you want to view. As long as you are using the Local Controller with your log in name, the reports that you have selected appear here.
To set up reports for viewing
Step 1
Click the Edit button on the My Reports page.
Step 2
Select the radio button next to the report that you want to see as a chart.
Step 3
Click Submit.
Local Controller now displays the chart that you selected on the My Reports page.

Note
Reports must be scheduled to run periodically, that is, every hour or every day. If you activate a report, allow for some time for the data to accumulate.
You can display any number of charts on the My Reports page, however expect slower loading times for large numbers of charts.
The reports that you can select from are pre-defined. When you create your own reports, you can select those to display. See Reports, page 21-23 for more information.


 Feedback