Measuring Delay, Jitter, and Packet Loss with Cisco IOS SAA and RTTMON
Available Languages
Contents
Introduction
This document describes methods for measuring delay, jitter, and packet loss on the data network using Cisco IOS® Service Assurance Agent (SAA) and Round Trip Time Monitor (RTTMON) features and Cisco routers.
Measuring Delay, Jitter, and Packet Loss for Voice-enabled Data Networks
The Importance of Measuring Delay, Jitter, and Packet Loss
With the emergence of new applications on data networks, it is becoming increasingly important for customers to accurately predict the impact of new application rollouts. Not long ago, it was easy to allocate bandwidth to applications and let the applications adapt to the exploding nature of traffic flows through timeout and retransmission functions of the upper layer protocols. Now, however, new world applications, such as voice and video, are more susceptible to changes in the transmission characteristics of data networks. It is imperative to understand the traffic characteristics of the network before deployment of new world applications to ensure successful implementations.
Defining Delay, Jitter, and Packet Loss
Voice over IP (VoIP) is susceptible to network behaviors, referred to as delay and jitter, which can degrade the voice application to the point of being unacceptable to the average user. Delay is the time taken from point-to-point in a network. Delay can be measured in either one-way or round-trip delay. One-way delay calculations require expensive sophisticated test gear and are beyond the budget and expertise of most enterprise customers. However, measuring round-trip delay is easier and requires less expensive equipment. To get a general measurement of one-way delay, measure round-trip delay and divide the result by two. VoIP typically tolerates delays up to 150 ms before the quality of the call is unacceptable.
Jitter is the variation in delay over time from point-to-point. If the delay of transmissions varies too widely in a VoIP call, the call quality is greatly degraded. The amount of jitter tolerable on the network is affected by the depth of the jitter buffer on the network equipment in the voice path. The more jitter buffer available, the more the network can reduce the effects of jitter.
Packet loss is losing packets along the data path, which severely degrades the voice application.
Prior to deploying VoIP applications, it is important to assess the delay, jitter, and packet loss on the data network in order to determine if the voice applications work. The delay, jitter, and packet loss measurements can then aid in the correct design and configuration of traffic prioritization, as well as buffering parameters in the data network equipment.
SAA and RTTMON
The SAA and RTTMON MIB are Cisco IOS software features available in versions 12.0 (5)T and higher. These features enable you to test and collect delay, jitter, and packet loss statistics on the data network. Internetwork Performance Monitor (IPM) is a Cisco network management application that can configure the features and monitor the SAA and RTTMON data. The SAA and RTTMON features can be used to measure delay, jitter, and packet loss by deploying small Cisco IOS routers as agents to simulate customer end stations. The routers are referred to as delay and jitter probes. Additionally, the delay and jitter probes can be configured with the remote monitoring (RMON) alarm and event triggers once baseline values have been determined. This allows the delay and jitter probes to monitor the network for predetermined delay and jitter service levels and alert network management system (NMS) stations when a threshold is exceeded.
Deploying Delay and Jitter Agent Routers
Where to Deploy
Delay and jitter can be measured by deploying Cisco routers 17xx or higher with Cisco IOS software code version 12.05T or higher, and configuring the Cisco IOS SAA features. The routers should be placed in the campus networks next to hosts. This provides statistics for end-to-end connections. Since it is not practical to measure every possible voice path in the network, place the probes in typical host locations providing for a statistical sampling of typical voice paths. Some examples include:
-
a local campus-to-campus path
-
a local campus-to-remote campus path via a 384 kbs Frame Relay circuit
-
a local campus-to-remote campus via an ATM permanent virtual circuit (PVC)
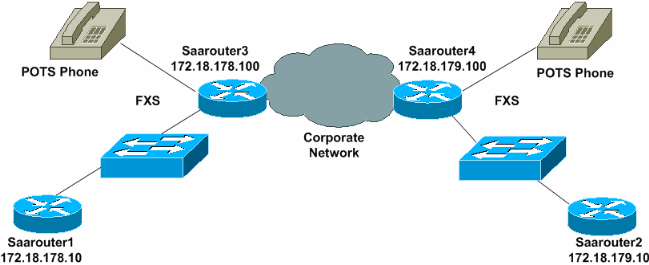
In the case of VoIP deployments using traditional phones connected to Cisco routers using Foreign Exchange Station (FXS) ports, use the router connected to the phones to serve as the delay and jitter probes. Once deployed, the probe collects statistics and populates Simple Network Management Protocol (SNMP) MIB tables in the router. The data can then be accessed either through the Cisco IPM application or through SNMP polling tools. Additionally, once baseline values have been established, SAA can be configured to send alerts to an NMS station if thresholds for delay, jitter, and packet loss are exceeded.
Simulating a Voice Call
One of the strengths of using SAA as the testing mechanism is that a voice call can be simulated. For example, imagine you want to simulate a G.711 voice call. You know that it uses RTP/UDP ports 14384 and above, it is approximately 64 kb/s, and the packet size is 200 bytes {(160 bytes of payload + 40 bytes for IP/UDP/RTP (uncompressed) }.You can simulate that type of traffic by setting up the SAA Delay/Jitter Probe as shown below.
The jitter operation needs to do this:
-
Send the request to RTP/UDP port number 14384.
-
Send 172 byte packets (160 payload + 12 byte RTP header size) + 28 bytes (IP + UDP).
-
Send 3000 packets for each frequency cycle.
-
Send every packet 20 milliseconds apart for a duration of 60 seconds and sleep 10 seconds before starting the next frequency cycle.
Those parameters give 64 kb/s for 60 seconds.
-
((3000 datagrams * 160 bytes per datagram)/ 60 seconds)) * 8 bits per byte = 64 kb/s
The configuration on the router appears as follows:
rtr 1
type jitter dest-ipaddr 172.18.179.10 dest-port 14384 num-packets 3000+
request-data-size 172*
frequency 70
rtr schedule 1 life 2147483647 start-time now
Note: IP+UDP is not considered in the request-data-size as the router adds them automatically to the size internally.
Note: Currently, Cisco IOS only supports 1000 packets per operation. This limit will be raised in a future release.
Delay and Jitter Probe Deployment Example
The routers in the following example simulate 60-second voice calls every 60 seconds and record delay, jitter, and packet loss in both directions.
Note: The delay calculations are round-trip times and must be divided by two to get the one-way delay.

saarouter1#
rtr responder
rtr 1
type jitter dest-ipaddr 172.18.179.10 dest-port 14384 num-packets 1000
request-data-size 492
frequency 60
rtr schedule 1 life 2147483647 start-time now

saarouter2#
rtr responder
rtr 1
type jitter dest-ipaddr 172.18.178.10 dest-port 14385 num-packets 1000
request-data-size 492
rtr schedule 1 life 2147483647 start-time now

saarouter3#
rtr responder
rtr 1
type jitter dest-ipaddr 172.18.179.100 dest-port 14385 num-packets 1000
request-data-size 492
frequency 60
rtr schedule 1 life 2147483647 start-time now

saarouter4#
rtr responder
rtr 1
type jitter dest-ipaddr 172.18.178.100 dest-port 14385 num-packets 1000
request-data-size 492
frequency 60
rtr schedule 1 life 2147483647 start-time now
Sample Data Collections
Polling the MIB Tables
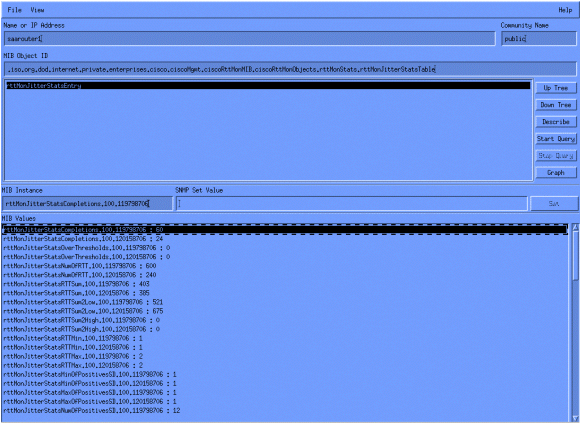
The delay and jitter probes begin collecting data that is subsequently placed in SNMP MIB tables. The rttMonStats table provides a one hour average of all the jitter operations for the last hour. The rttMonLatestJitterOper table provides the values of the last operation completed. For general statistics on delay and jitter, poll the rttMonStats table every hour. For more granular statistics, poll the rttMonLatestJitterOper table at a higher frequency level than the jitter operation. For example, if the delay and jitter probe is calculating jitter every five minutes, do not poll the MIB at any interval less than five minutes.
The following screen capture shows data from the rttMonJitterStatsTable gathered from an HP OpenView Network Node Manager MIB poll.

SAA Report Example
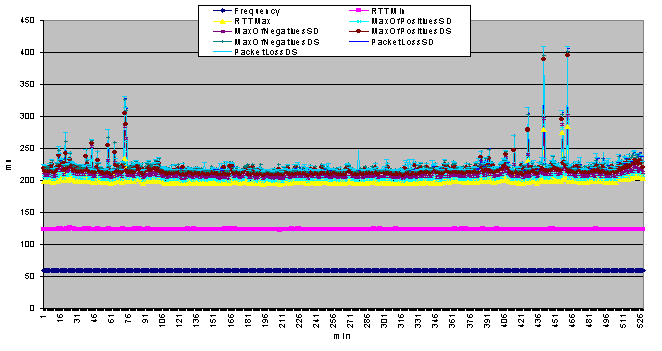
The following SAA data graph is a compilation of delay, jitter, and packet loss data points over an eight-hour period for one pair of delay and jitter probes.

Command Line Data Examples
The data can also be viewed using the Cisco IOS show command at the command line on the delay and jitter probes. A Perl Expect script can be used to gather data from the command line and export it to a text file for later analysis. Additionally, the command line data can also be used for real time monitoring and troubleshooting of delay, jitter, and packet loss.
The following example shows the command output from the show rtr collection-stats command on the saarouter1 router.
#show rtr collection-stats 100

Collected Statistics

Entry Number: 100
Target Address: 172.16.71.243, Port Number: 16384
Start Time: 13:06:04.000 09:25:00 Tue Mar 21 2000
RTT Values:
NumOfRTT: 600   RTTSum: 873     RTTSum2: 1431
Packet Loss Values:
PacketLossSD: 0 PacketLossDS: 0
PacketOutOfSequence: 0  PacketMIA: 0    PacketLateArrival: 0
InternalError: 0        Busies: 0
Jitter Values:
MinOfPositivesSD: 1     MaxOfPositivesSD: 1
NumOfPositivesSD: 23    SumOfPositivesSD: 23    Sum2PositivesSD: 23
MinOfNegativesSD: 1     MaxOfNegativesSD: 1
NumOfNegativesSD: 1     SumOfNegativesSD: 1     Sum2NegativesSD: 1
MinOfPositivesDS: 1     MaxOfPositivesDS: 1
NumOfPositivesDS: 7     SumOfPositivesDS: 7     Sum2PositivesDS: 7
MinOfNegativesDS: 1     MaxOfNegativesDS: 1
NumOfNegativesDS: 18    SumOfNegativesDS: 18    Sum2NegativesDS: 18

Entry Number: 100
Target Address: 172.16.71.243, Port Number: 16384
Start Time: 14:06:04.000 09:25:00 Tue Mar 21 2000
RTT Values:
NumOfRTT: 590   RTTSum: 869     RTTSum2: 1497
Packet Loss Values:
PacketLossSD: 0 PacketLossDS: 0
PacketOutOfSequence: 0  PacketMIA: 0    PacketLateArrival: 0
InternalError: 0        Busies: 0
Jitter Values:
MinOfPositivesSD: 1     MaxOfPositivesSD: 1
NumOfPositivesSD: 29    SumOfPositivesSD: 29    Sum2PositivesSD: 29
MinOfNegativesSD: 1     MaxOfNegativesSD: 1
NumOfNegativesSD: 7     SumOfNegativesSD: 7     Sum2NegativesSD: 7
MinOfPositivesDS: 1     MaxOfPositivesDS: 1
NumOfPositivesDS: 47    SumOfPositivesDS: 47    Sum2PositivesDS: 47
MinOfNegativesDS: 1     MaxOfNegativesDS: 1
NumOfNegativesDS: 5     SumOfNegativesDS: 5     Sum2NegativesDS: 5
Proactive Monitoring of Thresholds
There are several ways to monitor the delay, jitter, and packet loss levels in the network once baseline values have been established through the initial data collection. One way is to use the SAA threshold command. Another is to use a feature in the Cisco IOS mainline code called RMON Alarm and Event.
SAA threshold Command
The SAA feature set threshold command sets the rising threshold (hysteresis) that generates a reaction event and stores history information for the operation. The following SAA threshold configuration on the delay and jitter probe enables the monitoring of jitter and creates an SNMP trap upon the violation of a 5 ms threshold.
saarouter1#
rtr 100
rtr reaction-configuration 100 threshold-falling 5 threshold-type immediate
RMON Alarm and Event
The delay and jitter probes monitor predetermined thresholds using either the SAA Cisco IOS features, or the Cisco IOS RMON alarm and event method. In either case, the router monitors delay, jitter, and packet loss and alerts NMS stations of threshold violations via SNMP traps.
The following RMON alarm and event trap configuration causes saarouter1 to generate an SNMP trap if the rising threshold exceeds 140 ms maximum round-trip time. It also sends another trap when the maximum round-trip time falls back below 100 ms. The trap is then sent to the log on the router, as well as to the NMS station 172.16.71.19.
saarouter1#
rmon alarm 10 rttMonJitterStatsRTTMax.100.120518706 1 absolute rising-threshold 140 100 falling-threshold 100 101 owner jharp
rmon event 100 log trap private description max_rtt_exceeded owner jharp
rmon event 101 log trap private description rtt_max_threshold_reset owner jharp
Appendix
Jitter Calculations in Cisco SAA Delay Jitter Probes
Jitter is the variance in one-way latency and is calculated based on sending and receiving time stamps of consecutive packets sent out.
| Time Stamp | Sender | Responder |
|---|---|---|
| T1 | send pkt1 | |
| T2 | recv pkt1 | |
| T3 | send back reply for pkt1 | |
| T4 | recv reply for pkt1 | |
| T5 | send pkt2 | |
| T6 | recv pkt2 | |
| T7 | send back reply for pkt2 | |
| T8 | recv reply for pkt2 |
For packet 1 and packet 2 above, use the following source and destination calculations.
-
Jitter from source to destination (JitterSD) = (T6-T2) - (T5-T1)
-
Jitter from destination to source (JitterDS) = (T8-T4) - (T7-T3)
Jitter is calculated using time stamps of every two consecutive packets. For example:
Router1 send packet1 T1 = 0
Router2 receives packet1 T2 = 20 ms
Router2 sends back packet1 T3 = 40 ms
Router1 receives packet1 response T4 = 60 ms
Router1 sends packet2 T5 = 60 ms
Router2 receives packet2 T6 = 82 ms
Router2 sends back packet2 T7 = 104 ms
Router1 receives packet2 response T8 = 126 ms

Jitter from source to destination (JitterSD) = (T6-T2) - (T5-T1)
Jitter from source to destination (JitterSD) = (82 ms - 20 ms) - (60 ms - 0 ms) = 2 ms positive jitter SD

Jitter from destination to source (JitterDS) = (T8-T4) - (T7-T3)
Jitter from destination to source (JitterDS) = (126 ms - 60 ms) - (10 4ms - 40 ms) = 2 ms positive jitter DS
Delay and Jitter Probe Router Hardware and Software Configurations
-
CISCO1720—10/100BaseT Modular Router with two WAN slots and Cisco IOS IP Software
-
MEM1700-16U24D—Cisco 1700 16 MB to 24 MB DRAM Factory Upgrade
-
MEM1700-4U8MFC—Cisco 1700 4 MB to 8 MB Mini-Flash Card Factory Upgrade
-
CAB-AC—Power Cord, 110V
-
S17CP-12.1.1T—Cisco 1700 IOS IP PLUS
Related Information
Revision History
| Revision | Publish Date | Comments |
|---|---|---|
1.0 |
02-Dec-2013 |
Initial Release |
Contact Cisco
- Open a Support Case

- (Requires a Cisco Service Contract)
 Feedback