Cisco Nexus Dashboard Fabric Controller 12 Data Sheet
Available Languages
Bias-Free Language
The documentation set for this product strives to use bias-free language. For the purposes of this documentation set, bias-free is defined as language that does not imply discrimination based on age, disability, gender, racial identity, ethnic identity, sexual orientation, socioeconomic status, and intersectionality. Exceptions may be present in the documentation due to language that is hardcoded in the user interfaces of the product software, language used based on RFP documentation, or language that is used by a referenced third-party product. Learn more about how Cisco is using Inclusive Language.
Cisco Nexus® Dashboard Fabric Controller (NDFC) is the comprehensive management and automation solution for all Cisco Nexus and Cisco Multilayer Distributed Switching (MDS) platforms powered by Cisco NX-OS. NDFC provides management, automation, control, monitoring, and integration for deployments spanning LAN, SAN, and IP Fabric for Media (IPFM) fabrics. NDFC facilitates seamless interconnectivity and automation.
● Management: NDFC provides fabric-oriented configuration and operations management. It is optimized for large deployments with little overhead, but traditional deployments are supported and can be customized by the user to meet business needs. NDFC also provides representational state transfer (RESTful) APIs to allow easy integration from Cisco® or third-party overlay managers, enabling the automation to meet customers’ needs.
● Automation: NDFC brings an easy-to-understand and simple deployment approach to bootstrapping new fabrics in a private cloud environment. Cisco’s best practices are built into the fabric builder policy templates, and automatic bootstrap occurs with the click of a button, reducing provisioning times and simplifying deployments.
● Monitoring and visualization: NDFC brings in active topology monitoring views at a multi-fabric level into the new NDFC UI. When combined with Cisco’s Nexus Dashboard Insights (NDI), customers can complement their solution with advanced support for day-2 operations.
Cisco Nexus Dashboard Fabric Controller Release 12 features
Cisco NDFC is fully integrated as a native service on the Cisco Nexus Dashboard (ND), providing a single sign-on and a simplified user experience across the entire data center software portfolio. Simply download a single Nexus Dashboard software image and enable NDFC as a service. Scale and performance were top of mind in the development of NDFC and as such included modern architectures that include microservices and containerization of functions to help ensure reliability and allow for growth over time.
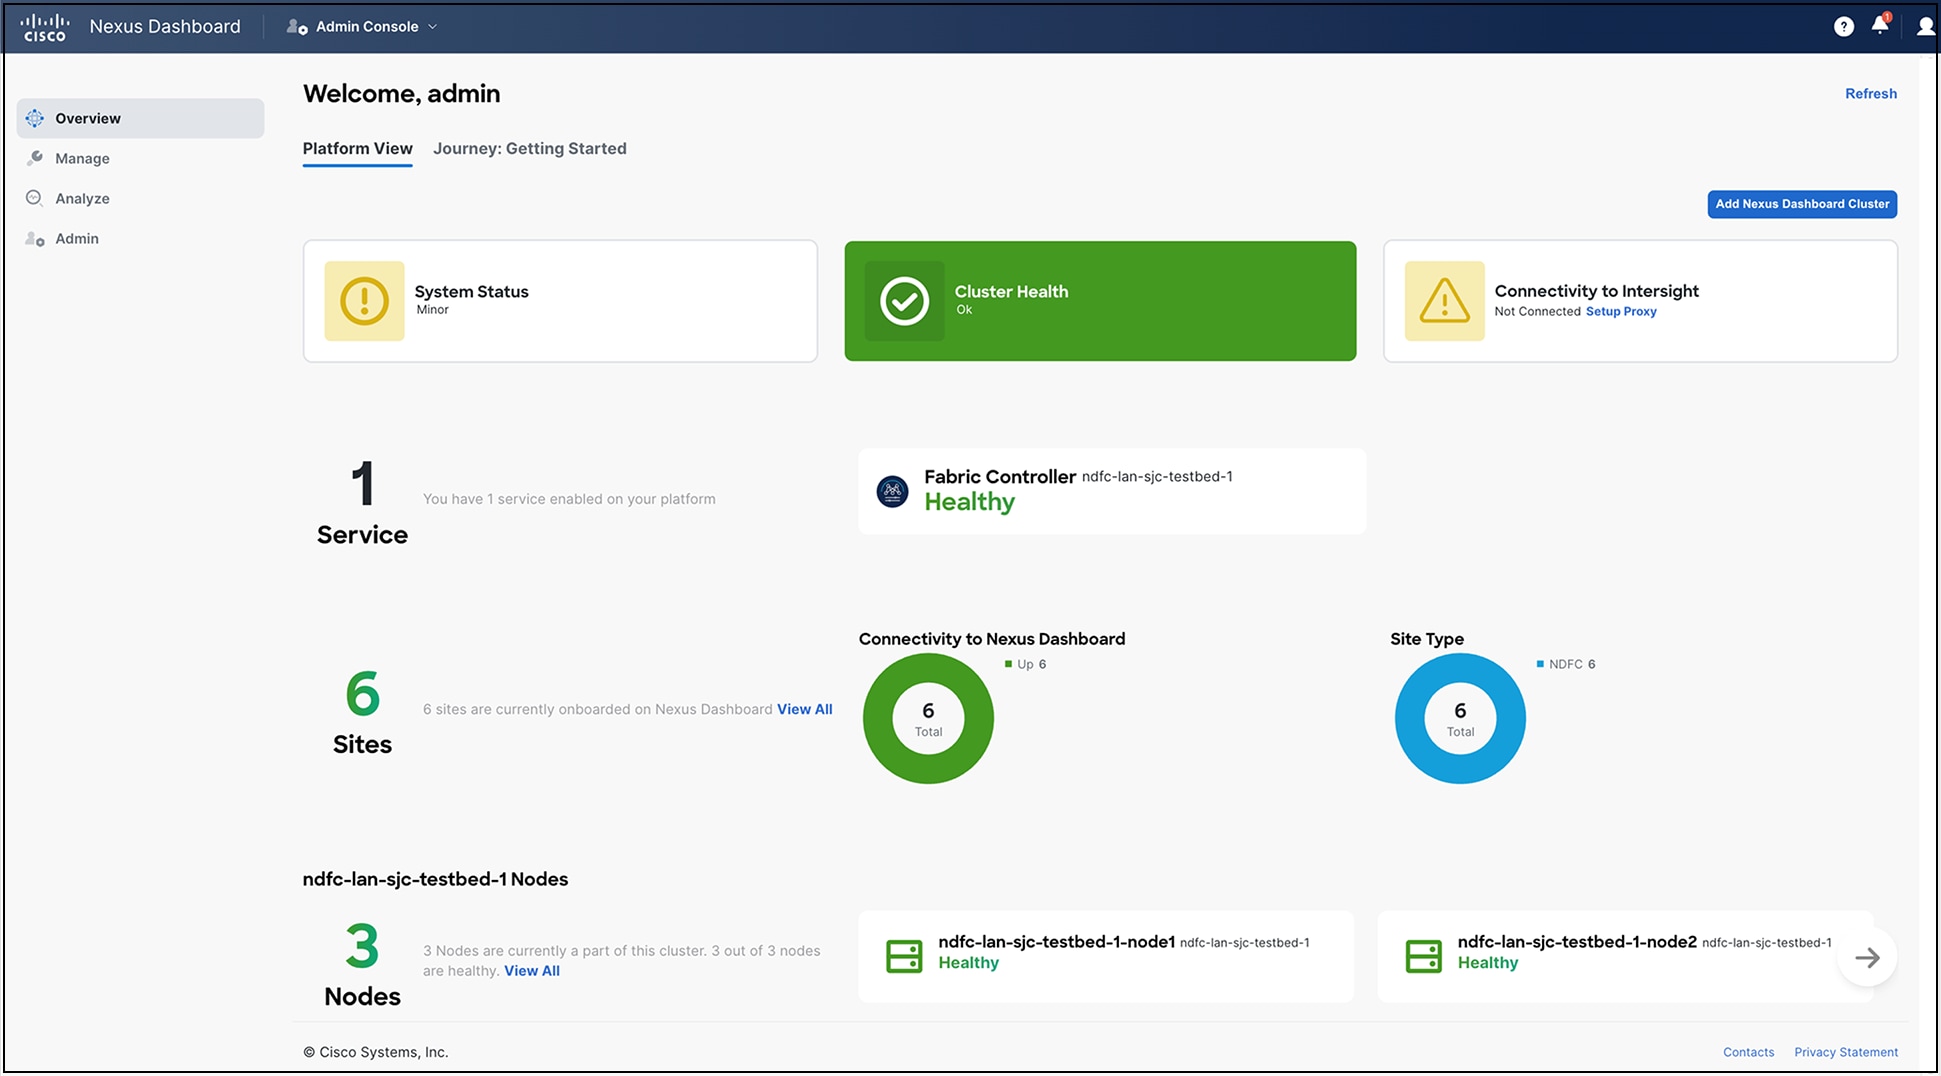
Nexus Dashboard Platform View
Enriched UI
The architecture in NDFC is based on microservices, running on Nexus Dashboard. By moving away from a monolithic to a containerized and modular infrastructure, users will be able to leverage this new model to enable elastic scale out. NDFC will also support active/active high availability with L2 reachability or L3 reachability for 3-node clusters. NDFC offers a great look and feel with an intuitive React JS GUI that will align to the GUI in Nexus Dashboard, and other services and support modernized topology views. The dashboard overview (Figure 2) provides a summary of the major details of all of the fabrics managed by that instance.
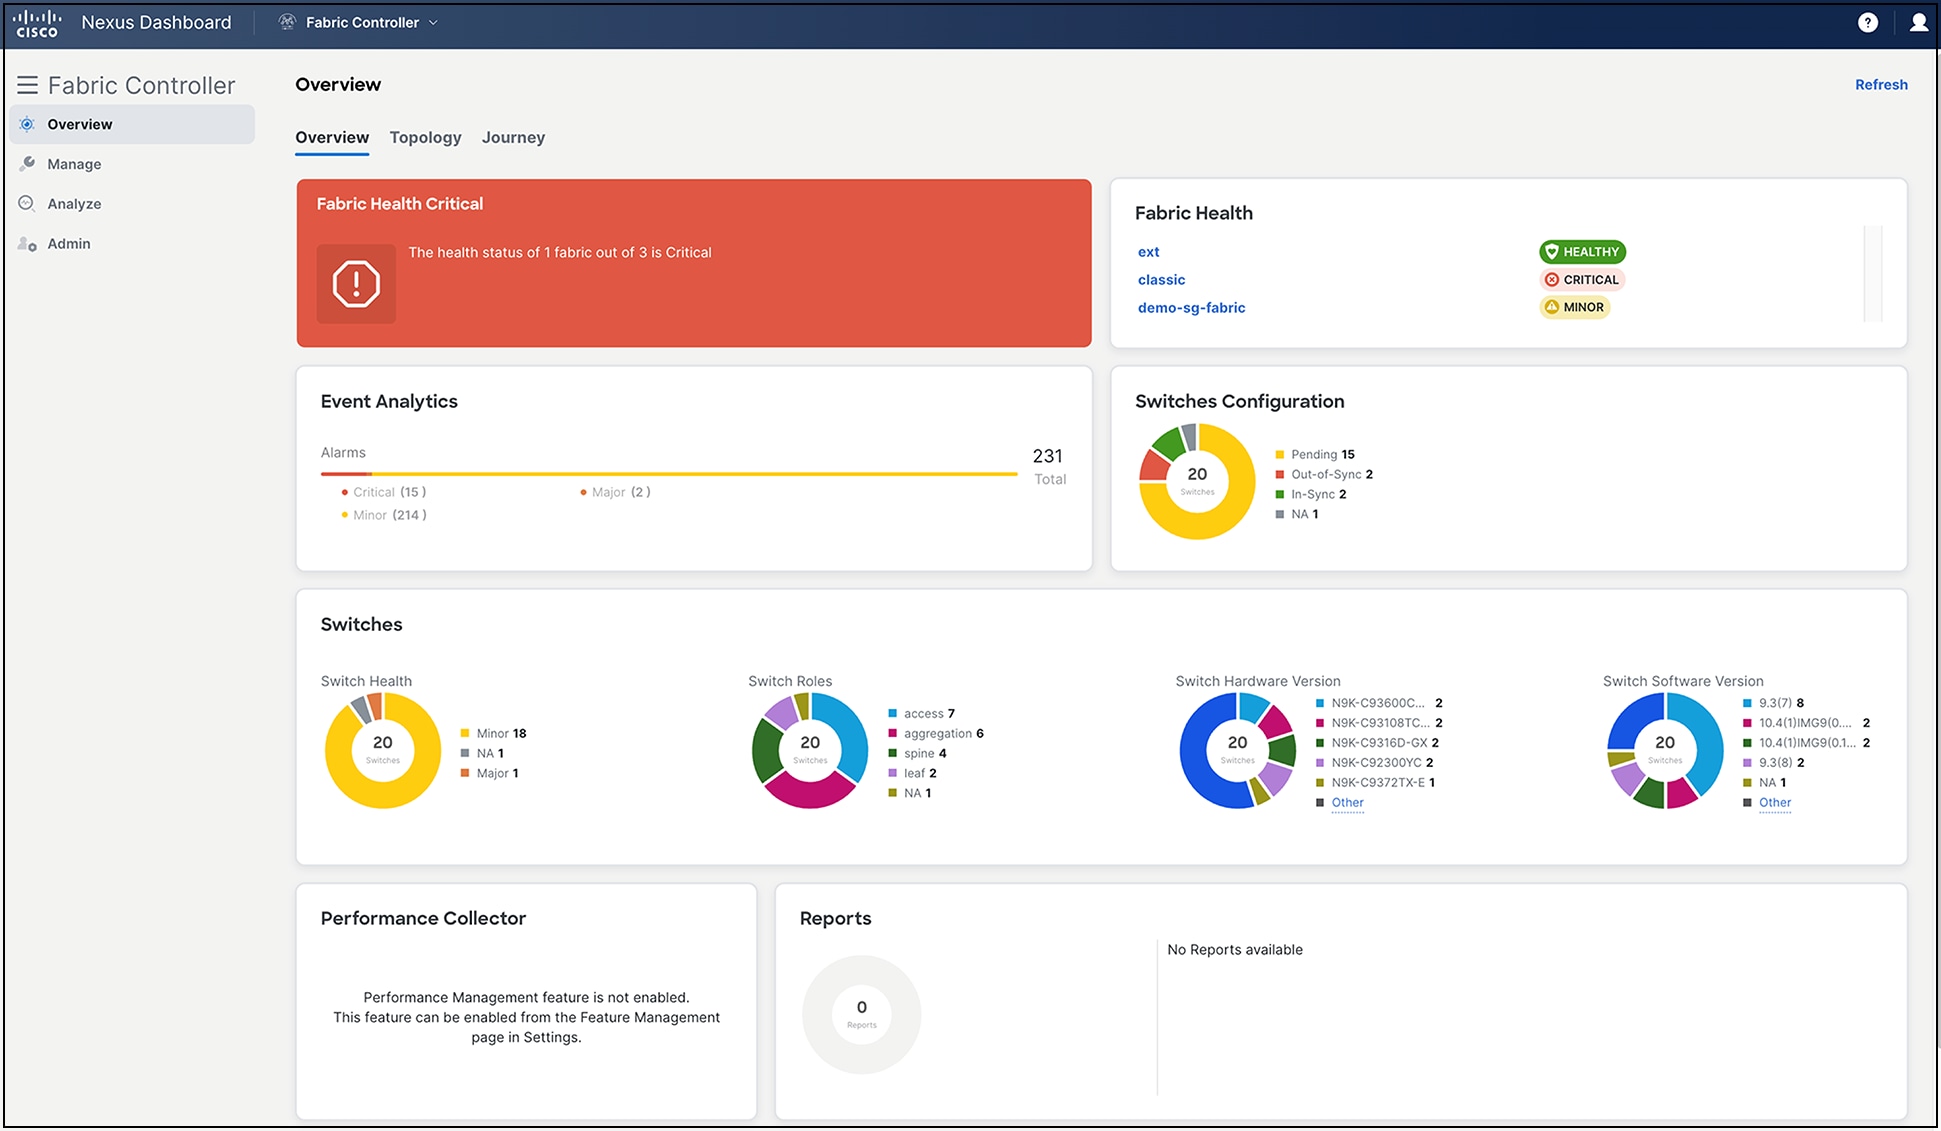
Cisco Nexus Dashboard Fabric Controller UI: overview

Cisco Nexus Dashboard Fabric Controller UI: enhanced common topology
Journey
NDFC offers you guided workflows on the various milestones in your NDFC journey. These guided workflows give you details on the items required in each milestone, starting with setting up the controller service and including creating fabrics, adding switches, etc.
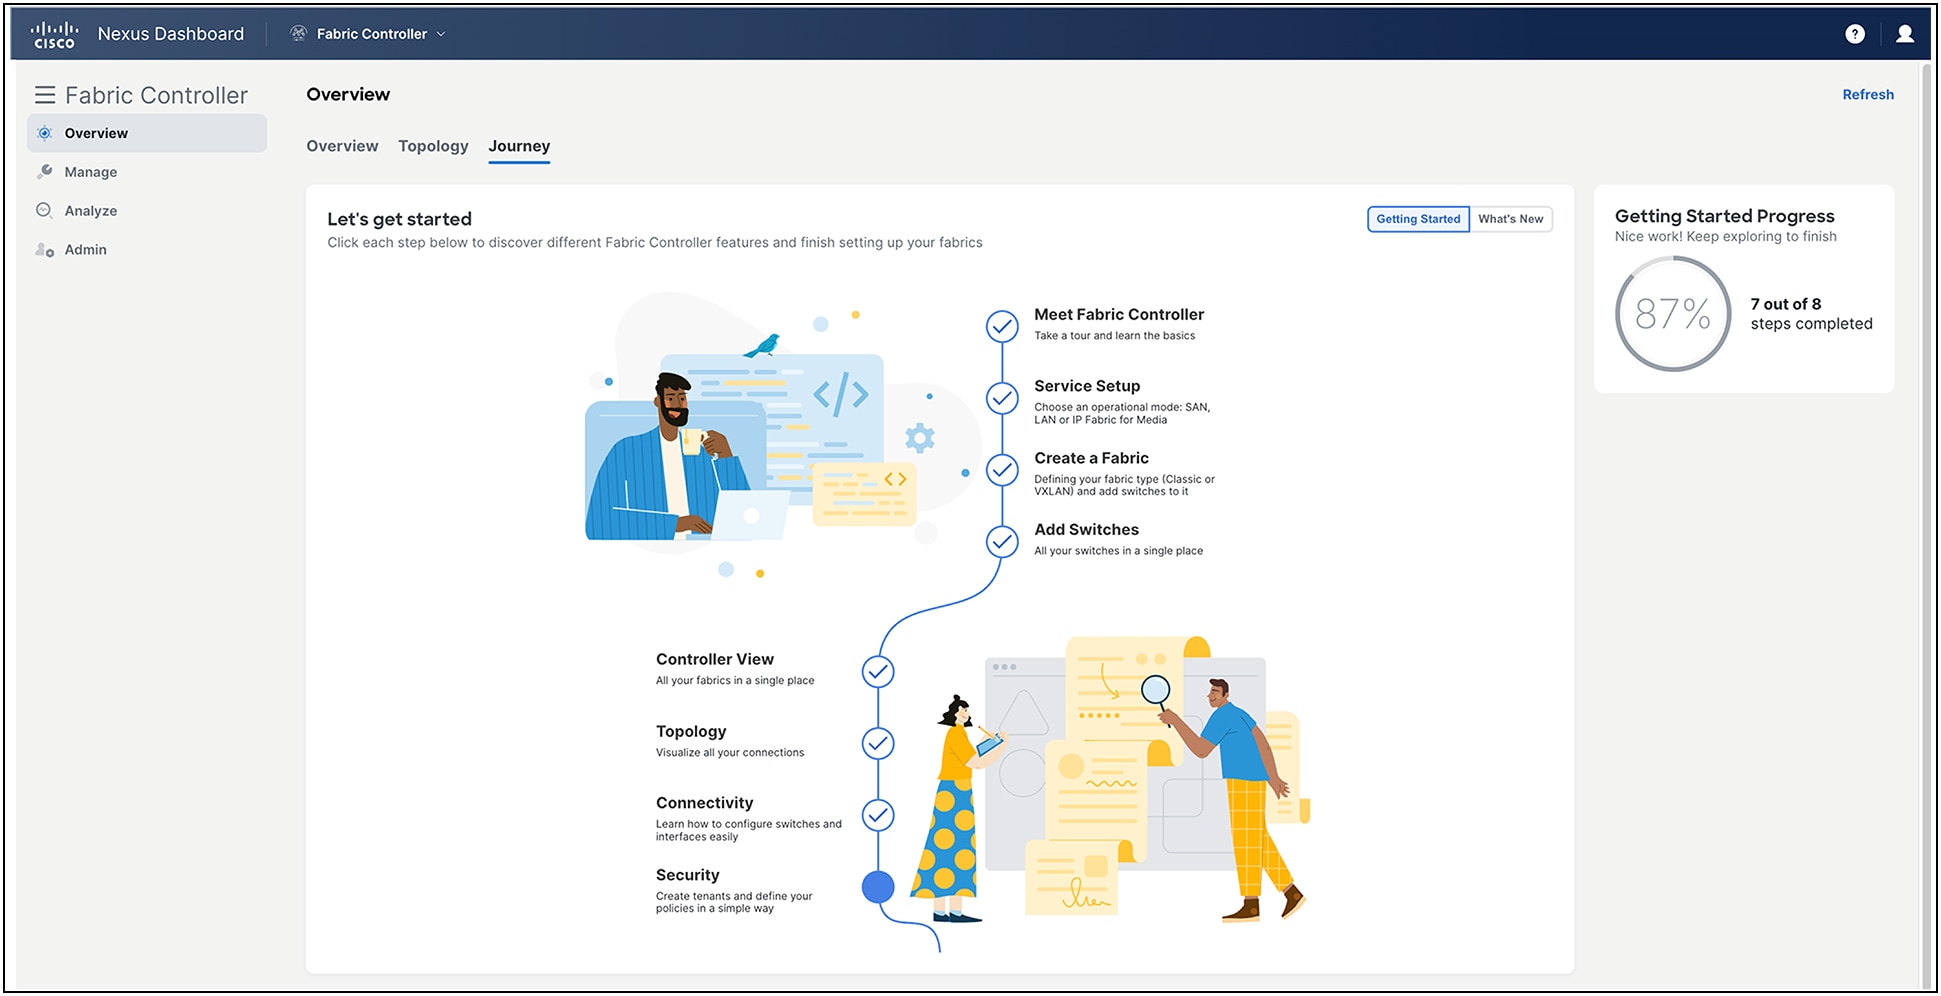
Cisco Nexus Dashboard Fabric Controller UI: journey
Feature manager
NDFC has a runtime feature installer, which helps you to select a mode at installation for LAN, SAN, or IPFM. This feature-management capability will allow you to selectively enable or disable different features, including Fabric Controller (LAN), SAN, IPFM, and Fabric Discovery.
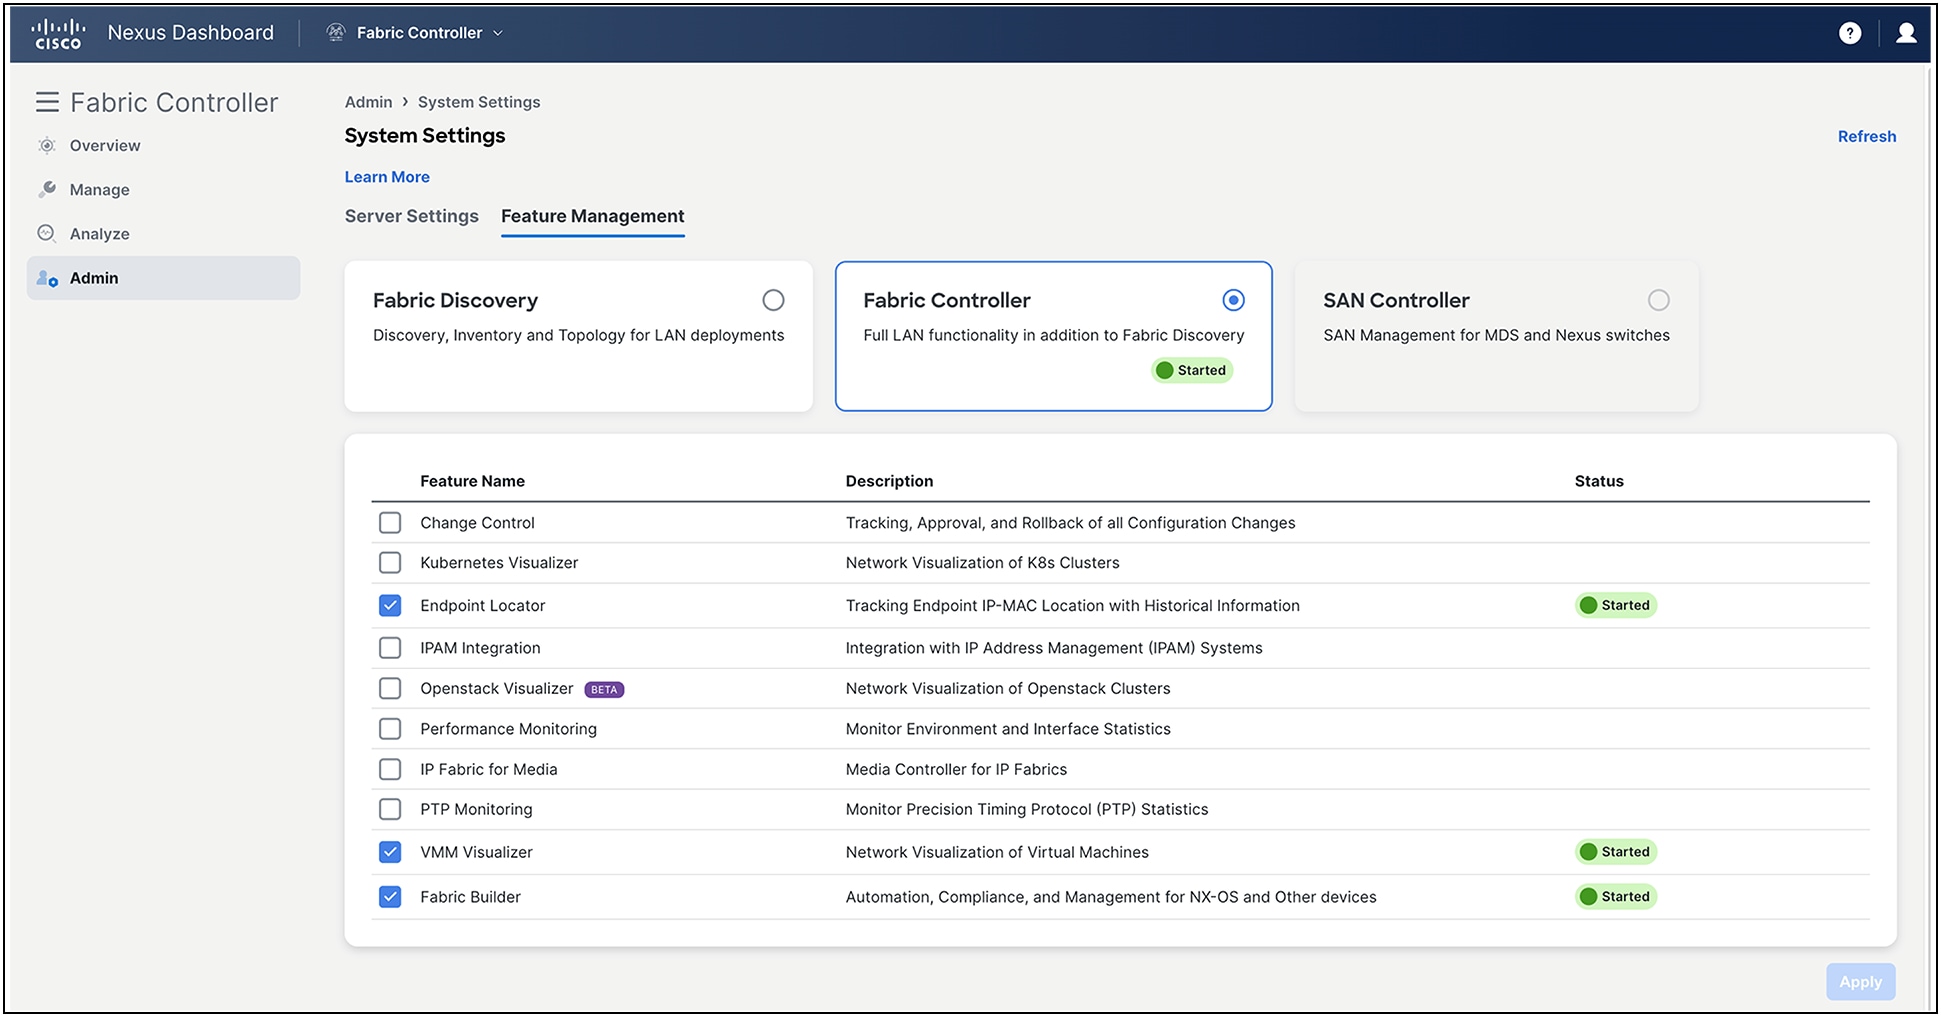
NDFC feature manager UI
The LAN Fabric One Manage feature offers centralized management for fabric groups and multisite groups across multiple NDFC clusters in a multicluster environment. You can create a multisite domain (MSD) using One Manage, where you can select one NDFC instance to be the parent instance, add child fabrics from any NDFC instance that is part of a multicluster fabric, and perform all necessary multisite functionality available in a regular VXLAN EVPN multisite fabric. You can import an existing MSD from any NDFC instance that is part of a multicluster fabric and connect it to other VXLAN EVPN fabrics from the multicluster fabric. In one click, you can recalculate and deploy, and the multisite underlay will be configured automatically. The One Manage feature eliminates the necessity for a separate tool to orchestrate multisite connectivity.
NDFC provides an all-cluster dashboard, aggregating information from multiple federated NDFC-managed LAN fabric clusters. It provides remote users with a comprehensive overview of the network, including the number of LAN clusters, fabrics, and switches, along with detailed displays of health statuses, release versions, and switch models. Users can access the dashboard by logging in remotely to Nexus Dashboard, allowing for efficient monitoring and management of multicluster networks from a single screen. Users can also launch detailed views of any fabrics residing in any NDFC cluster from this screen.
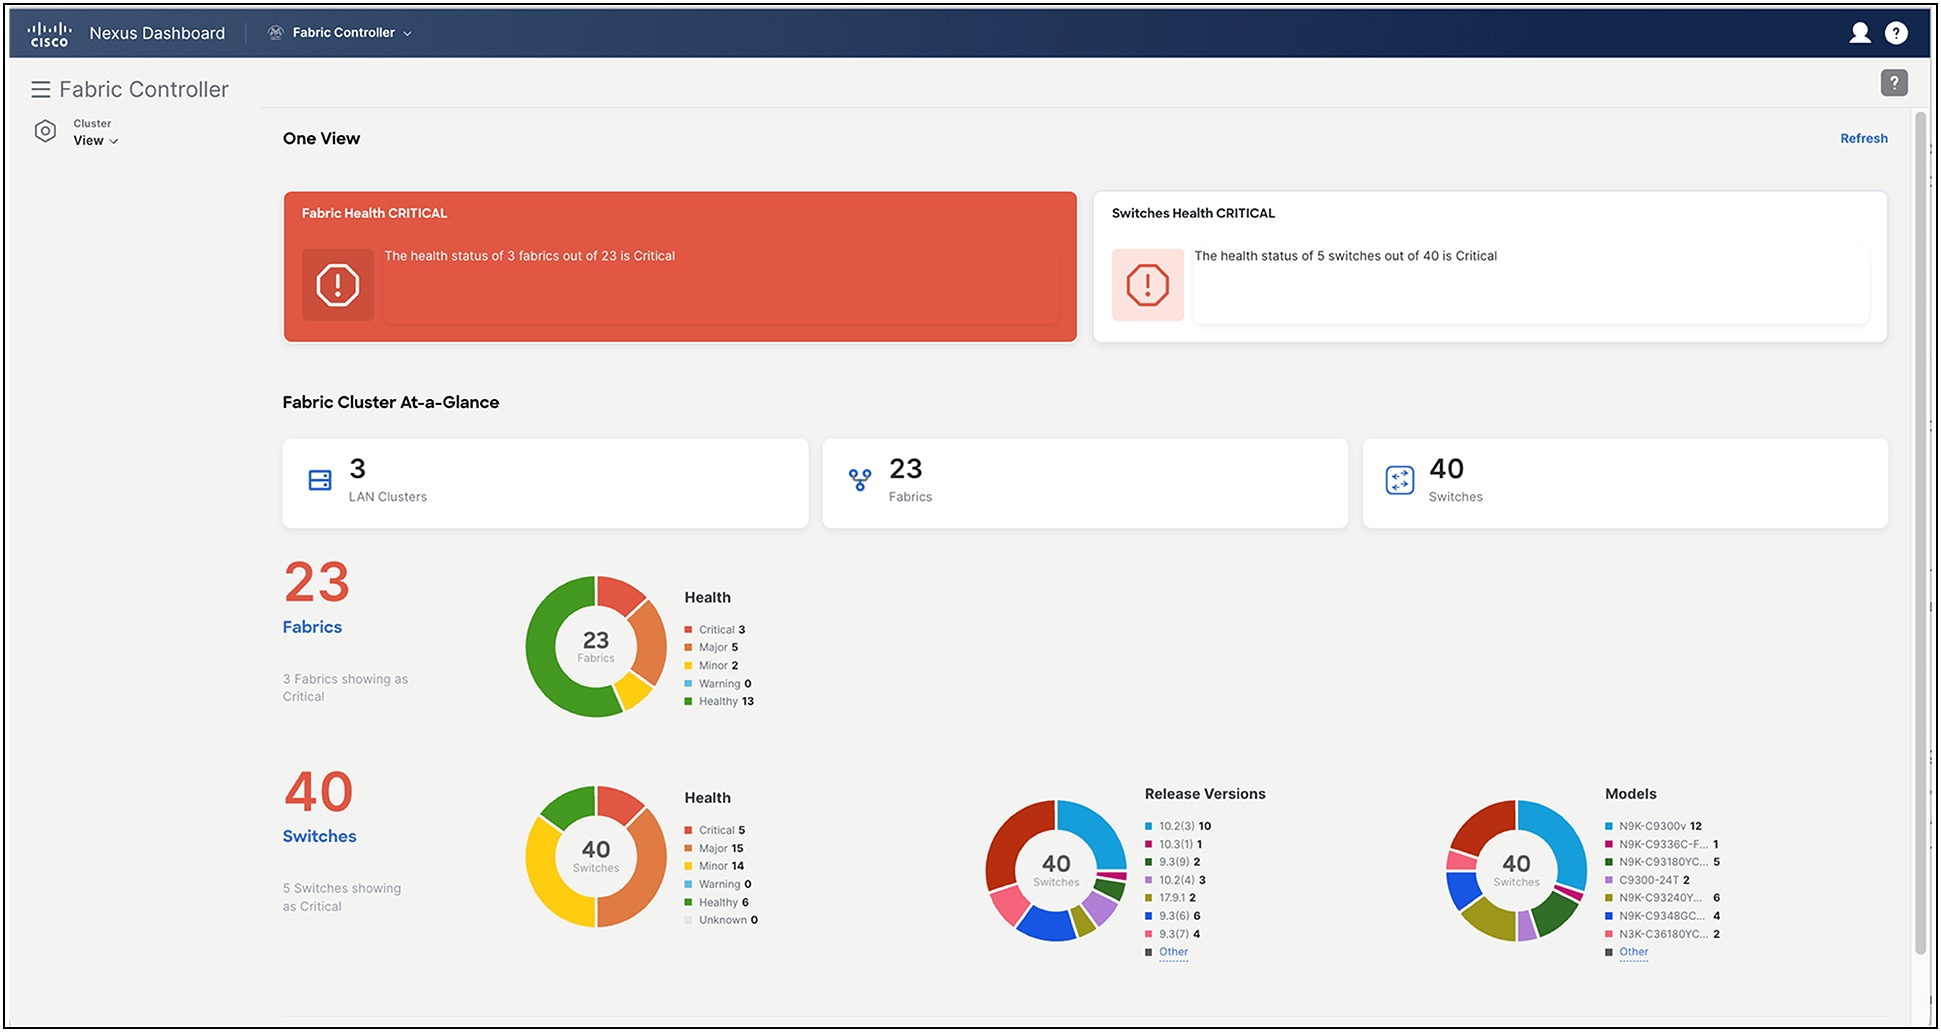
NDFC LAN Controller All Cluster Dashboard
Microsegmentation using VXLAN Group Policy objects
Microsegmentation using the VXLAN Group Policy Option (GPO) utilizes security group policies to create a simplified approach to understanding and controlling your network traffic. This feature allows users to classify endpoints by IP, VLAN, and VM attributes to create security groups and remove endpoints from security groups as necessary. The policies are pushed to the switches by NDFC, and traffic is segmented based on whether the selected attributes match on the switch. Additionally, users will be able to create new fabrics with VXLAN GPO enforced across multiple sites. All your security groups, policies, and contracts can easily be managed from a single pane in the "Security" tab of NDFC. With microsegmentation using group policy, you now have greater flexibility in choosing attributes to craft policies that segment your network according to your architecture's logic. Additionally, using VXLAN GPO enables the ability to segment east-west traffic, minimize threat vulnerabilities by creating a smaller attack surface, allow for flexible security isolation, and, overall, improve the security posture of your VXLAN fabrics.
L4-L7 service insertion, service chaining, and load balancing
L4-L7 service insertion, service chaining, and load balancing enables the ability to insert and redirect traffic to service devices in a data-center fabric. The service devices can sit in the same VXLAN EVPN fabric, and an external fabric is not necessary. You can add an L4-L7 service cluster, create service function between the L4-L7 service cluster and the L4-L7 service leaf switch, and then selectively redirect traffic to these L4-L7 service clusters. NDFC effortlessly manages the switches and interfaces attached to a service cluster. L4-L7 service insertion can be easily enabled by editing a fabric and in the advanced settings, enabling L4-L7 services redirection. Furthermore, support is available for enhanced Policy-Based Redirection (ePBR) used for L4-L7 service load-balancing and single-site traffic steering and redirection. ePBR utilizes a policy-based redirect solution to direct traffic and facilitate application-based routing. It also enables service chaining within and across fabrics. This feature delivers a simplified and automated workflow to onboard service nodes and redirects traffic to them. Additionally, it ensures that network security requirements are met with built-in compliance.
Change control management
The new change control management feature (starting with NDFC Release 12.1(3)) enables tracking and approval of network intent changes. It associates unique tickets with specific actions, allowing deployment operations to occur only through these change control tickets, ensuring a controlled and auditable process. This feature streamlines network configuration changes by enforcing a structured approval workflow, enhancing operational control and compliance.
Fabric software management
Large networks need to be maintained efficiently. NDFC will have fully redesigned image management, making upgrades easy and less time-consuming. This new, easy, and customizable workflow will be for device upgrades and downgrades, patching, Electronic Programmable Logic Device Upgrades (EPLDs), Software Maintenance Updates (SMUs), and more. NDFC can recommend or create groups for switch upgrades, allowing users to track the upgrade of switches in a fabric in a more controlled way than previously. Users can either use the groups suggested by NDFC, or they can create their own groups, based on user roles, switch roles, type of switches, etc. NDFC will continue to support maintenance-mode and RMA actions right on the actual topology display – you can put a switch into maintenance mode and swap serial numbers with a replacement unit with a few clicks.
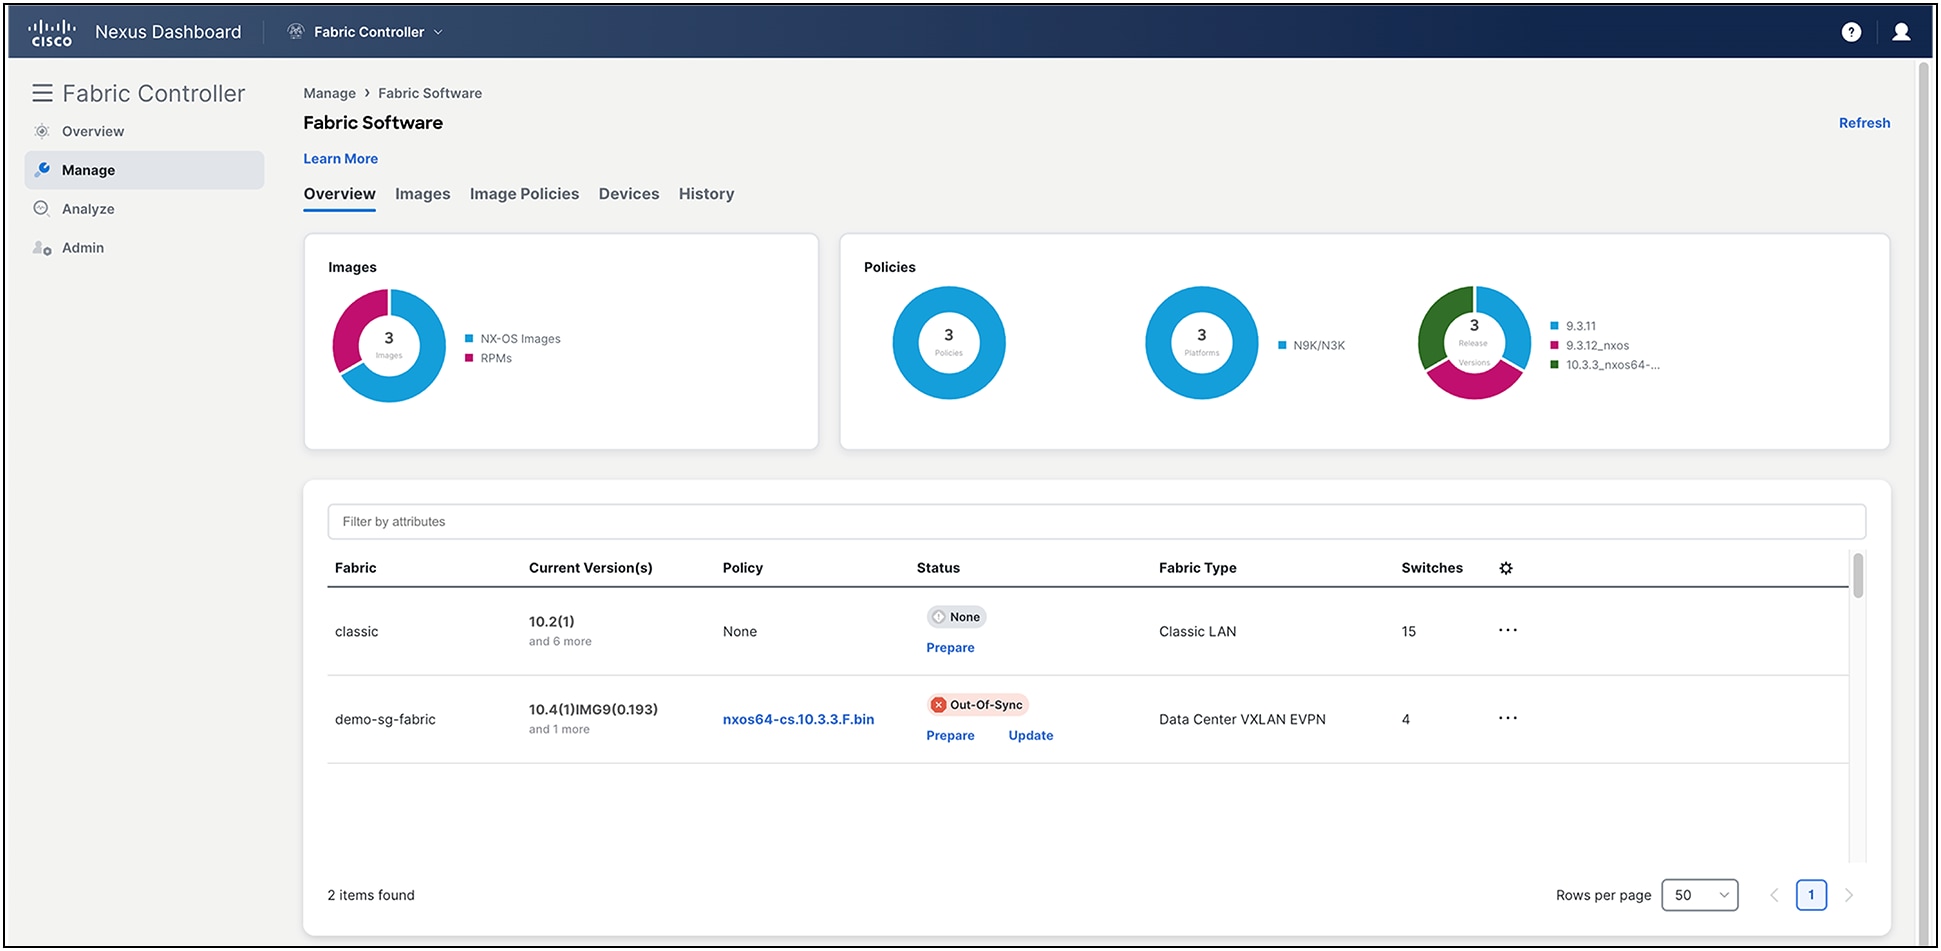
NDFC fabric software management
Git repository integration
The addition of this feature allows users to seamlessly integrate their Git repository with NDFC, enabling synchronization for nondefault templates. This feature facilitates external nondefault template modifications, ensuring a streamlined process as changes are pulled into NDFC and deployed across fabrics. You can also push any template updates back to the Git repository, as needed. Network administrators benefit from this enhanced flexibility, particularly in managing scaled environments with multiple NDFC instances, allowing them to leverage uniform templates across their network infrastructure effortlessly.
Quantum key distribution for MACsec through SKIP protocol
Cisco Secure Key Integration Protocol (SKIP) is supported in your Nexus switches and empowers establishing communication with QKD devices and utilizing these devices in the exchange of MACSec encryption keys used for inter-fabric connectivity. NDFC now automates the configuration of quantum keys that are used to connect two fabrics using inter-fabric links for data- center VXLAN EVPN, enhanced classic LAN, and external connectivity network. Experience the benefits of using a QKD server to manage MACsec keys, such as auto key management and auto key refresh, ultimately making the traffic quantum more secure.
Compute visibility on fabric topology view
NDFC integrates VMware topology onto its dynamic topology views. You simply “Discover” a vCenter that controls the host-based networking on the fabric to show how the virtual machine, host, and virtual switches are interconnected. This is a great benefit for the network operator because it provides compute visibility, which is ordinarily the purview of compute administration.
Cisco Smart Licensing Policy
Implementation of Cisco Smart Licensing Policy (SLP) with NDFC will further enhance the current smart licensing capabilities. SLP aims to increase ease of use by enforcing fewer restrictions with a goal of reducing the overall license friction.
Non-Nexus Platform Support: IOS-XE and IOS-XR
For Cisco IOS® XE platform Cisco Catalyst® 9000 Series Switches, NDFC will now support VXLAN EVPN automation. Using this new fabric-builder template with built-in best practices, you can extend your VXLAN EVPN overlay networks for greenfield deployments of Catalyst 9000 switches.
NDFC will also provide additional support for Cisco IOS® XR devices, Cisco ASR 9000 Series, and Cisco Network Convergence (NCS) 5500 Series, to be managed in external fabric in managed mode. NDFC will be able to generate and push configurations to these switches, and configuration compliance will also be enabled for these platforms.
Granular Role-Based Access Control (RBAC) model for existing roles
With NDFC, RBAC will be orchestrated directly in the Nexus Dashboard. NDFC offers granular RBAC roles, allowing users to have varying levels of access across different fabrics within the NDFC instance. For example, one user could be a network administrator for one fabric while being a network stager for another. The latest NDFC release supports new user roles such as change approver and change deployer in addition to the existing roles, to facilitate change control management.
Programmable reports for performance monitoring
NDFC previously introduced programmable reports, which provided detailed information on devices. A new template will be added to support NDFC to generate these programmable reports for performance monitoring. These reports can be used for LAN, IPFM, and SAN deployments. You will also be able to email these generated reports to users.
Multitenancy VRF
With this feature, we are bringing in VRF support for Non-Blocking Multicast (NBM) deployments where we can logically isolate multiple customers so that they can co-exist on the same fabric. Multiple VRFs can be enabled in either an IPFM NBM active or NBM passive mode.
Fabric builder for IPFM
To ease your IPFM network provisioning, NDFC will now start supporting availability of preconfigured policy templates that were created keeping best practices in mind – to build your IPFM underlay in minutes.
Cat9k Provisioning in IPFM Fabric: NDFC serves as a single control point, simplifying operation and management for hybrid Cat9k and Nexus9k IPFM Fabrics. Provision your Cat9k devices with NDFC.
ST 2022-7 Fabric Redundancy Visualization with NDFC: In NDFC, will enhance visibility into SMPTE 2022-7 fabrics by providing a side-by-side view of the red and blue fabrics so enabling operators to monitor both network paths in tandem, ensuring a seamless flow of content.
NDFC SAN Insights brings SAN Analytics to life
One of NDFC’s most important features is SAN Insights, which provide collection and visualization of the MDS SAN Analytics capabilities. This feature provides insight into end-to-end flow-based metrics, custom graphing, outlier detection, ECT analysis, summary dashboards, and the newest feature: anomaly detection. Anomaly detection provides a fully customizable infrastructure that can be used to identify and alert on issues captured by the SAN Insights capabilities. SAN Insights also include new infrastructure to help consume all the new streaming telemetry data available on the new 64Gbps and 32Gbps MDS switches from Cisco.
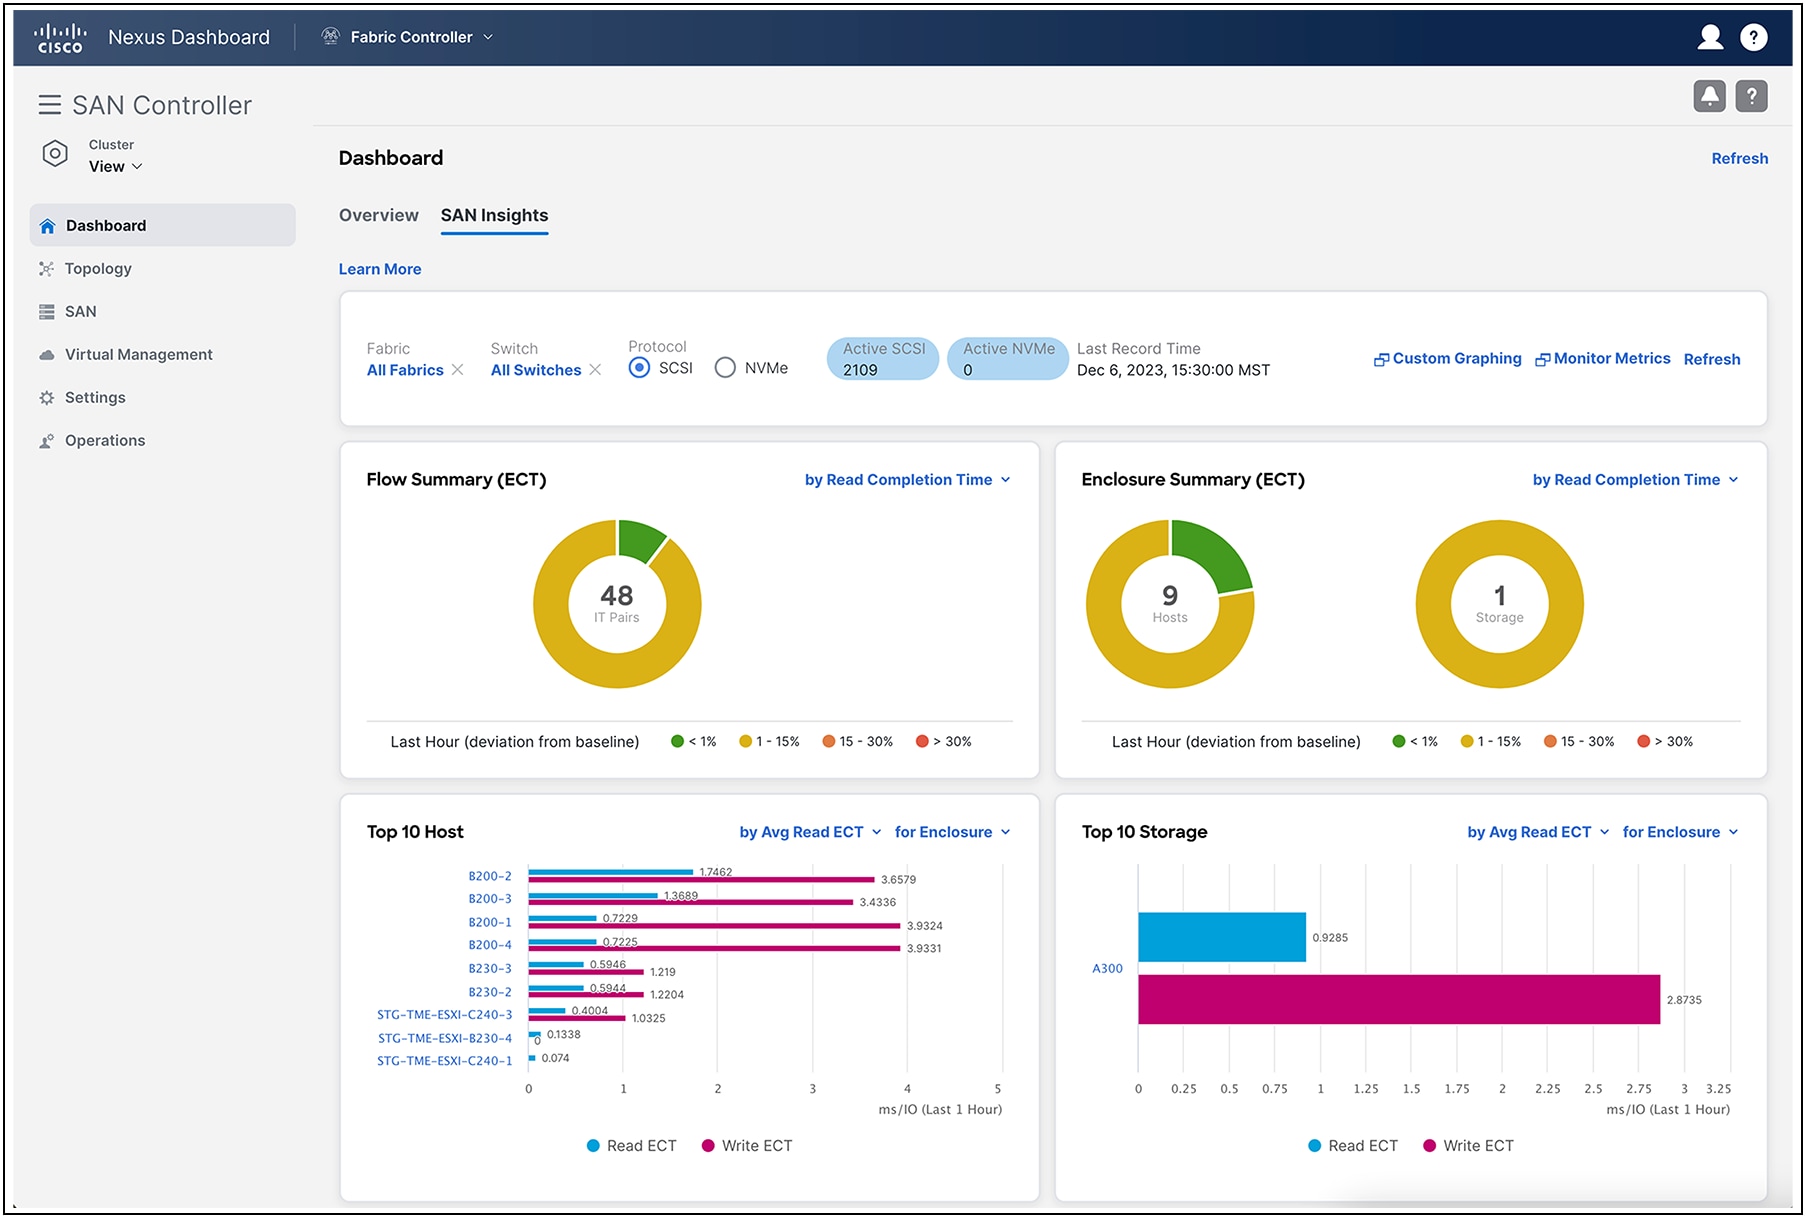
NDFC SAN insights dashboard
NDFC SAN Controller OneView
NDFC SAN Controller OneView is a new feature that provides a single pane of glass to get a holistic view of the larger enterprise from within NDFC. This view will provide high-level summary information about all the managed fabrics from within NDFC. This manager-of-managers view is critical for successful management of multisite deployments and comes at no additional cost. The functionality also provides native click-through capabilities so that the end user can explore that site in more detail to further enhance management and troubleshooting operations.
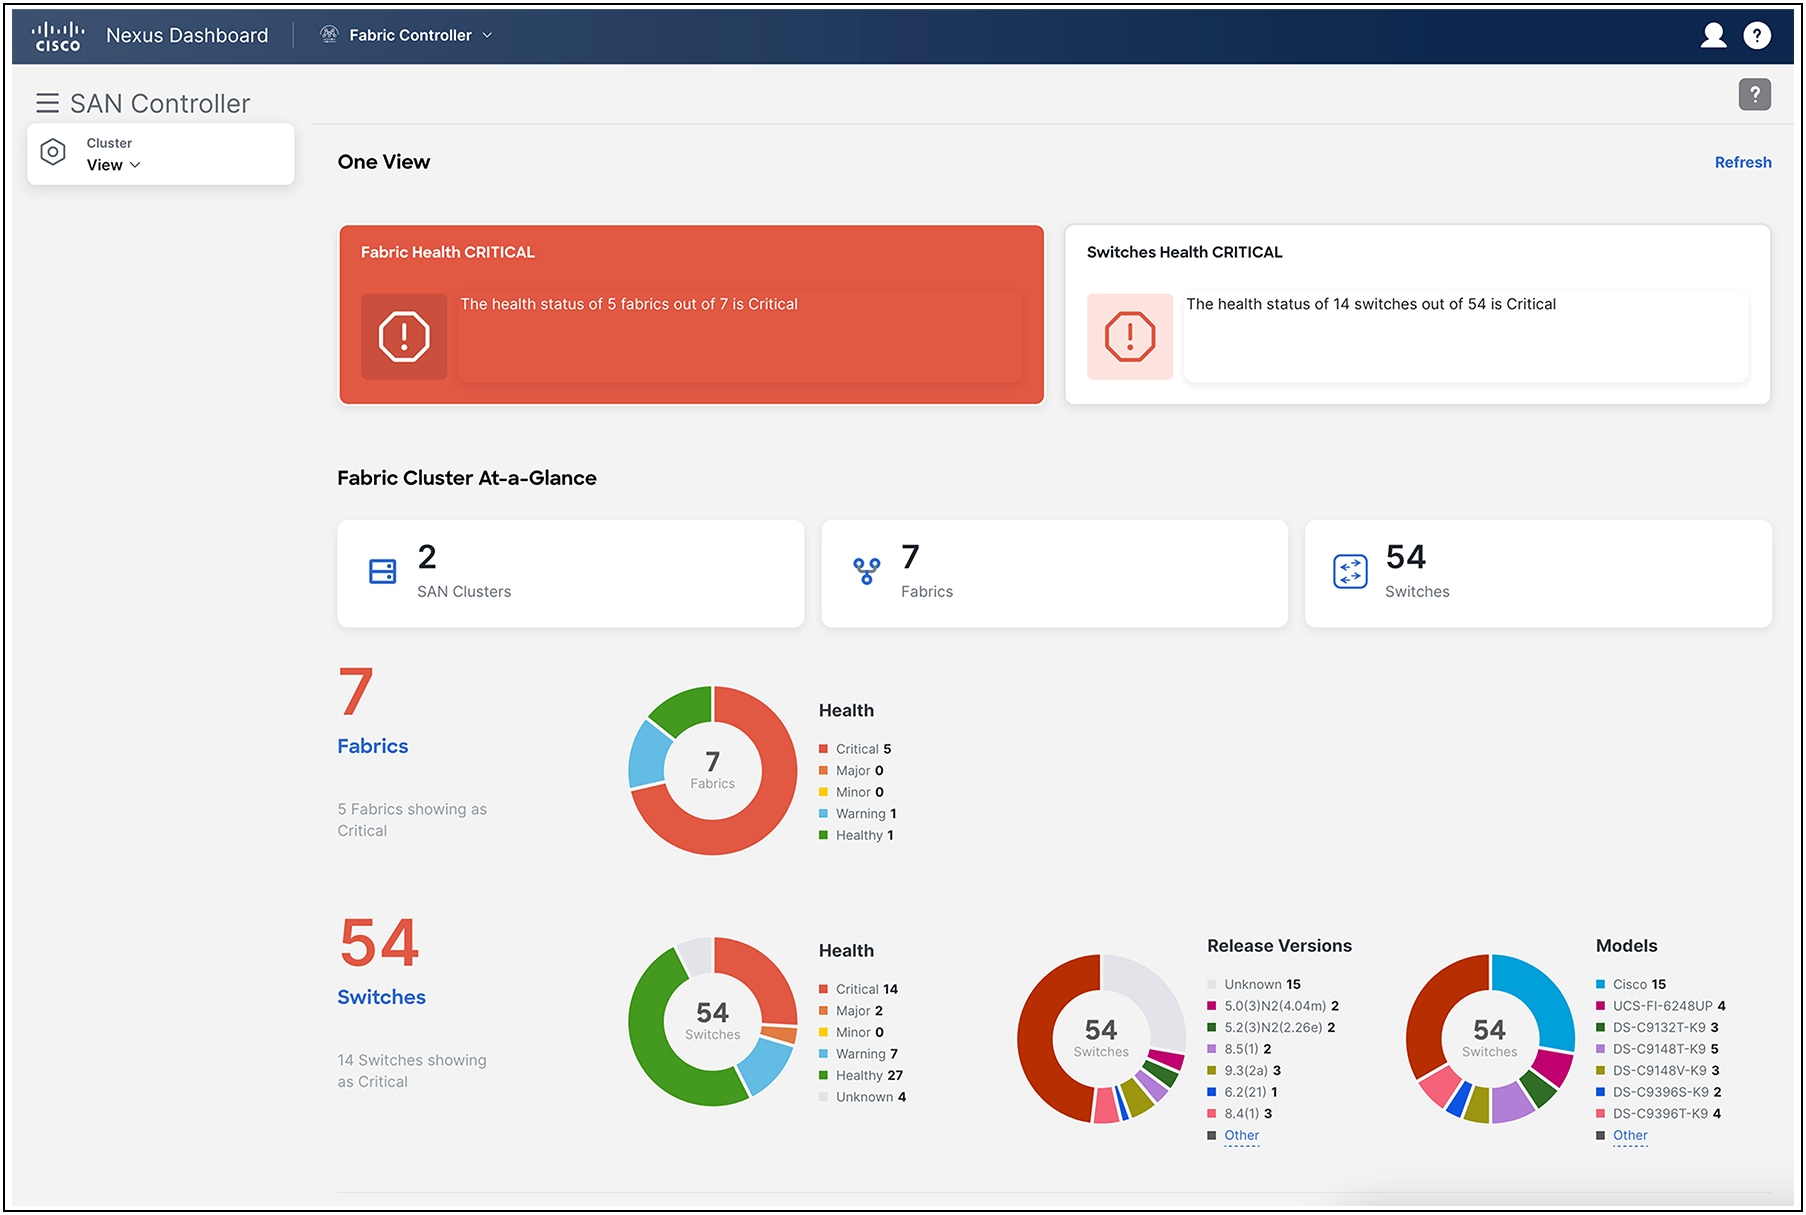
NDFC SAN Controller OneView
Host and storage views
NDFC introduces a new interface that allows customers to see host and storage devices connected to the fabrics they manage. In these new views the user is provided end-device-specific information that can be used to understand pathing health, optics trends, SAN analytics metrics, events, diagnostics data, errors, driver and HBA firmware versions, and much more. This data is provided within the context of the host or storage device the administrator chooses to explore. This view also allows the administrators to view in depth virtual machine information and can now track virtual machine analytics metrics, CPU/Mem utilization, and disk I/O data as well. This is a powerful feature that will make managing connected devices even easier; it provides a wealth of information to help understand overall host and storage health, with a single interface into all of the relevant information.
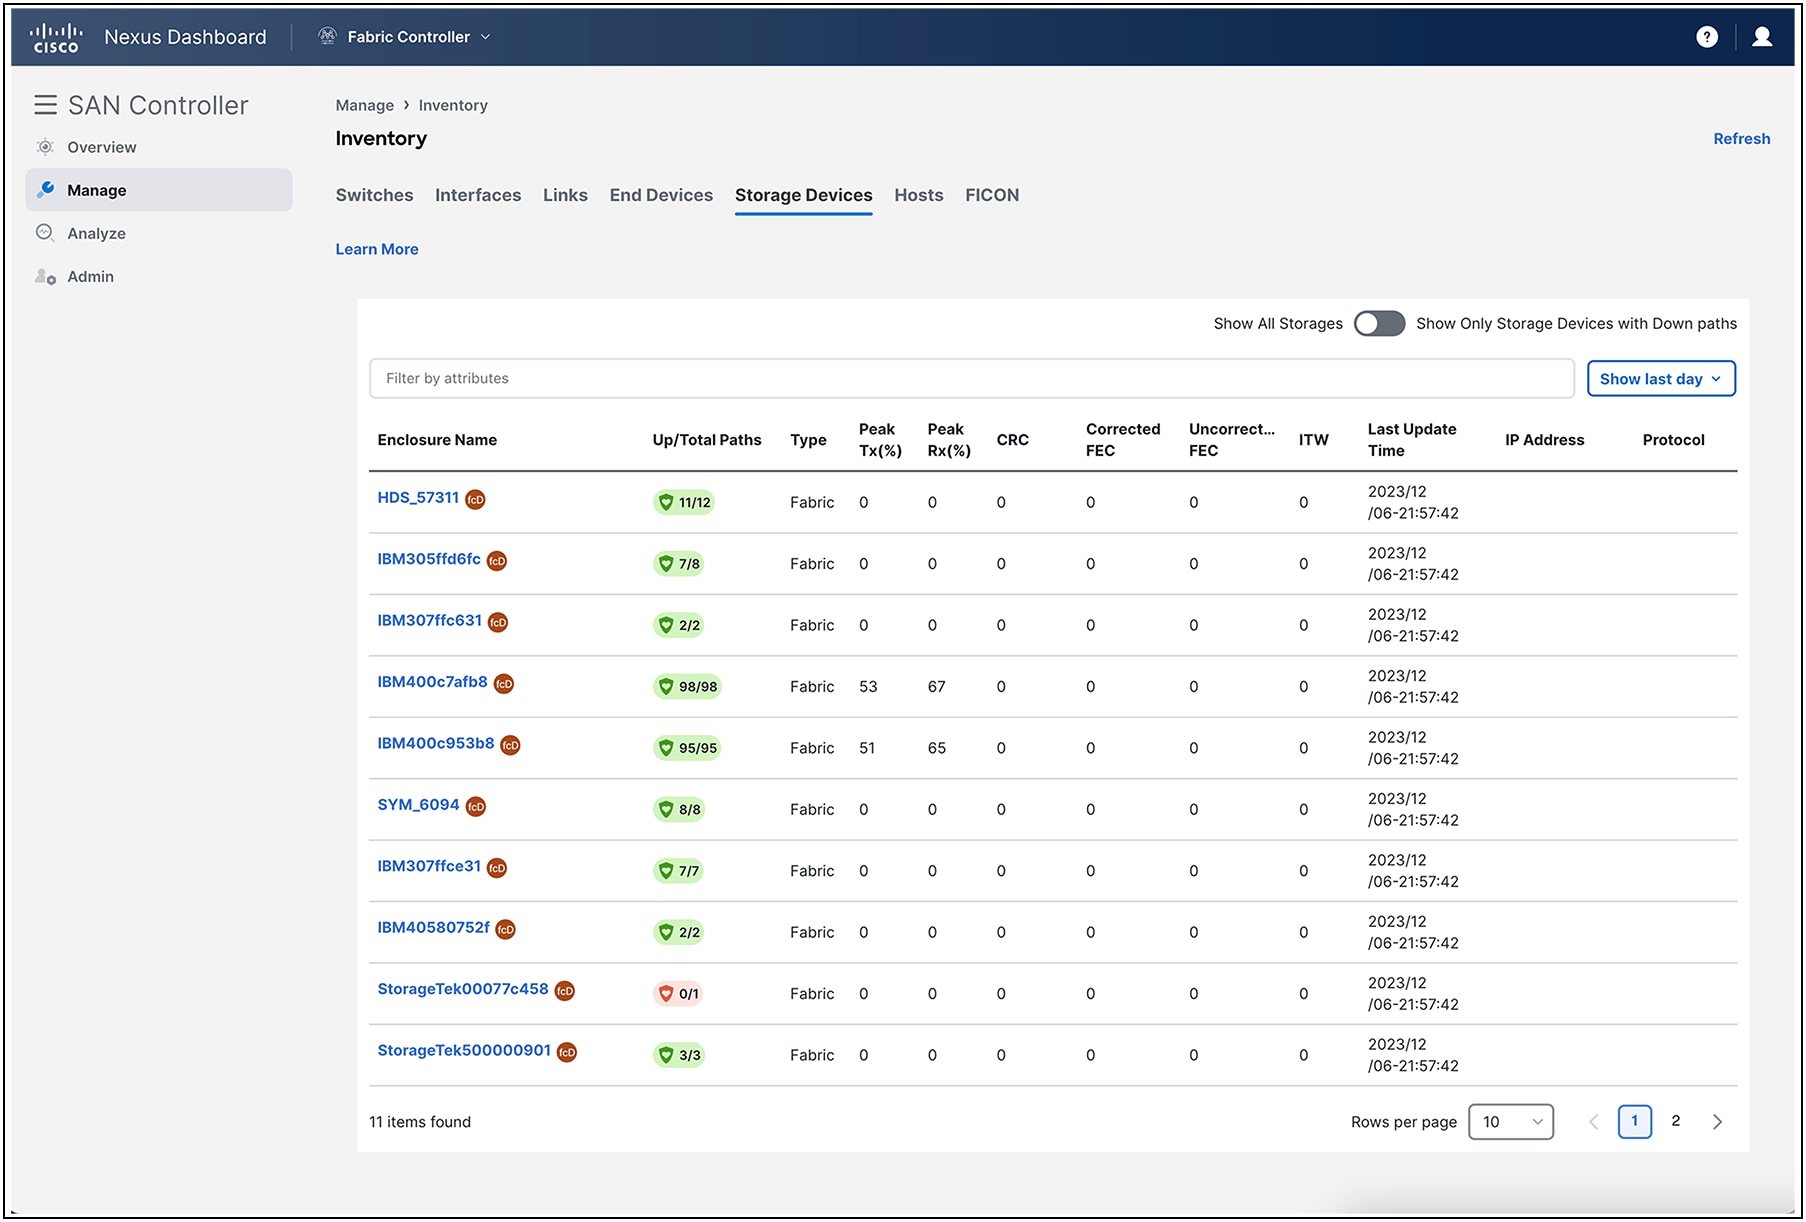
NDFC SAN Controller host and storage views
Dynamic Ingress Rate Limiting
NDFC also plays an important part in integrating some of the most modern software features Cisco has created to help eliminate congestion in SAN fabrics. NDFC provides an interface to fully configure Dynamic Ingress Rate Limiting (DIRL) so that any congestion in the fabric can be eliminated automatically and with almost no impact. DIRL can help with both credit starvation and over-utilization situations that can have big implications on the SAN fabric by controlling the rate of frames from the anomaly in the fabric while at the same time reducing the impact to operations. NDFC plays an important role in helping to simplify the deployment of DIRL so that it can be implemented quickly to easily to solve slow-drain conditions.
Optics information for SAN interfaces
NDFC introduces a new interface that allows customers to see trends in optics temperature and power over time. This new feature provides insight into how optics are working overtime and can help reduce individual outages that are often due to optics failures.
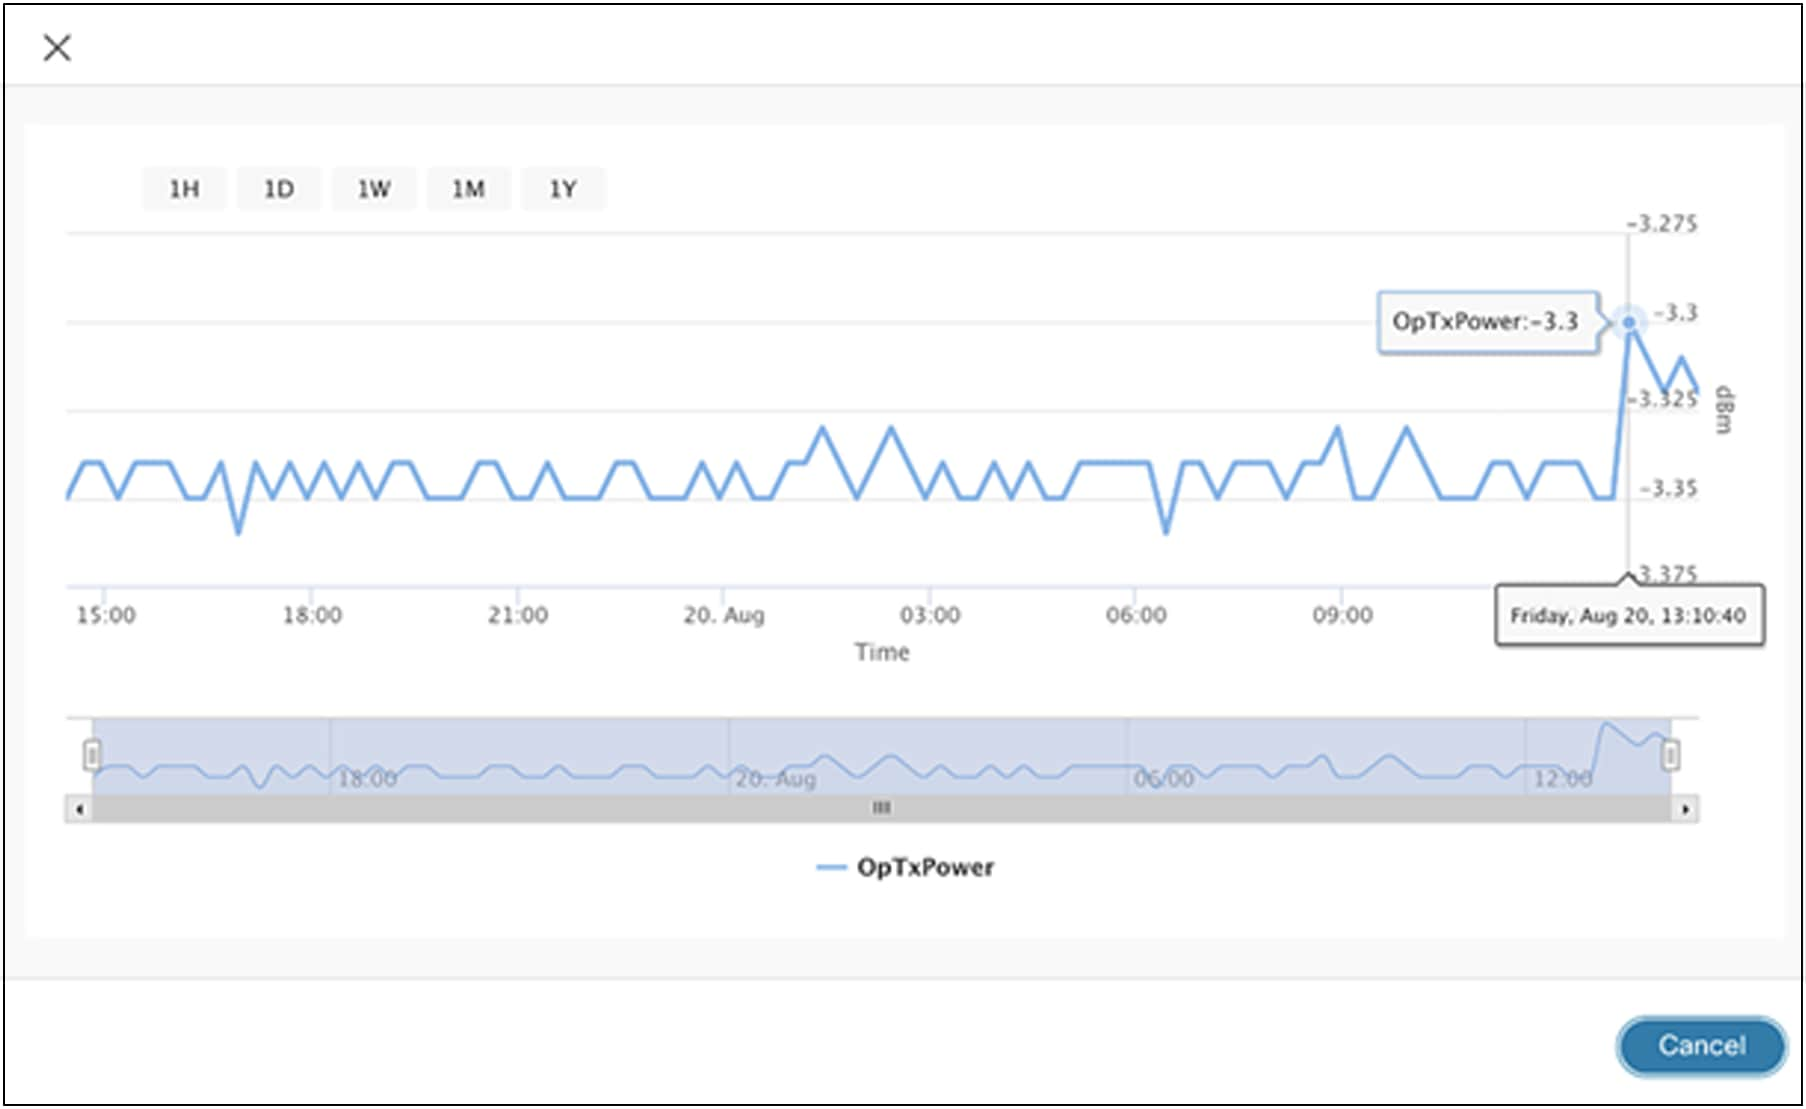
NDFC SAN Controller – optics insights
Zoning interface
NDFC has reinvented the way customers will do SAN zoning in the future. This includes a new interface in the web-user interface that focuses on managing regular and IVR zones. This is a feature many customers use every day, and Cisco has worked to improve the look, feel, and navigation of the zoning interface to make the data easier to use and faster to deploy correctly.
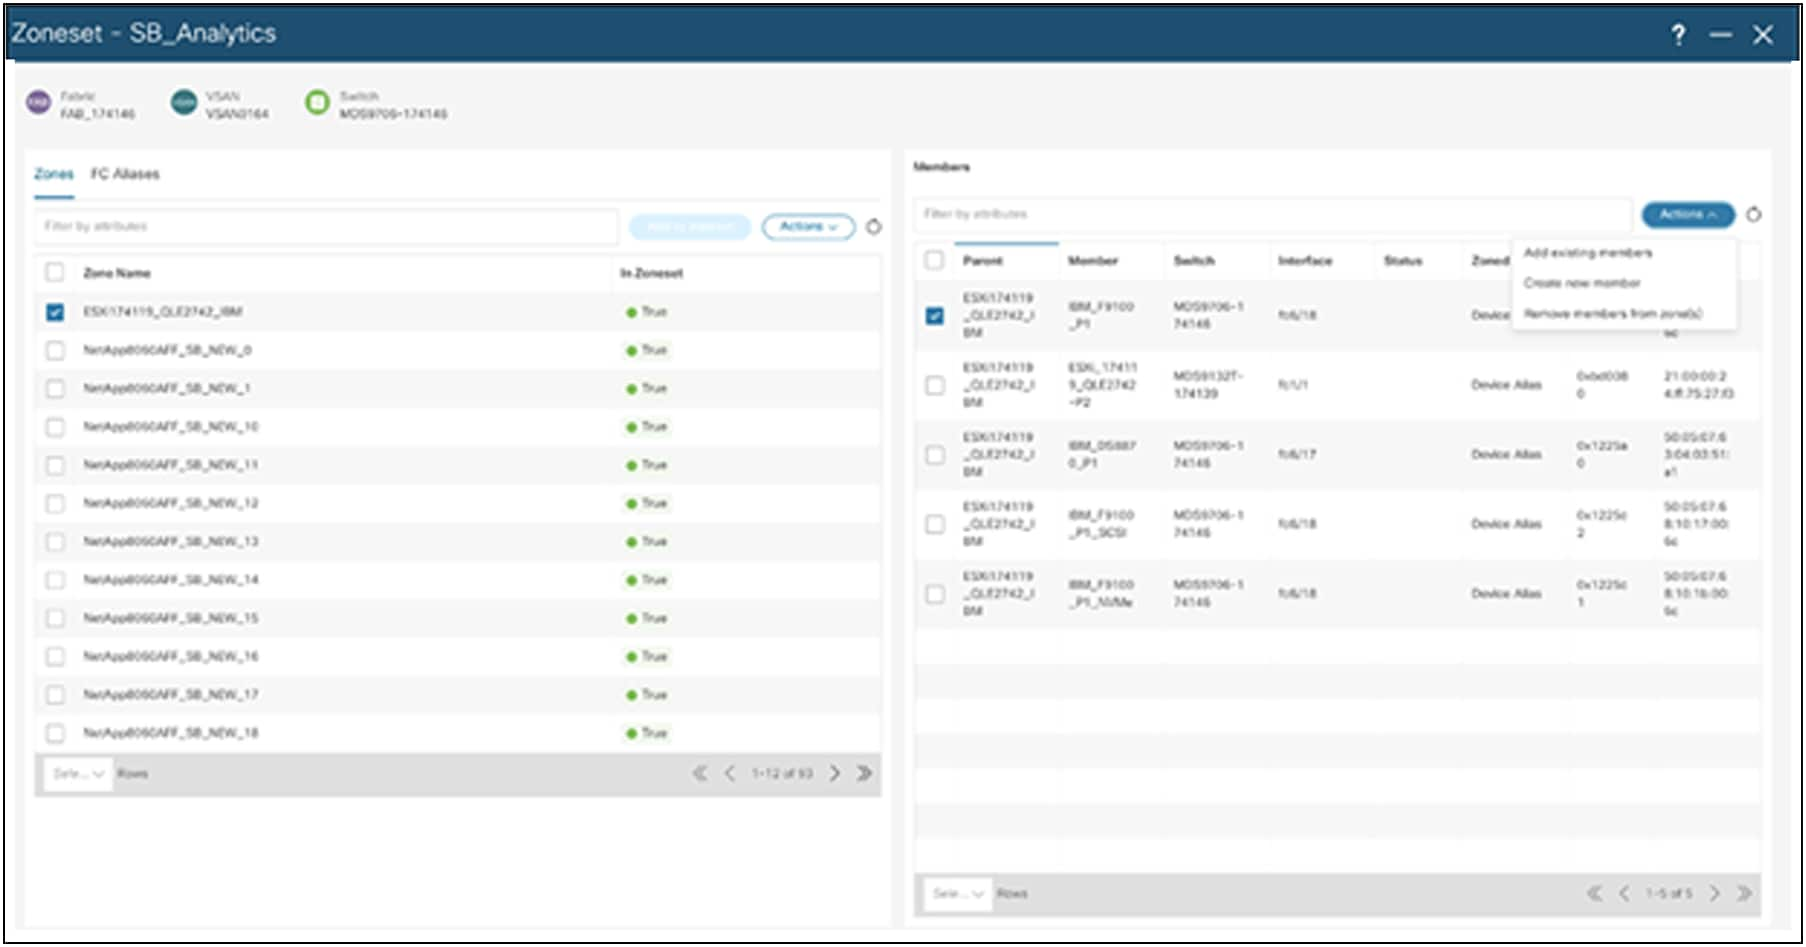
Zoning interface
The optics health predictions provided in previous releases are enhanced in the new release, where NDFC displays a unique health score for each optics parameter. This health grade lets customers see when optics have moved from healthy to warning, to critical. Voltage, current, Rx power, Tx power, and temperature are each graded by the system; when a change occurs, Nexus Dashboard displays the change and includes an alarm that can be forwarded to an SNMP trap recipient, to get ahead of potential outages due to optics failures. This capability can also display a chart of the monitored parameters, so that the user can see which values have changed vis-à-vis those of the other parameters.

Optics Health Prediction
Topology utilization visualization
A new capability has been added that displays the performance of the Fibre Channel links; it also includes path visualization that indicates traffic speed by using hash marks on the link moving in the direction of the traffic flow. This capability also indicates the speed of the link, using a color-coded overlay on the link. Both items greatly improve visualization of the links and help reduce the time troubleshooting link performance.
NDFC feature details and benefits
Table 1. NDFC features and benefits
| Feature |
Benefits |
| Infrastructure and GUI |
● Modular, microservices-based architecture to enable scale-out models
● React JS–based UI to simplify and enhance GUI interactions
● Supports active/active high availability for either LAN or SAN deployments
● All cluster view dashboard for LAN fabrics across multiple NDFC clusters
● Includes runtime feature manager for LAN, SAN, and IPFM deployments
● Journey map to guide users across different NDFC milestones.
● User feedback tool integration to allow users to submit feedback/requests to be reviewed by product team
|
| Dashboards |
● Provides last-24-hours summary of events and top “talkers”
● Offers custom summary view of LAN and SAN domains and topology groups
● Provides host, switch, and fabric dashboards and provides views of configurations, control, events, and traffic and context-based searches from dashboards
● Brings the NDFC computing dashboard into the VMware vCenter for dependency mapping and inventory, performance, configuration, and event views
|
| Customizable templates |
● Includes best-practice policy templates with Python support and built-in compliance checking for fabric builder
● Provides prebuilt templates for classic LAN mode provisioning
● Allows creation of new customizable templates using template editor
● Allows import and conversion of configuration scripts to templates
|
| REST and JavaScript Object Notation (JSON) API |
● All northbound APIs are REST. NDFC’s GUI uses these REST APIs for all GUI functions.
● Includes self-documented “swagger”-style built-in documentation, with examples
● Enables integration with third-party or custom orchestration and automation tools like Ansible
|
| Automation for classic Layer2/Layer3 networks |
● New enhanced classic LAN fabric, to provide fully automated workflows for any classic Layer2/Layer3 deployments
● Includes intuitive fabric management with built-in best practices and maximum visibility
● Supports configuration compliance
|
| Configuration and change management for classic LAN Mode |
● Provides predeployment validation of configuration changes to help reduce human errors (POAP includes this feature as well.)
● Provides a general configuration archive to track changes, allowing rollback to a last-known good state
● Provides capability to back up configuration files from all switches for classic LAN-mode operations
● Brownfield host port interface configuration sync-up capability supports resync of out-of-band host port configurations to NDFC
|
| Fabric software |
● Includes support for Cisco In-Service Switch Upgrade (ISSU), Graceful Insertion and Removal (GIR) and Return Material Authorization (RMA) functions
● Includes installation/uninstallation of SMUs and RPMs for Cisco Nexus platforms
● Supports NX-OS image and EPLD Installation and upgrades from the GUI
|
| LAN fabric with VXLAN EVPN |
|
| Fabric control and overlay visibility and management |
● Provides fabric management for multiple types of LAN solutions, including VXLAN-EVPN, and traditional 3-tier LAN deployments with workflows for provisioning LAN services such as VPCs
● Microsegmentation for VXLAN EVPN fabrics using security groups in both single-site and multi-site use cases
● Includes intuitive overlay management with built-in best practices and maximum visibility for robust Cisco NX-OS configuration profiles
● Autodetects unprovisioned switches for use in fabric builder with day-0 POAP for policy-based bootstrapping of fabric infrastructure
● Compliance management ensures that network is in sync with intended deployment and notifies users when out of compliance, allowing users to deploy any corrections
● Supports easy provisioning using interface groups. Attaches overlay networks to groups in one go, allowing new interfaces added to the group to automatically inherit the configuration.
● Integration with Nexus Dashboard Orchestrator (NDO) to extend overlay networks or VRFs between VXLAN-EVPN fabrics managed by different NDFC instances
● Support for overlay network and VRF provisioning using CLI
● Load balance and service chain across cluster of service nodes using enhanced L4-L7 workflows
● One Manage for Multi-cluster NDFC deployments
|
| Unified topology views and control |
● Presents topology views showing physical and overlay networks on the same page, helping IT administrators quickly identify the extent of virtual overlay networks on a programmable fabric
● In topology view, shows VXLAN details, VXLAN Tunnel Endpoint (VTEP) status, and VXLAN Network Identifier (VNI) status on a per-switch basis
● Presents smart topology views showing virtual port channels (vPCs) and virtual device contexts for Cisco Nexus networks (Topology views include VXLAN search.)
● Zoom in and out and search in a site
|
| Role-Based Access Control (RBAC) for fabric objects |
● Allows Role-Based Access Control (RBAC) within the fabric to separate administrative tasks between functional domains
● Granularized RBAC model supports the same user having different roles across different fabrics
|
| IP Fabric for Media (IPFM) |
|
| Flow control |
● Flow and host policy manager
|
| Visualization and health |
● Topology and endpoint visibility.
● One View dashboard for IPFM fabrics
● End-to-end flow visualization.
● Network health monitoring.
● RTP and EDI flow monitoring
● 2022-7 Side by Side View: end-to-end flow visibility for Red and Blue fabrics within same instance of NDFC
|
| Provisioning and automation |
● Fabric bootstrap: day-0 provisioning.
● API gateway for broadcast controller.
● Fabric builder for IPFM underlay network with nonblocking multicast
|
| Storage Networking (SAN) |
|
| SAN Analytics integration with Cisco SAN Insights |
● Provides SAN Analytics visualization at scale, providing a single pane of glass into hundreds of thousands of FC flows
● SAN Insights anomaly detection can find real-world issues and send alerts in real time
● Fully customizable infrastructure to create and manage SAN Insights events
● Always on and auto-learned approach for all FC flows
|
| Storage topology and visibility |
● Switch, end device, VSAN, and zoning visualization on the topology maps
● Allows you to see trends and explore link bandwidth straight from the topology map
● Health color coding to quickly find and troubleshoot issues
● Device manager integration for all switches in the topology
● Storage and host visualization on the topology map
|
| SAN zoning |
● Totally redesigned web-based zoning interface to drastically reduce the cycle time for common administration tasks. Provides IVR zoning function as well, on the same page.
● Provides a web-based FC and device-alias configuration to ease transition to a web-based user interface for zoning and other management tasks
|
| Automated analysis |
● SAN host-path-redundancy feature to better organize and identify virtual and physical hosts with path-redundancy problems in the fabric
● Slow-drain analysis features to increase efficiency and reduce the time to discovery for slow-drain devices
|
| Storage management |
● Provides visibility into all modern storage products to help provide information to storage administrators in the context of SAN management
● Port channel and VSAN management updated
● FICON management
|
| Visibility, monitoring, and troubleshooting (common features) |
|
| Automated discovery |
● Using automated network discovery provides up-to-date physical and logical inventory information.
● Tracks inventory and performance information in real time
|
| Topology overlays and views |
● Provides detailed visibility into real-time and historical performance statistics in the data center.
● In topology views, link-layer and overlay status details alongside switch details to aid troubleshooting and visibility.
● Provides general visibility into Layer-2 network connectivity mapped on the physical topology view
● Provides topology, configuration, and information for virtual machines, port groups, DVS/vSwitches, vNICs, and VMNICs correlated with the physical network topology
● Provides insight into port and bandwidth use, error count, traffic statistics, etc.
|
| Event management, reports, and alarms |
● Provides real-time network-health summary with detailed views of individual network components, enabling operations staff to respond quickly to events based on event severity
● Alarm function provides stateful alarm monitoring to show if an error condition is active. Users can define an alarm policy for the device, interface, or syslog conditions and can email alarms to users.
● Provides easy-to-schedule reports using predefined templates, including inventory, use, health, and performance monitoring reports. These reports can be exported for postprocessing or sent by email.
● Allows creation of custom port groups based on priority and severity level of the application and implementation of rule-based event-forwarding to notify the system or user of traps and syslog messages generated for the custom port group
|
Table 2. Platform support information
| Product family |
Platforms supported |
| Cisco Nexus switches |
Cisco NDFC supports most current Nexus switch family product offerings. See the Compatibility Matrix and Release Notes for NDFC Release details. |
| Cisco MDS storage switches |
Cisco NDFC supports most current MDS switch family product offerings. See the Compatibility Matrix and Release Notes for NDFC Release details. |
Cisco NDFC Release 12 runs on the Nexus Dashboard platform. It is supported on:
● Virtual Nexus Dashboard for LAN, IPFM, and SAN deployments
● Physical Nexus Dashboard for LAN, IPFM, and SAN deployments
The table below lists the server resource requirements for deploying the Nexus Dashboard Fabric Controller Release 12 on Nexus Dashboard.
Table 3. Server requirements
| Mode |
Virtual ND |
Physical ND |
| LAN |
16vCPUs and 64G RAM, 500G SSD |
40vCPUs and 256G RAM, 4* 2.2 TB HDD, 370G SSD, 1.5 TB NVMe |
| IPFM |
16vCPUs and 64G RAM, 500G SSD |
40vCPUs and 256G RAM, 4* 2.2 TB HDD, 370G SSD, 1.5 TB NVMe |
| SAN |
Small Node: 16vCPUs and 64G RAM, 500G SSD (No SAN Insights) Large Node: 32vCPUs and 128G RAM, 3TB (with SAN Insights) |
40vCPUs and 256G RAM, 4* 2.2 TB HDD, 370G SSD, 1.5 TB NVMe |
To order Cisco Nexus Dashboard Fabric Controller Release 12 licenses, contact your Cisco sales representative. Or access Cisco Commerce at Cisco.com.
Flexible payment solutions to help you achieve your objectives.
Cisco Capital® makes it easier to get the right technology to achieve your objectives, enable business transformation and help you stay competitive. We can help you reduce the total cost of ownership, conserve capital, and accelerate growth. In more than 100 countries, our flexible payment solutions can help you acquire hardware, software, services and complementary third-party equipment in easy, predictable payments. Learn more.
See https://cisco.com/go/ndfc or contact your Cisco sales representative or partner.
| New or Revised Topic |
Described In |
Date |
| Inclusion of enhanced topology image |
August 14 ,2024 |
|
| LAN Fabric One Manage |
August 14 ,2024 |
|
| Inclusion of optics health prediction image |
August 14 ,2024 |
|
| L4-L7 service insertion, service chaining, and load balancing |
August 14 ,2024 |
|
| Quantum key distribution for MACSec through SKIP protocol |
August 14 ,2024 |
|
| Microsegmentation using VXLAN Group Policy objects |
August 14 ,2024 |
|
| ST 2022-7 Fabric Redundancy Visualization with NDFC |
August 14 ,2024 |
|
| Cat9k Provisioning in IPFM fabric |
August 14 ,2024 |
|
| Topology utilization visualization |
August 14 ,2024 |
|
| Optics health prediction |
August 14 ,2024 |