Maximizing the Value of Network Performance Data Beyond Basic KPIs Guide
Available Languages
Bias-Free Language
The documentation set for this product strives to use bias-free language. For the purposes of this documentation set, bias-free is defined as language that does not imply discrimination based on age, disability, gender, racial identity, ethnic identity, sexual orientation, socioeconomic status, and intersectionality. Exceptions may be present in the documentation due to language that is hardcoded in the user interfaces of the product software, language used based on RFP documentation, or language that is used by a referenced third-party product. Learn more about how Cisco is using Inclusive Language.
This guide describes how service providers can leverage network performance data beyond the KPIs that are currently collected.
Because network data is often generated and stored in many separate systems, it can be difficult to get a real-time view of what’s happening and to gain actionable insight. Given the dynamic nature of networks and the challenge for operations, service providers must have an equally dynamic and real-time network performance monitoring solution.
Use this guide to learn how raw siloed network performance data can be enriched to bring value and efficiency to an existing analytics environment. This includes correlating data from multiple sources that can be used to add more value. You’ll also see how to use Cisco Provider Connectivity Assurance (formerly Accedian Skylight) to generate actionable events and insight that can be presented and used flexibly by multiple teams. This ability to use the same data and meet the needs of multiple users translates to operational and capital savings.
You can either continue to work with raw data and wait for the enrichment to happen in the back office, or you can apply data enrichment early in the process for a more real-time and dynamic approach to network performance management.
1.1 End-user definitions and challenges
Different teams have different needs regarding how they view and use network performance data. Everyone should be able to get what they need from a single tool. A key requirement for such a tool is the ability to take network performance data and enrich it to provide valuable insight for multiple user groups. User groups and their challenges are listed below.
Big Data analytics:
● Can I stream “clean” performance data and enriched KPIs into other systems, like Splunk or Hadoop?
● Can I get visibility of network, application, and service impact issues relating to customer experience?
● Can I correlate network operational intelligence with other machine data to improve business processes?
Engineering and planning:
● Is my network performance improving or degrading?
● Can I speed up troubleshooting and detect hidden anomalies?
● How can I use predictive analytics for capacity planning?
● Can I start to automate fixes for known recurring issues?
Operations:
● How can I quickly determine the origin of network and service issues and best address them?
● Can I reduce mean time to identify and resolve?
● How many hours can I save on manual investigations and reporting?
● Is there a way to validate the “sea of green” I get from traditional or legacy visualization tools?
● Can I dig into issues, or are they hidden (leading to “no trouble found”)?
Product:
● Can I test and monitor how services will perform on the network prior to launch?
● How can I find issues before my customers do?
● Is there a way to visualize service performance KPIs, usage behavior, and customer experience?
Customer experience (CX):
● Can I stream “clean” network/service performance data and KPIs directly into end-customer portals?
● Is it possible to get real-time reporting to proactively inform customers and reduce churn?
● Can I correlate network and service performance data with customer data?
2. Performance monitoring with Cisco Provider Connectivity Assurance
To meet the needs of multiple groups, you can customize Provider Connectivity Assurance with open APIs. It is an open platform with APIs that easily integrate with both northbound and southbound systems. This allows you to take advantage of multivendor data beyond the performance KPIs collected by the solution with minimal integration cost.
The northbound interface decouples the interface from the many interfaces and eliminates hard integration by providing RESTful APIs using OpenAPI. It also offers support for both ingesting and exporting data to other higher level systems or platforms.
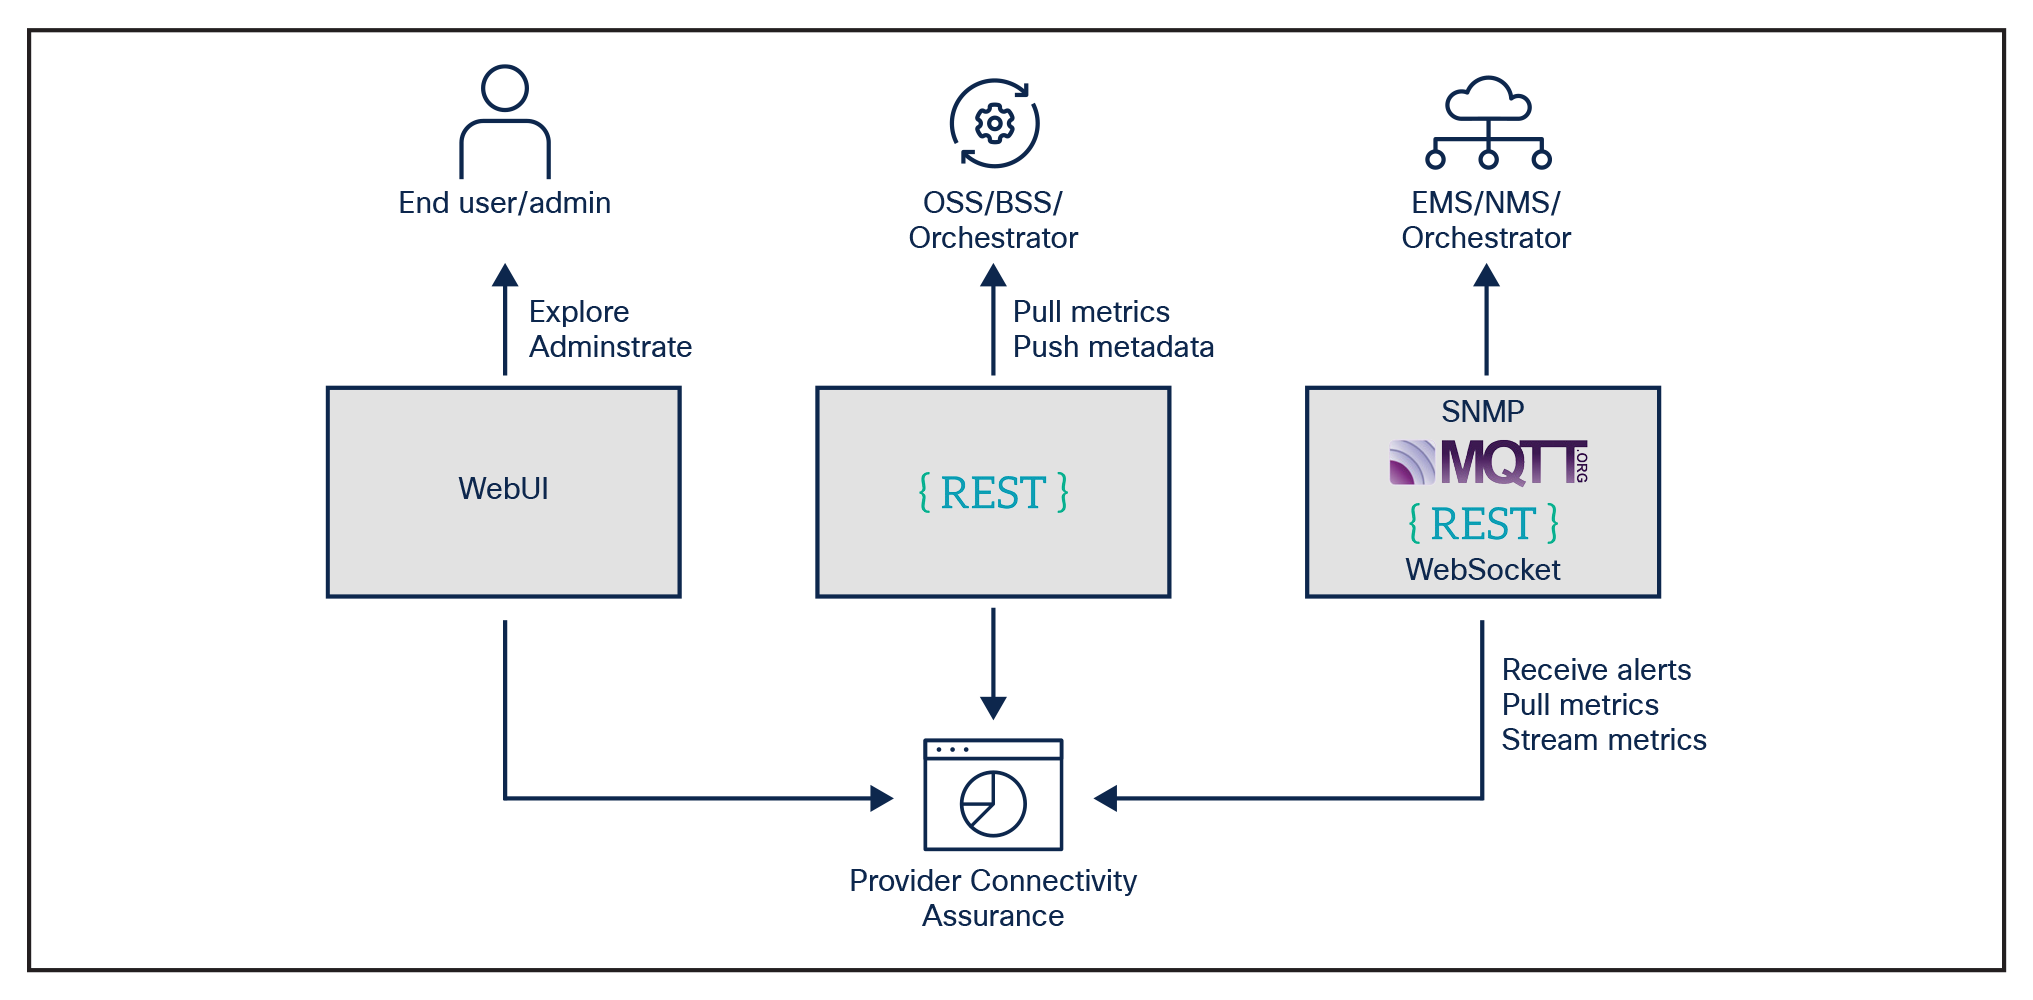
Provider Connectivity Assurance open APIs to northbound systems
The southbound interface decouples data ingestion, eliminating the need for hard integration. It offers a flexible mechanism to ingest data that uses a microservice approach to push or pull data from multiple sources, including third-party sources, and it supports multiple technologies, including SNMP, CSV, API, and gNMI.
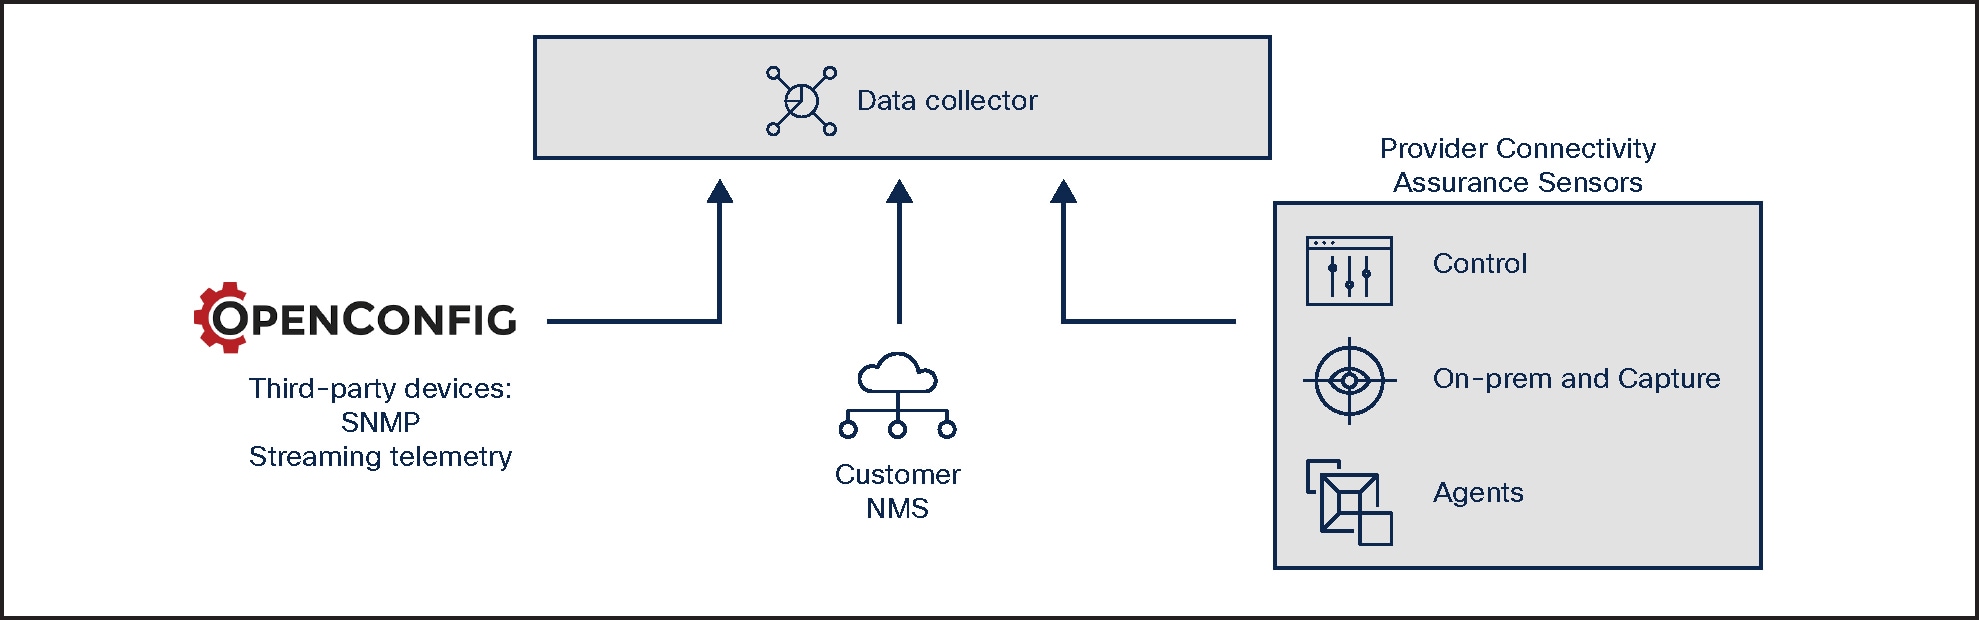
Provider Connectivity Assurance open APIs to southbound systems
As shown in Figure 3, Provider Connectivity Assurance can be integrated into data architectures, including via open APIs and databus.
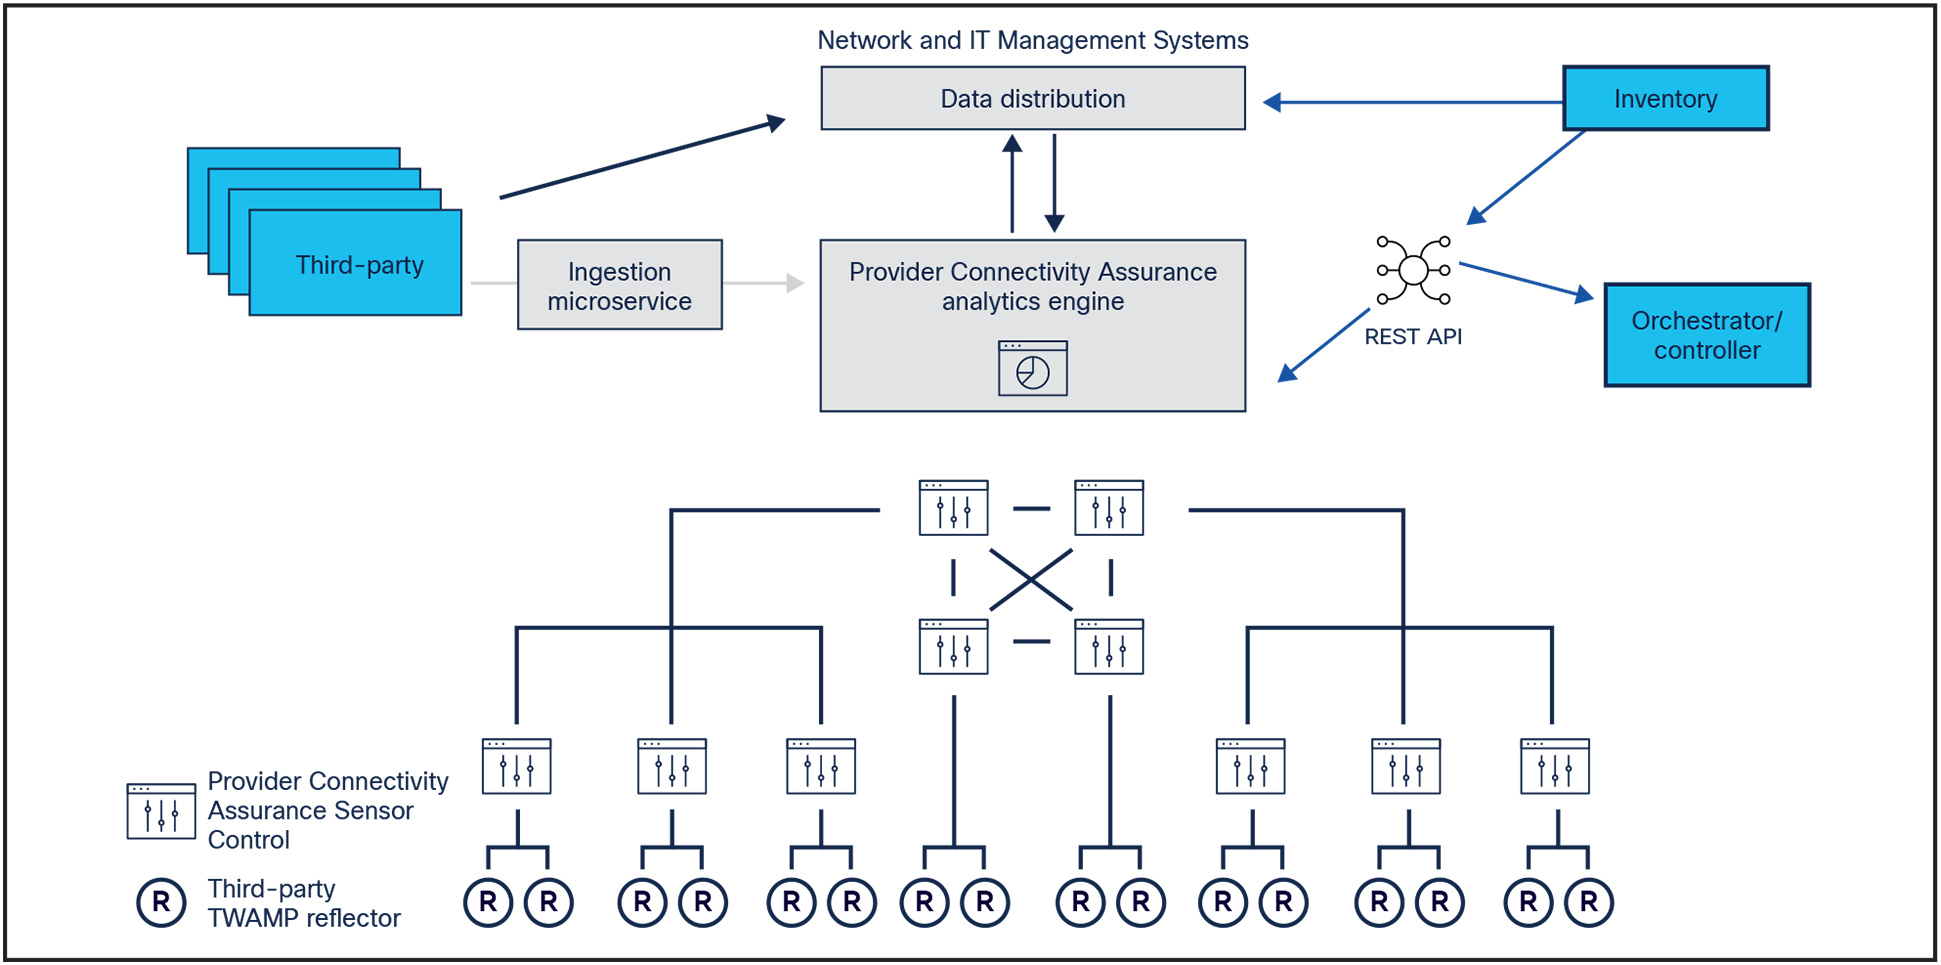
Provider Connectivity Assurance enables easy integration with existing network and IT services and solutions
In each of the examples presented in this section, you’ll see how enriching network performance data can create actionable events. Provider Connectivity Assurance can detect these events with signatures, and the events can then be pushed to other systems. In the following use cases, the performance data graphs are from Provider Connectivity Assurance, but the solution can work with any third-party visualization tool capable of accepting open API feeds.
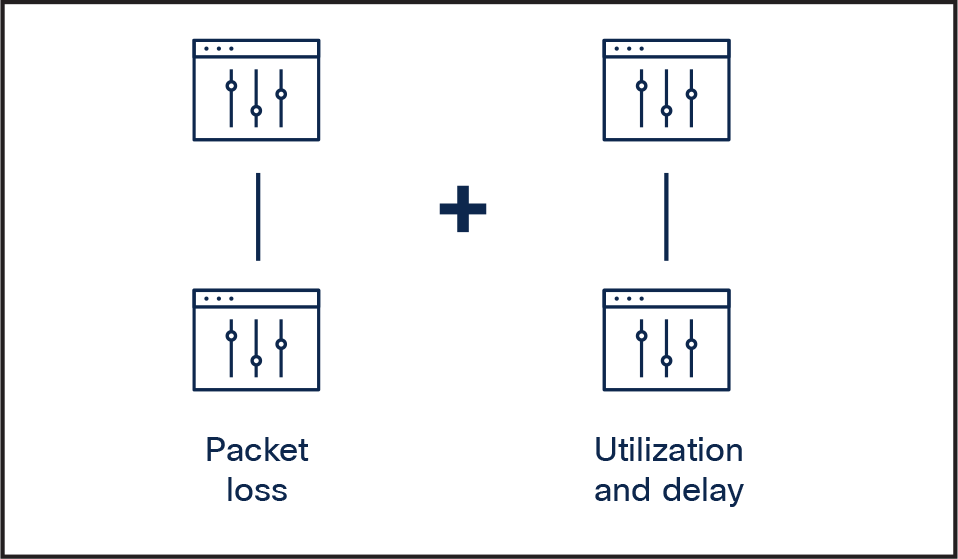
In this example, packet loss is high and the customer is being impacted. This event caused a threshold to be crossed, but the event in itself does not give any indication of the potential cause. Leveraging a connection of utilization and loss metrics from two different sources, correlated using metadata, you can see a correlation between packet loss and high utilization. This points to configuration and capacity issues in the specified part of the network.
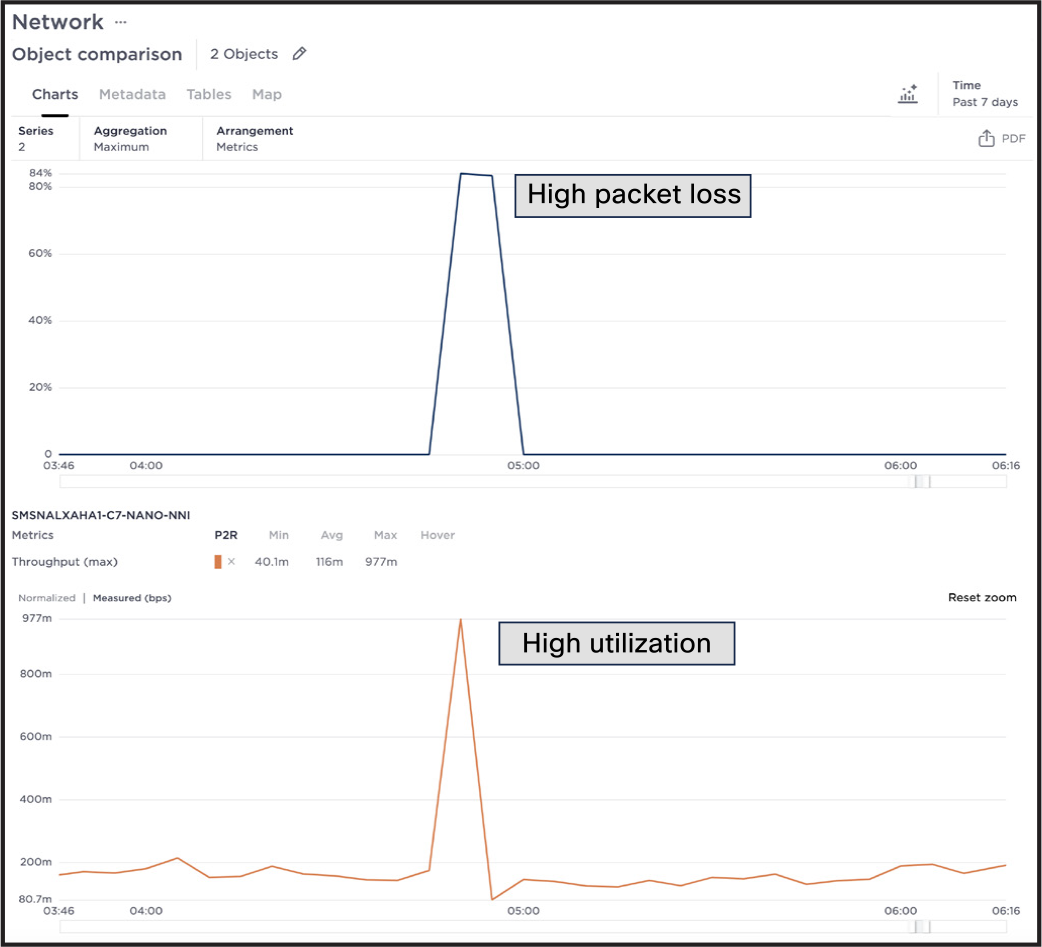
Utilization and packet loss events correlates into a single event
Networks are increasingly dynamic and fluid. Even daily network operations, including network upgrades and route changes, impact network performance. Creating a baseline of network performance can help you understand the impact of these changes.
This example shows baselined routes and delay. By combining the baselines, you can easily detect the impact of a change in a network route.
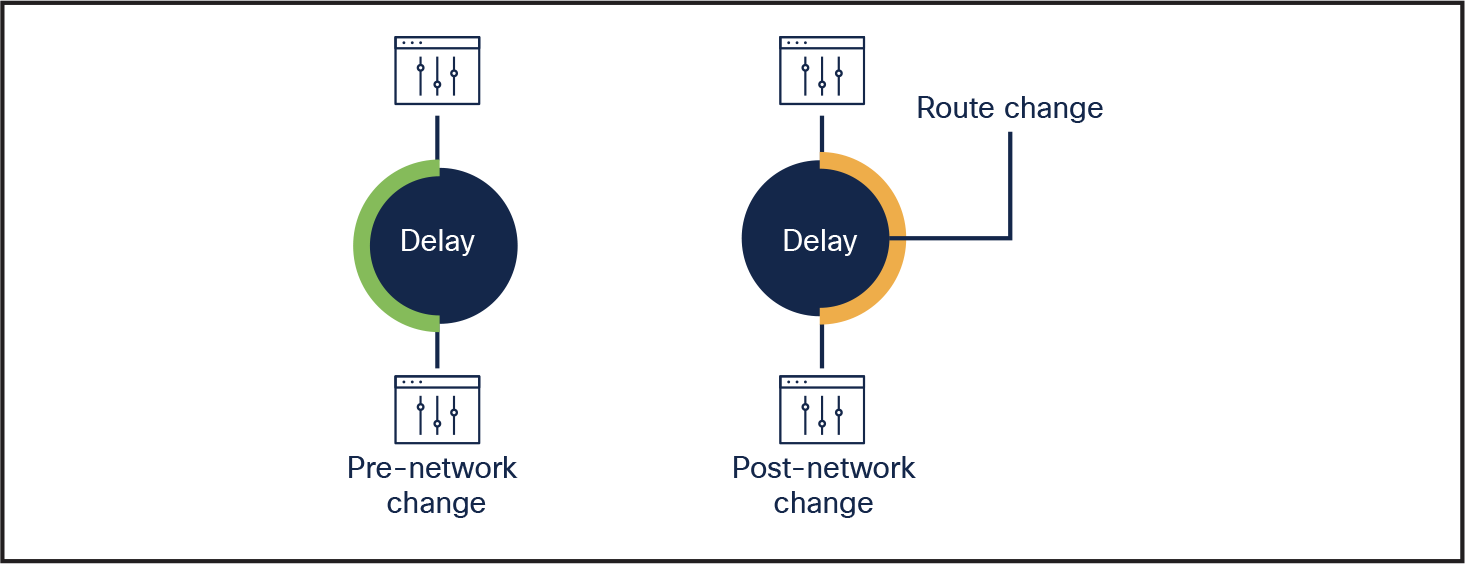
Benchmark network performance pre- and post-network changes
Now you can look at what’s causing the delay on the new route and, based on this data, decide what action—if any—should be taken.
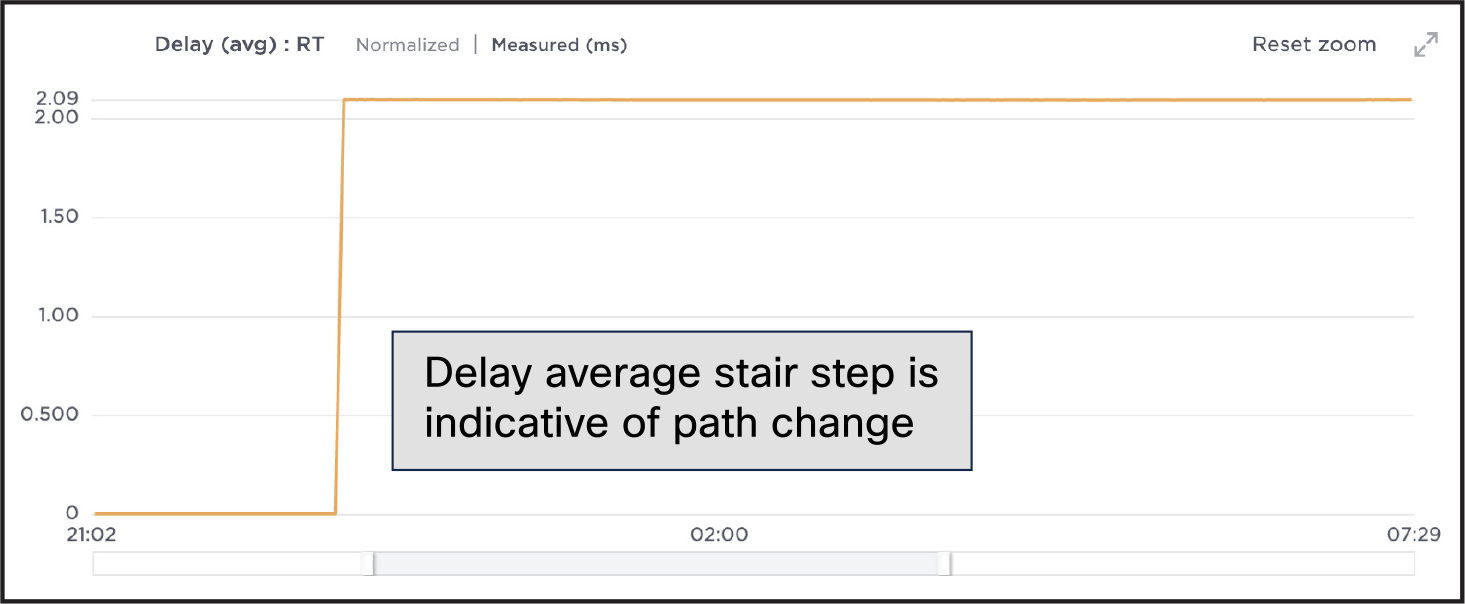
Relationship between a change in the network and performance
Events like network delays, congestion, and packet loss can impact the network and users. Provider Connectivity Assurance uses metadata to understand the commonality of the event and how it impacts the network upstream and downstream. You can use the solution to pull in metadata from inventory systems or any IT or network system in several ways.
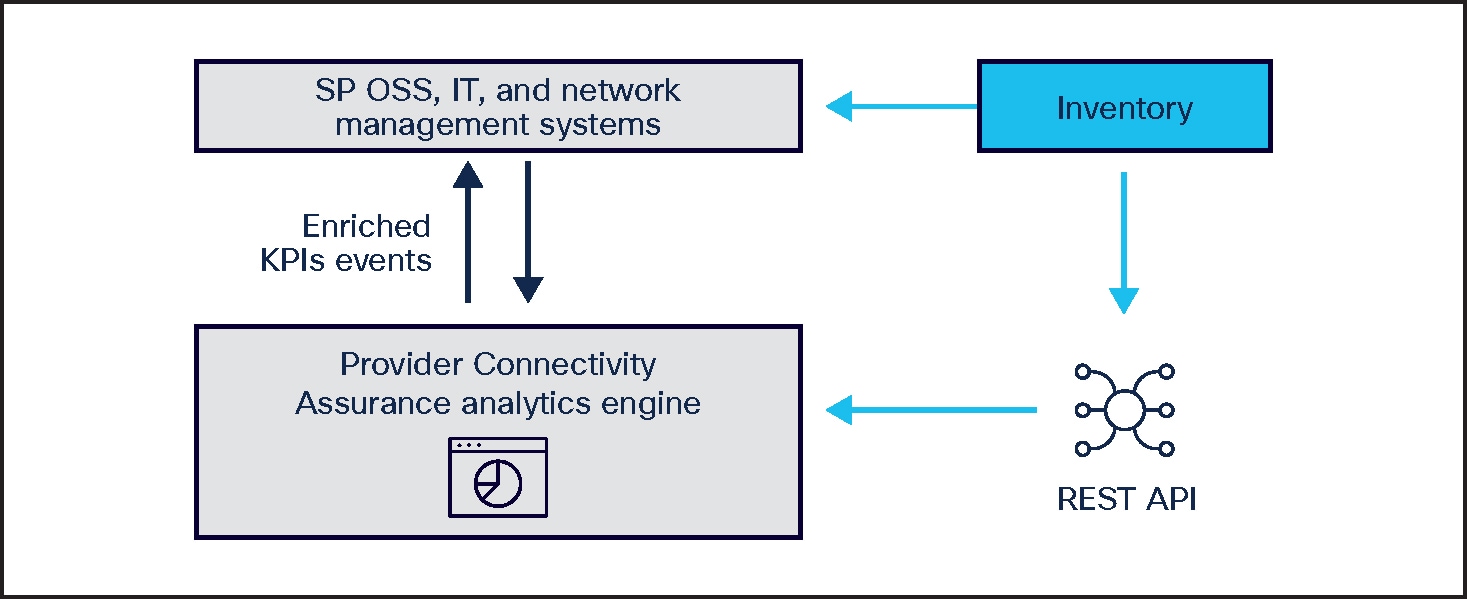
Provider Connectivity Assurance pulls metadata from the inventory system to troubleshoot issues
In the next example, the network has multiple branches connecting to the core. Figure 8 shows that packet loss has crossed a threshold on an aggregate link towards the core. An initial assessment might conclude that multiple endpoints were having network issues. This could raise many trouble tickets and even potential truck rolls.
By using metadata, you can track back to one common point. Starting at this point can help you determine the cause of issues downstream, because an issue in the core has ripple effects on downstream performance. Metadata allows for correlation, determining the common place—or source—where one should look for issues.
This insight from enriched metadata eliminates the costs of unnecessary trouble tickets, truck rolls, and operating expense (time).
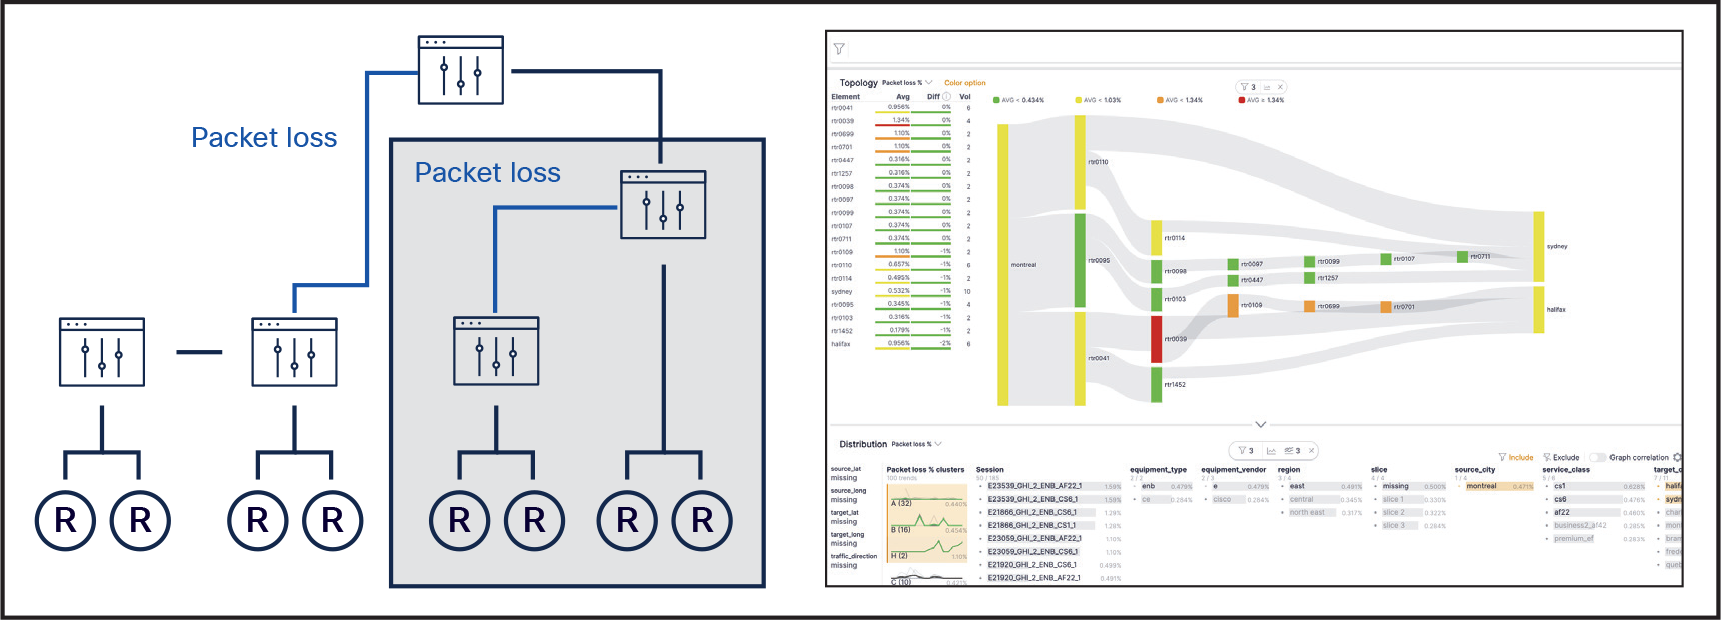
Metadata graph showing the relationship of the network
This example reflects how to determine when an issue is caused by an event in the control plane. You can use Provider Connectivity Assurance to baseline performance of services and links. The solution uses that baseline to do dynamic thresholding, which can be applied to high or low watermarks.
Figure 9 shows a layout of links or services that are being measured for delay and utilization. Each individual KPI on its own can indicate that the network is working fine.
Layout of links and services to be measured for delay and use
Figure 10 shows that packet loss and delay seem fine, but utilization has dropped to an abnormal level.
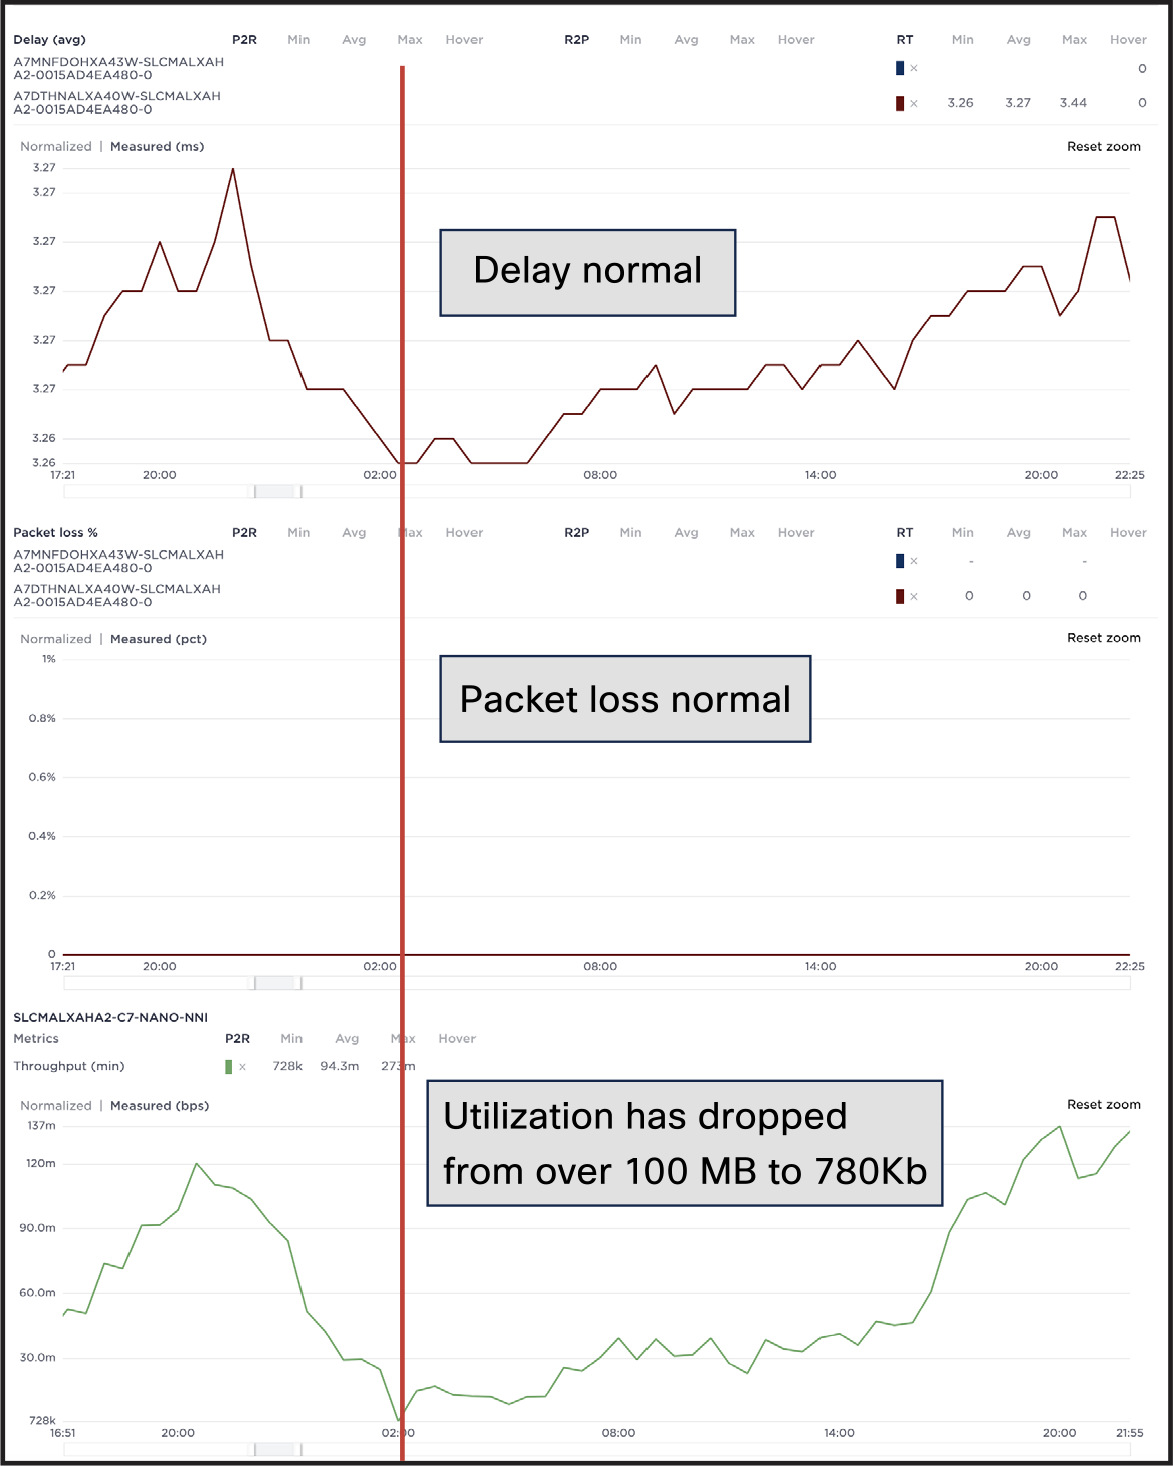
Layout of links and services to be measured for delay and use
Analysis of the event indicates that the network is operating within normal bounds, but another event has occurred in the control plane that is impacting performance and, ultimately, the customer experience. Using the enriched data has reflected that network behavior was not normal, while also indicating that the network data plane was not the cause.
4. Cisco Provider Connectivity Assurance: flexible and open
Provider Connectivity Assurance is a cloud-native solution for service assurance and analysis of your network performance monitoring data. The platform components are fault tolerant because they are stateless, enabling high availability and easy maintenance.
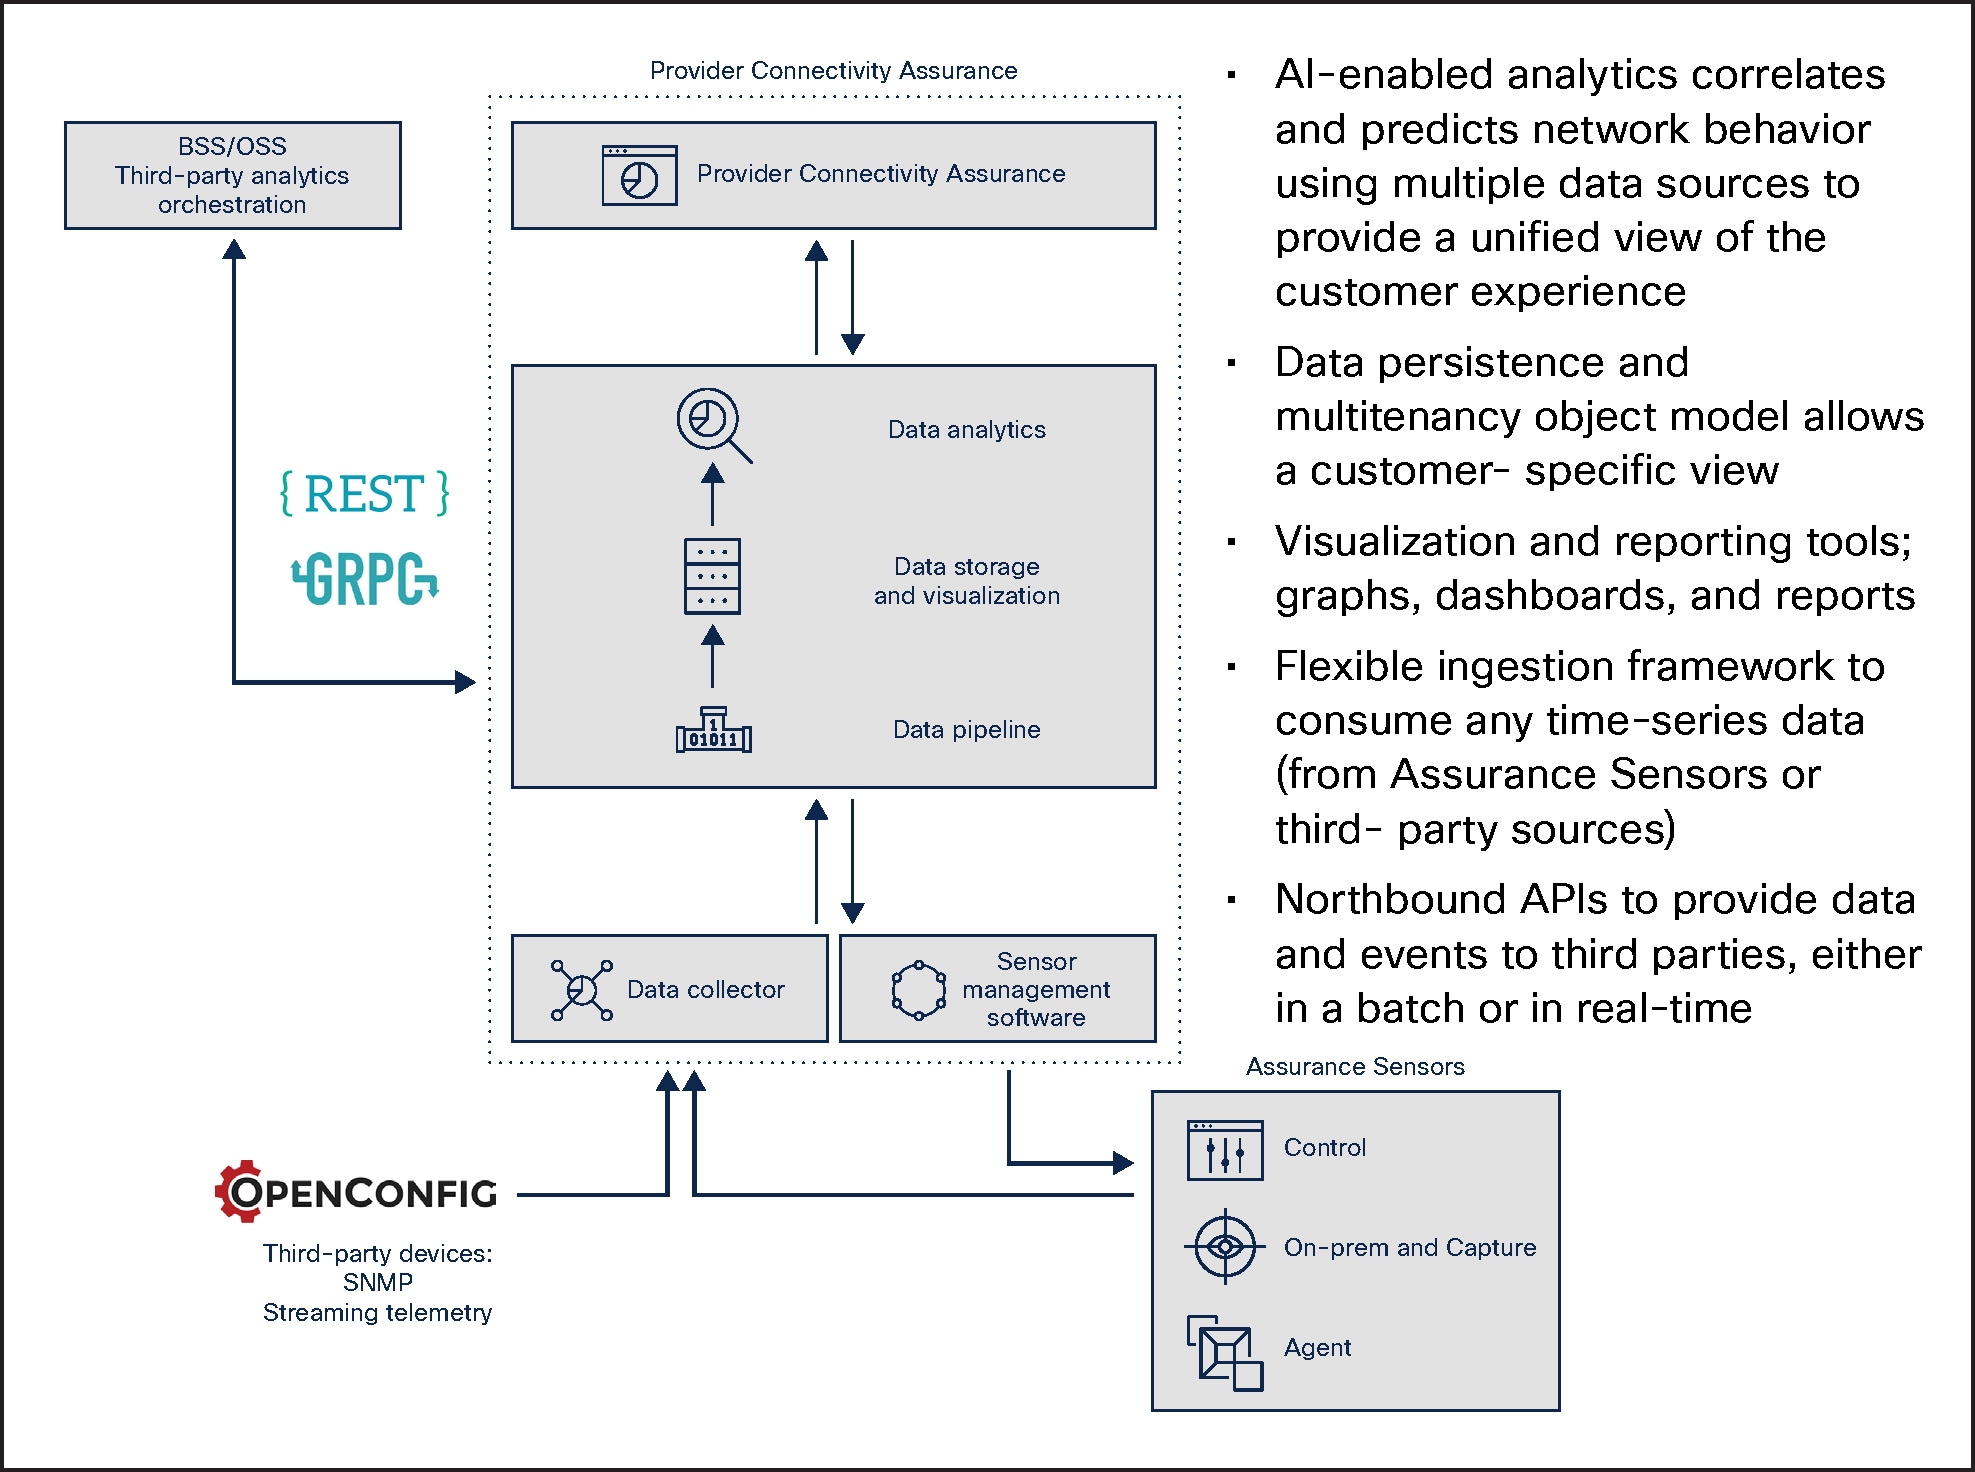
Cisco Provider Connectivity Assurance solution
Provider Connectivity Assurance’s primary features include the following:
Ingestion
A data collector runs close to where the performance monitoring data is generated. It parses the data via the configured dictionary according to the reporting object type and then streams the results into the Provider Connectivity Assurance solution over a secure connection. This design allows for easy ingestion of third-party data.
Data pipeline
Streams from all the collectors through a load balancer before the analytics engine. Data is then distributed across multiple message busses, where it waits for ingestion tasks to run analytical algorithms that clean, enrich, stream out, and store data.
Data storage
Ingested data is stored in two locations:
● A time-series datastore that provides query response times for complicated aggregate queries across thousands of objects over variable periods. This avoids pre-aggregation in the majority of cases and lets the user directly work with, slice, and view the data.
● On disk as a Parquet file (ideal for big data). The analytics engine uses these files for pattern matching, shape classification, and anomaly detection.
Advanced features
This component is where ingestion and post-ingestion algorithms run on the platform:
● Data cleaning removes records or metrics that are erroneous or that match customer-defined cleaning rules.
● Data aggregation rolls data up into preconfigured periods for faster query performance based on the granularity requested.
● Monitoring watches for threshold-crossing events.
Network operations teams managing critical and high performance networks require actionable insight on next steps with performance monitoring data solutions.
A lightweight analytics engine like Provider Connectivity Assurance, with support for open APIs, can integrate smoothly with current IT and network systems. This engine can refine raw KPI data by removing false positives and highlighting key areas for closer analysis.