Cisco Breach Protection Suite Design Guide
Available Languages
Bias-Free Language
The documentation set for this product strives to use bias-free language. For the purposes of this documentation set, bias-free is defined as language that does not imply discrimination based on age, disability, gender, racial identity, ethnic identity, sexual orientation, socioeconomic status, and intersectionality. Exceptions may be present in the documentation due to language that is hardcoded in the user interfaces of the product software, language used based on RFP documentation, or language that is used by a referenced third-party product. Learn more about how Cisco is using Inclusive Language.
The cost of security breaches continues to rise. The 18th annual Cost of a Data Breach report estimates the average cost of each breach at $4.45 million dollars for 2023, a new all-time high. However, there are some silver linings. Companies that detect a breach themselves (rather than being informed by an attacker or a ransomware popup) have associated costs around $1 million dollars less than the average. Companies that invest in AI (Artificial Intelligence) and security automation see even greater benefits. While preventing a breach remains the primary goal of a security deployment, an all or nothing mentality is antiquated. The rising costs of security breaches and the increasing complexity of attacker techniques requires a strong foundation of security best practices alongside evolving detection and response capabilities.
The Cisco Security Cloud is a cloud-based platform designed to close the security gaps by integrating solutions to achieve a pervasive defense across your entire ecosystem – across the data center, cloud, and edge. Cisco Security Cloud helps unify platforms and solutions that customers rely on to run their business, reducing costs and complexity, and improving efficacy.
The Cisco Security Suites are delivered by the Cisco Security Cloud and include:
● Cisco Breach Protection Suite
◦ Secure your business by investigating, prioritizing, and resolving incidents through unified defense and contextual insights from data-backed, AI-powered security
● Cisco Cloud Protection Suite
◦ Secure your apps and data with a powerful, flexible framework for a hybrid and multicloud world
◦ Get secure access to any application, on any device, from anywhere. Defend against threats targeting users and deliver seamless access for hybrid work
This design guide covers the Breach Protection Suite. The Cisco Breach Protection Suite is a set of products designed to provide strong detection, prevention, and response capabilities, while also facilitating better automation and aggregated threat intelligence. Email Threat Defense and Secure Endpoint provide an extensive set of capabilities for protecting end users from a wide range of threats; Secure Network Analytics (SNA) provides heuristic anomaly detection for network traffic; and Cisco XDR aggregates data across Cisco and 3rd party security tools to facilitate and automate complex investigations and associated responses.
The sections of this guide are intended to provide resources for users of all experience levels. The Ransomware, MITRE ATT&CK, Breach Protection, and Solution Architecture sections offer contextual security information on how the tools in the Breach Protection Suite can be applied and used. The Cisco Breach Protection Suite Deployment section contains step by step guides for integrating different products in the Breach Protection Suite with Cisco XDR, creating dashboards, and deploying a Secure Client from Cisco XDR. A guide to deploying Email Threat Defense is also provided. The last section of the guide—Breach Protection Validation Tests—offers a series of simulated attacks that can be used to test the capabilities of the different products in the Breach Protection Suite and become familiar with monitoring procedures using Cisco XDR and the individual security tool GUIs (Graphical User Interfaces).
This guide will explore the topic of breach protection by using ransomware as a primary example. Configurations, integrations, tests, and analysis that support stronger detection, prevention, and response capabilities against ransomware will be given throughout the guide. Attack tests and their associated investigations will be grounded in the MITRE ATT&CK framework. The Tactics and Techniques of the MITRE ATT&CK framework feature heavily in Cisco XDR investigations, as will be shown in the Breach Protection Suite Validation Tests section of this guide.

The Cisco Breach Protection Suite design guide covers the following components:
● Secure Endpoint integration with Cisco XDR
● Email Threat Defense setup and integration with Cisco XDR
● Secure Client configuration and deployment via Cisco XDR
● Secure Network Analytics integration with Cisco XDR
● Umbrella integration with Cisco XDR
● Validation tests for XDR, Secure Endpoint, Secure Network Analytics, Email Threat Defense, and Umbrella
● Investigation workflows for Cisco XDR and integrated Breach Protection Suite products
The Cisco Breach Protection design guide does not cover the following topics:
● The design guide is written to be agnostic to the origination of traffic and therefore network design or best practices have been omitted
● Configuration for the in scope products has been limited to the configuration necessary for Cisco XDR integration and validation testing
● Cisco XDR has many Cisco and 3rd party integrations. This guide covers one additional integration—Cisco Umbrella—and more may be added at a later date
● XDR and NVM integration with Secure Cloud Analytics are not covered in this guide
This guide addresses the topic of breach protection under the SAFE Threat Defense domain. The SAFE Model organizes the network into logical areas called places in the network (PINs), simplifying complexity across the enterprise by implementing a model that focuses on the areas that a company must secure. This model treats each area holistically, focusing on today’s threats and the capabilities needed to secure each area against those threats. Cisco has deployed, tested, and validated these critical business challenges. These solutions provide guidance, complete with configuration steps that ensure effective, secure deployments for our customers.
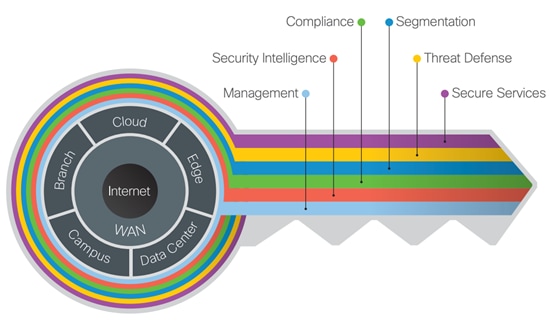
Cisco SAFE Threat Defense
This guide includes a recommended ransomware defense architecture across all SAFE PINs. Ranging from business flows and their respective threats to the corresponding security capabilities, architectures and designs, SAFE provides guidance that is holistic and understandable.
More information about how Cisco SAFE Simplifies Security can be found here: Cisco.com/go/safe.
Ransomware is the most profitable type of malware in history. In the past, malware typically did not deny access to systems or destroy data. Attackers primarily tried to steal information and maintain long term access to the systems and resources of their victims. Ransomware has changed the game from stealthy undetected access to extortion.
The Colonial Pipeline is the largest pipeline system in the United States, carrying over 3 million barrels of refined oil products per day between Texas and New York. In May 2021, The Cybersecurity and Infrastructure Security Agency (CISA) and the Federal Bureau of Investigation (FBI) confirmed that DarkSide, a Russian cybercriminal hacking group that targets victims using ransomware and extortion, was behind an attack on Colonial Pipeline. After paying $4.4 million ransom and spending a long week restoring backups, Colonial was able to resume operations. However, this did lead to fuel shortages across several airports, which caused flight delays and a rise in average fuel prices to their highest level since 2014. Localized gasoline shortages along the pipeline route were also seen, exacerbated by reduced number of truck drivers due to high employment rates and panicked consumers.
More recently, 2023 has already seen a spike in ransomware, reversing what looked like a downward trend in ransomware payments in 2022. Estimates place ransomware payouts at over $400 million so far in 2023, a pace that could rival 2021 for the largest total of payouts ever. The use of zero-day vulnerabilities by the CL0P ransomware group also raises the stakes even for organizations with strong patch and vulnerability management.
Every single business or person who pays to recover their files makes their payment directly to the attackers. The relatively new emergence of anonymous currencies such as Bitcoin and Ethereum gives attackers an easy way to profit with relatively low risk, making ransomware highly lucrative and funding the development of the next generation of ransomware. As a result, ransomware is evolving at an alarming rate. Recent ransomware attacks propagate like worms, spreading throughout an organization in a coordinated manner. Attackers aggregate the ransom demand or aim to cause business disruption and destruction regardless of the ransom payout.
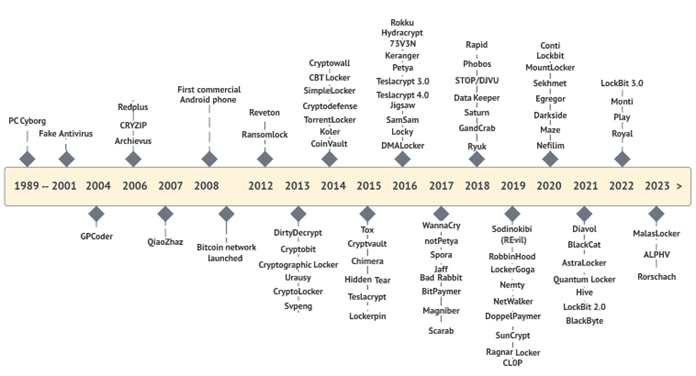
The Evolution of Ransomware Groups & Variants
Ransomware must be prevented when possible, detected when it attempts to breach a network, and contained to limit potential damage when it infects systems and endpoints. Ransomware defense calls for a new best-of-breed architectural approach that spans the organization from the network edge of the domain name system (DNS) layer, all the way to the data center and across endpoint devices, no matter where they’re being used.
Ransomware is malicious software (malware) used in a cyberattack to encrypt the victim’s data with an encryption key that is known only to the attacker, thereby rendering the data unusable until a ransom payment (usually cryptocurrency, such as Bitcoin) is made by the victim. Ransomware uses traditional malware attack vectors such as phishing emails, known vulnerabilities, and exploit kits to deliver the ransomware to a machine. Once established, it takes over systems and stored data, encrypting their contents, denying access, and holding them hostage until a ransom is paid. During this time, ransomware also spreads throughout the network, causing significant business disruption.
The denial of access to these critical resources can be catastrophic to businesses:
● Hospitals can lose the ability to give patients real-time care (admittance, surgeries, medications, etc.)
● Manufacturers can have product downtime and miss shipping/delivery schedules
● First responders can be prevented from responding to 911 or emergency calls
● Financial banking systems can be offline for trading or banking activities
● Retail outlets cannot process payments and customers cannot make purchases
Understanding How Ransomware Operates
Ransomware is commonly delivered through exploit kits, waterhole attacks (in which one or more websites that an organization frequently visits is infected with malware), malvertizing (malicious advertising), or email phishing campaigns.
Phishing scams are the most common type of social engineering attack. They typically take the form of an email that looks as if it is from a legitimate source. Sometimes attackers will attempt to coerce the victim into giving away credit card information or other personal data. At other times, phishing emails are sent to obtain employee login information or other details for use in an advanced attack against their company.
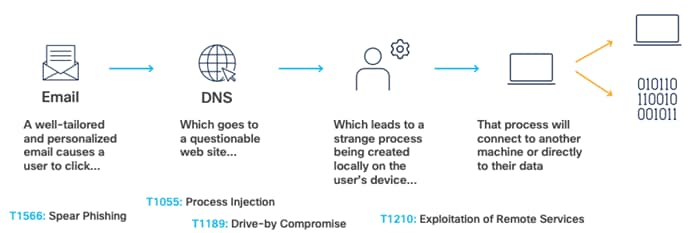
Common Ransomware Infection Steps
Once delivered, ransomware typically identifies user files and data to be encrypted through some sort of embedded file extension list. It is also programmed to avoid interacting with certain system directories (such as the WINDOWS system directory, or certain program files directories) to ensure system stability for delivery of the ransom after the payload finishes running. Files in specific locations that match one of the listed file extensions are then encrypted. Otherwise, the file(s) are left alone. After the files have been encrypted, the ransomware may leave a notification for the user, with instructions on how to pay the ransom.
MITRE ATT&CK Framework
Companies of all sizes use MITRE ATT&CK to understand precisely how threat actors operate. MITRE Corporation says that ATT&CK is “a globally accessible knowledge base of adversary tactics and techniques based on real-world observations.” They trademarked ATT&CK to abbreviate Adversarial Tactics, Techniques, and Common Knowledge. The ATT&CK tactics are, in order:
● TA0043: Reconnaissance: gather information to plan future operations. Such information may include details of the victim organization, infrastructure, or staff/personnel
● TA0042: Resource Development: establish resources to support operations. Create, purchase, or stealing resources that can be used to support targeting
● TA0001: Initial Access: an adversary is trying to get into your network. Techniques used to gain a foothold include targeted spearphishing and exploiting weaknesses on public-facing web servers
● TA0002: Execution: adversary is trying to run malicious code. Execution consists of techniques that result in adversary-controlled code running on a local or remote system
● TA0003: Persistence: adversary is trying to maintain their foothold. Persistence consists of techniques that adversaries use to keep access to systems across restarts, changed credentials, and other interruptions that should cut off access
● TA0004: Privilege Escalation: adversary is trying to gain higher-level permissions. Adversaries can often enter and explore a network with unprivileged access but require elevated permissions to follow through on their objectives
● TA0005: Defense Evasion: adversary is trying to avoid being detected. Techniques used for defense evasion include uninstalling/disabling security software or obfuscating/encrypting data and scripts. Adversaries also leverage and abuse trusted processes to hide their malware
● TA0006: Credential Access: an adversary is trying to steal account names and passwords. Credential access consists of techniques for stealing account names and passwords. Using legitimate credentials can give adversaries access to systems for further exploitation
● TA0007: Discovery: an adversary is trying to figure out your environment. These techniques help adversaries observe the environment and orient themselves before deciding how to act
● TA0008: Lateral Movement: an adversary is trying to move through your environment. Reaching their objective often involves pivoting through multiple systems and accounts to gain
● TA0009: Collection: adversary is trying to gather data of interest to their goal. Frequently, the next goal after collecting data is to steal (exfiltrate) the data
● TA0011: Command and Control (C2): an adversary is trying to communicate with compromised systems to control them. C2 consists of techniques that adversaries may use to communicate with systems under their control within a victim network
● TA0010: Exfiltration: an adversary is trying to steal data. Techniques for getting data out of a target network typically include transferring it over their C2 channel
● TA0040: Impact: an adversary is trying to manipulate, interrupt, or destroy your systems and data. Impact consists of techniques that adversaries use to disrupt availability or compromise integrity by manipulating business and operational process
Each of these tactics are the adversary’s objective for performing an action. Each tactic consists of several techniques, which represent how an adversary achieves a tactical objective or represent what an adversary gains by performing an action. For example, adversaries may use a phishing technique (the act of sending victims emails containing malicious attachment or links) to gain initial access (the third tactic of MITRE) to the network. While some of the relationships between tactics and techniques will be shown in this document, a complete list can be found at the MITRE website.
The Cisco Breach Protection Suite creates a defense in depth architecture with Cisco Security best practices, products, and services to prevent, detect, and respond to ransomware attacks. Cisco’s Breach Protection Suite is not a silver bullet or a guarantee, but it does help to:
● Prevent ransomware from getting into the network wherever possible
● Stop ransomware at the system level before it gains command and control
● Detect when ransomware is present and spreading in the network
● Work to contain ransomware from expanding to additional systems and network areas
● Perform incident response to fix the vulnerabilities and areas that were attacked
This solution helps to keep operations running, reducing the fear of being taken hostage and losing control of critical systems. Current offerings for Breach Protection Suite products and tiers can be found at cisco.com/go/breach-protection.
The Breach Protection Suite is a set of products offered by Cisco with complementary security functions and tightly integrated capabilities. This guide specifically covers the following Cisco Breach Protection Suite products: Cisco XDR, Cisco Secure Endpoint, Email Threat Defense, Secure Network Analytics, and Secure Malware Analytics. Together, these products offer critical detection, investigation, and containment capabilities for both common and complex threats.
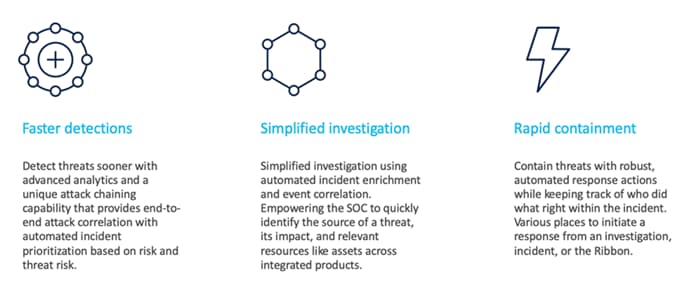
Breach Protection Mitigations
The Breach Protection Suite Product Capabilities section covers the capabilities provided by this suite of products, how they complement one another, and how they fit into an overall security design. Cisco XDR also offers flexibility for users to integrate additional security products to supplement the extensive capabilities of the Breach Protection Suite. Integration and testing instructions for one product outside the Suite that is used by many Cisco Security customers, Umbrella, is also included in this guide.
To defend against the tactics and techniques covered in the MITRE ATT&CK framework, specific capabilities are necessary to build the appropriate layers of defense. The table below identifies the SAFE methodology capabilities (Blue Circles) best suited for this defense.
| Icon |
Function |
Description |
|
|
Anomaly Detection |
Establish baselines of expected flow behavior and alert on deviations from baseline |
|
|
Anti-Malware |
Inspect files for ransomware and viruses, and then quarantine and remove |
|
|
Automated Response |
Collect and correlate data across email, endpoints, servers, cloud workloads, and networks, enabling visibility and response capabilities for advanced threats |
|
|
DNS Security |
Block known malicious domains and break the C2 callback |
|
|
Email Security |
Block ransomware attachments and links |
|
|
Endpoint Security |
Detect suspicious system processes and quarantine malicious software |
|
|
Flow Analytics |
Monitor infrastructure communications using flow-based analytics |
|
|
Threat Intelligence |
Knowledge of existing ransomware and communication vectors and learned knowledge in new threats |
Each of these capabilities is then deployed to combat and defend against the tactics and techniques covered in the MITRE ATT&CK framework. ATT&CK helps you understand attackers’ behavior from high-level Tactics to specific Techniques (and Sub-Techniques) all the way down to highly detailed Procedures.
“It is unrealistic for any single defensive product or service to cover all of ATT&CK” MITRE writes, and Cisco agrees. Cisco does not cover 100%, and you should be suspicious of anyone who claims complete coverage. Throughout this guide, a subset of the ATT&CK Tactics and Techniques will be used for context when building the SAFE business flows for Breach Protection.
It is not enough to have a world-class defense in depth architecture. You need to know what the critical priorities are in running your business, and whether they can be impacted if your systems are locked down.
The following best practices should be followed to improve security posture and provide recovery mechanisms if a breach occurs:
● The most important action is to ensure that you have good backups and that you regularly test the backup system for effectiveness. If backup restoration and recovery procedures go untested, they may fail in a critical moment. Frequency of backups is also important. Every system should be backed up at a frequency that can meet recovery objectives for all stakeholders.
● Security awareness training should be conducted regularly for your end users. This training should be engaging and contain the latest information on security threats and tactics
● Know to whom to make the ‘first call’. When an employee is hit with ransomware, who are they going to call first? Many times, it is the IT dept, but not always. Ensure the ‘first responder’ knows what actions they should take and can respond quickly
● Develop a good disaster recovery plan and ensure that it is regularly tested and updated as the business grows and changes. Identify all of the people, processes, and tools necessary to handle a critical disruption or event. Perform drills to test these plans on a regular basis
● Develop a comprehensive baseline of the applications, system images, information, and your normal running network performance. These give you visibility into changes on your network, enabling detection of the unusual
● Standardized images of operating systems and desktops allow for easy re-imaging to recover infected infrastructure
● Perform ongoing risk assessments to identify any security weaknesses and vulnerabilities in your organization and address any threat exposures to reduce risk
If your organization is under attack, fast and effective incident response is required to limit any potential damage. The specific action steps and remediation efforts to be undertaken will be different for each unique situation. However, the time to learn the breadth and extent of your organization’s incident response capabilities is not during an attack! Your incident response efforts should be well understood and coordinated — which is accomplished before an attack — and well documented and repeatable, so that you can reconstruct an incident after an attack and identify lessons learned and potential areas for improvement.
Backup recovery is your last line of defense and avoids having to pay out a ransom to the attackers. Your ability to recover from an attack with minimal data loss and/or service interruption amounts to whether or not the system backups and/or disaster recovery sites were compromised as a part of the attacker methodology. Whether or not your backups were compromised depends on how well your backup systems and/or network and/or recovery sites were sufficiently segmented from your main network. Even in the event your organization does not use on-site backups at all, instead opting for cloud backup solutions (e.g., Amazon Glacier), if those cloud backup credentials are left in easily accessible locations, or if passwords are reused, the attacker could easily delete all backup instances, resulting in 100% data loss if there is no other backup solution in place. A secure, off-site, enterprise backup solution could easily be defeated through password reuse and/or poor password management.
Customers who have newly purchased the Breach Protection Suite products for the first time should use Cisco Security Cloud Control to claim their subscription and provision product instances. Steps to claim a subscription and provision a product instance are available in this guide. Additional documentation on the Cisco Security Cloud is available in this document repository. Customers with existing product licensing will not need to register for Cisco Security Cloud Control at the time of this document writing. Consult your sales team for guidance as needed.
The first step in developing a defense in depth architecture is to take all of the previously defined capabilities and match them up with the real-world business functions/flows as identified in the SAFE model. Specific to ransomware, these are web browsing and email usage, as these are the highest risk methods of infection. Also included are employees attempting to access private and public applications. Each of these business flows are shown in Figure 4, with selected capabilities from the Breach Protection Suite and Umbrella DNS security integration. The flexibility of the Breach Protection Suite allows for consistent monitoring of employee devices across different workflows, whether the employee is onsite or working remotely.
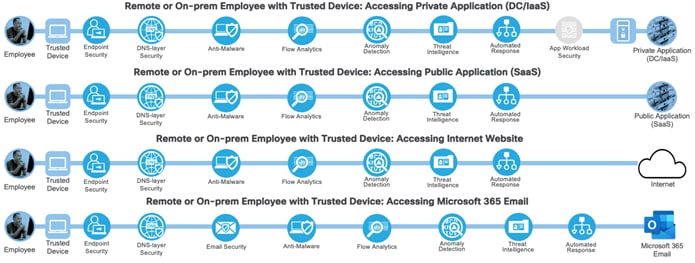
Cisco SAFE flows for Breach Protection
Breach Protection Suite Product Capabilities
Extended Detection and Response (XDR)
The risks posed by attackers, ransomware groups, and Advanced Persistent Threats (APTs) are constantly evolving. The topology of businesses is growing more complex as well, with more remote and roaming users and increasing cloud footprints. Defending against ever changing threats and securing broader and more complex organizational topologies necessitates a wide array of security products, and these security products in turn generate a large and distributed volume of events. To complicate the situation further, detection of attacks from advanced threats and actors can require correlating events from multiple security products. Efficient and centralized event visibility, automation, and response capabilities are critical.
Cisco XDR meets these challenges by collecting event data from an extensive range of Cisco and 3rd party integrations and utilizing powerful event correlation capabilities to produce detailed incidents that pull data from multiple security products. Cisco XDR also streamlines Security Operation Centers (SOCs) by auto-populating investigation descriptions and automating workflows and tasks, and by providing a centralized location for manual and automated response capabilities. Among other native capabilities, Cisco XDR works directly with the Network Visibility Module (NVM) to collect detailed endpoint telemetry that can tie endpoint traffic directly to system processes, offering unparalleled visibility into endpoint behavior on or off network.
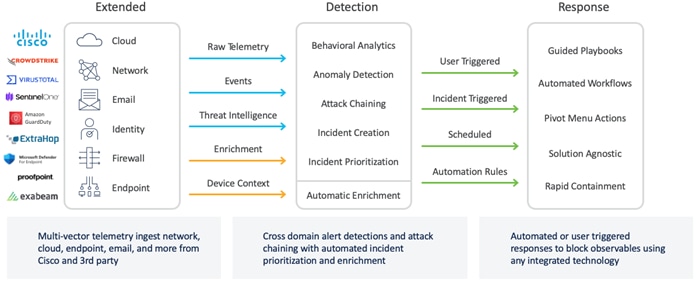
Cisco XDR Capability Overview
Cisco XDR serves as the focal point for a SOC by bringing together a high-level view of events from the other products in the Breach Protection Suite, additional Cisco security products, and 3rd party integrations. As Cisco XDR creates incidents from multiple event sources, it will aggregate relevant observables, host interactions, and other data to automate a significant portion of the investigation process. In addition, Cisco XDR will automatically map observables to Tactics, Techniques, and Procedures (TTPs) in the MITRE ATT&CK Framework. When necessary, SOC analysts can use Cisco XDR to drill down on additional event data by launching the GUIs of integrated products directly from Cisco XDR. And when an investigation is complete and a remediation action is required, the quarantine mechanisms of integrated products can be activated directly from Cisco XDR, either manually or via automation. Examples of incident correlation and response mechanisms are provided in the validation test sections of this document.
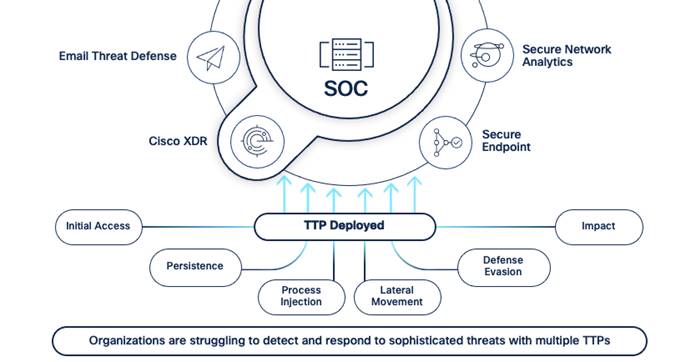
Cisco XDR facilitates the detection and investigation of complex attacks that utilize multiple TTPs
Although anti-malware exists in many network appliances, host-based anti-malware is the last line of defense, and often the only defense for communications encrypted end-to-end (password protected archives, https/sftp, chat file transfers, etc.). Anti-Malware detection on an endpoint analyzes all files that reach the user's system. If the file is known to be malicious, it is quarantined immediately.
ATT&CK recognizes anti-malware as a mitigation (M1049) that spans multiple adversary tactics and techniques. These mitigations include detecting kernel modules and extensions (T1547.006) that automatically execute programs on system boot, or protecting against commands and scripts (T1059) that have been embedded in Initial Access (TA0001) payloads.
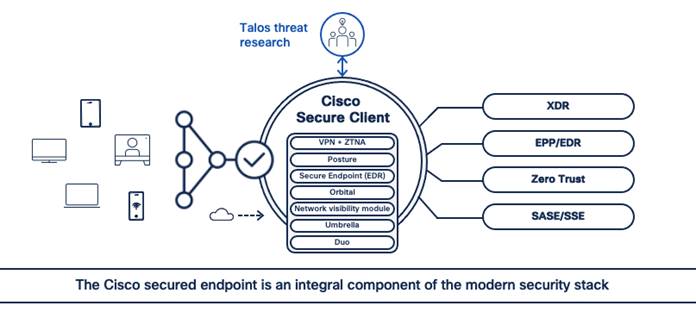
Cisco Secure Client with Secure Endpoint
Cisco Secure Endpoint analyzes all files that reach the user’s system. If the file is known to be malicious, it is quarantined immediately. If the file is of low prevalence (files never seen before, and have no history), it is uploaded automatically to Cisco Secure Malware Analytics, a file sandbox service, for analysis which provides retrospective security to detect malware that evaded initial inspection.
Using a combination of file signatures, file reputation, behavioral indicators, and sandboxing, anti-malware detection can stop the initial exploit kit from executing on a user's system and can also stop the execution of the dropped ransomware file and remove it.
Additionally, Cisco Secure Endpoint continuously analyzes and records all file activity on a system, regardless of a file’s disposition. If at a later date a file behaves suspiciously, Cisco Secure Endpoint retrospectively detects it and sends an alert. It records a detailed history of malware’s behavior over time, including where and how it entered the network, where else it traveled, and what it did. Based on a set policy, the threat can then automatically or manually be contained and remediated.
Cisco Secure Email Threat Defense (ETD) blocks a significant amount of ransomware attacks by pre-filtering all messages coming into an organization before the emails ever reach a real person that may open or click on them. Both the message body and any attachments can be scanned for threats, with options to quarantine the email or automatically send it to the junk folder depending on the threat severity (e.g. malware vs. spam). ETD can also submit unknown files for sandbox analysis, providing an extra layer of security.
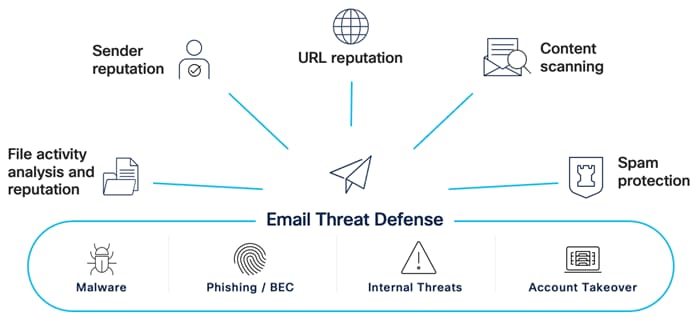
Email Threat Defense Capabilities
Some security mitigations don’t involve products at all. One of the mitigations for social engineering attacks that ATT&CK recommends is User Training (M1017). This involves training users to be aware of these manipulation attempts by an adversary to reduce the risk of techniques such as phishing (T1566). However, people make mistakes, so restricting web-based content (M1201) through vectors like email helps to block certain websites and suspicious payloads. Email Threat Defense evaluates URLs to determine whether a message contains spam, phishing, or other malicious links, and takes an appropriate action based on the URL’s reputation.
As new malware variants persistently emerge and zero days become more prevalent, relying fully on hash based malware detection becomes more and more of an unacceptable risk. Using a sandbox to detonate unknown files and perform advanced behavioral analysis provides a vital capability to detect previously unknown malware based on behavior. The effectiveness of malware as an attack vector has quickly elevated malware sandboxing from an advanced feature to a core component of a strong security deployment.
Cisco Secure Malware Analytics integrates heavily with the other products in the Breach Protection Suite. Cisco Secure Endpoint and Cisco Secure Email will both send unknown files to Secure Malware Analytics for sandbox analysis; Secure Malware Analytics then detonates the file, performs analysis, and returns the disposition data to the sender and provides findings to Cisco XDR. As new malware is discovered through sandbox analysis, Talos threat research, or another security device observation, the malware designation is shared across the Cisco Threat Intelligence Cloud to facilitate blocking and remediation for all Cisco customers.
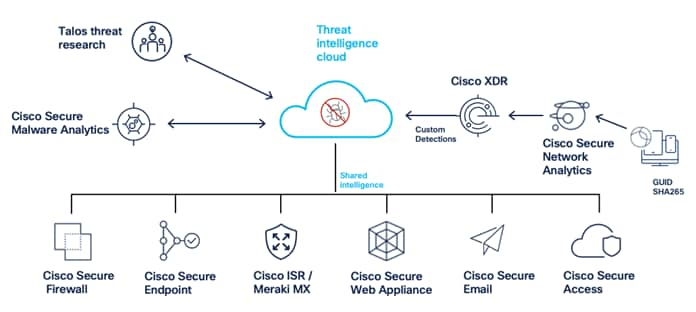
Cisco Secure Malware Analytics Intelligence & Sandbox Integrations
Network Detection and Response (NDR)
Network traffic analysis aids in cybersecurity by exposing devices on the network, tracking all network connections, and identifying network anomalies. This is especially true as organizations seek to expand visibility beyond north/south traffic to monitor east/west connections within internal networks and extend visibility to public cloud infrastructure.
Network detection and response tools provide visibility into a multitude of different ATT&CK tactics and techniques. Some capabilities do overlap with other solutions, such as the ability to detect C2 callbacks. However, these mitigations are best performed at the DNS layer so that appropriate action can occur. An area where NDR really thrives, is through the detection of Exfiltration (TA0010) and Lateral Movement (TA0008). NotPetya, for example, can use two exploits in SMBv1, EternalBlue and EternalRomance, to spread itself to other remote systems on the network. NDR provides detection and containment capabilities for worm activity and similar threats.
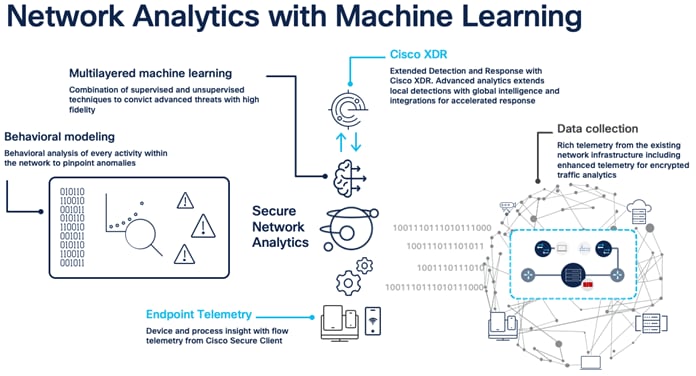
Secure Network Analytics with Cisco XDR and Endpoint Telemetry
Cisco Secure Network Analytics provides visibility and security intelligence across an entire network before, during, and after an attack. It continuously monitors the network and provides real-time threat detection and incident response forensics if a ransomware outbreak occurs.
Secure Network Analytics turns the network into a sensor, ingesting and analyzing flow data from across the network and supplementing it with firewall log data, creating a baseline of the normal communication of an organization and its users. From this baseline, it is then much easier to identify when sophisticated attackers infiltrate the network and perform attacks such as deploying ransomware. It can identify malware, distributed denial-of-service (DDoS) attacks, advanced persistent threats, and insider threats. It monitors both north-south and east-west (lateral) movements to detect the widest range of attacks.
Although the product is out of scope for this document, Secure Network Analytics also works in tandem with the Cisco Identity Services Engine (ISE) and Cisco TrustSec technologies. Through these integrations you can identify users and systems and appropriately segment critical network assets based on system behavior, and initiate a manual quarantine when warranted.
While NDR provides vital context and monitoring capabilities for network traffic, it does have key limitations. Many organizations have hybrid work environments and deploy VPN-less technology, resulting in work forces that spend some or all of their time off network. While NDR can resume monitoring when an endpoint returns to the network, organizations still face significant risks to cloud environments, company data, and other resources if an off-network endpoint is compromised. In addition, advancements in traffic encryption in protocols such as DNS over HTTPS make inspection of traffic increasingly difficult. By offering persistent endpoint telemetry below the IP stack, the Network Visibility Module delivers powerful solutions to both challenges while seamlessly integrating with XDR.
The NVM has been outfitted with a persistent encrypted communication tunnel back to XDR, which delivers uninterrupted telemetry data from the endpoint from any location, on or off network. In addition, because the NVM sits directly on the endpoint, it can collect significantly more telemetry data than is possible via traditional NDR. These additional points of data provide powerful context for XDR’s event correlation capabilities.
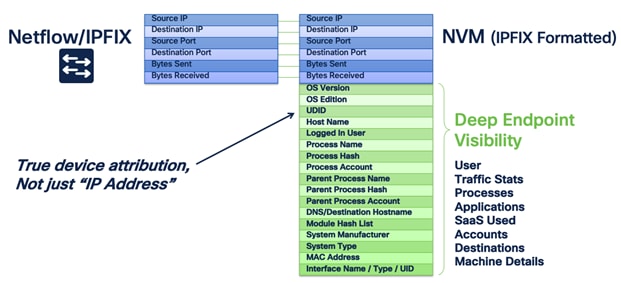
NVM Endpoint Visibility
Review the list of datapoints in Figure 12 and consider how much information is available—a log from one connection can show not only what IP was accessed over what port, but also the process and parent process that launched it, and the associated user and device. We can go from ‘source IP x.x.x.x connected to destination port y.y.y.y over port 22’ to ‘endpoint x with logged in user y initiated an outbound connection over port 22 from process powershell.exe with parent process questionableprogram.exe’. This is an invaluable set of context to have when investigating suspicious endpoint activity. The NVM’s ability to tie endpoint traffic telemetry to user, device, and process information furnishes XDR with a rich dataset from which to correlate events—a dataset that grows stronger and stronger as additional datapoints from Secure Endpoint and other platforms are added. The unique ID created for NVM telemetry is linked to unique IDs associated with logs from other products, enhancing XDRs capability to track activity across multiple event sources and associate them back to a specific endpoint. All told, the integrations between NVM and XDR represent an evolution in visibility for the endpoint and a powerful new tool for incident correlation.
Ransomware and other cybersecurity threats are evolving rapidly. Zero-day attacks represent the greatest threat to most organizations. Cloud-based, real-time threat intelligence enables IT teams to deploy the most up-to-date countermeasures as quickly as possible when new threats emerge, and leverage security expertise that extends well beyond their organization.
Threat intelligence maps directly to ATT&CK mitigation M1909 which protects against techniques such as exploitation for credential access (T1212), exploitation for defense evasion (T1211), exploitation for privilege escalation (T1068) and exploitation of remote services (T1210).
The Cisco Talos Group (Cisco Threat Intelligence Group) analyzes millions of malware samples and terabytes of data per day, and pushes that intelligence to Cisco products, providing 24/7 protection. Also, advanced sandboxing capabilities perform automated static and dynamic analysis of the unknown files against 500+ behavioral indicators to uncover stealthy threats.
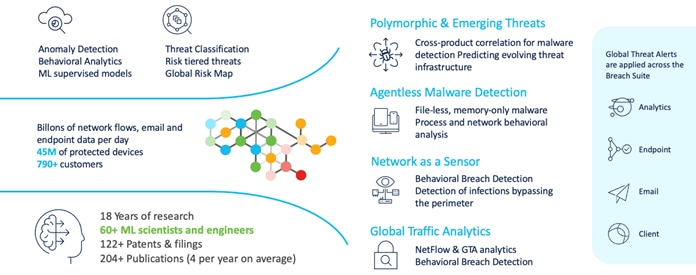
Global Threat Intelligence for Breach Protection Suite Products
Through the combination of both Talos and Cisco Secure Malware Analytics threat analysis engines, suspicious email attachments and files can be sandboxed, analyzed, and categorized as malware or ransomware in as quickly as 20-30 minutes. However, low prevalence files may take a slightly longer time to analyze and identify, to minimize the chance of false positives on the analysis.
Incident Investigation can be broken up into two main pillars:
● Incident response - address and manage the aftermath of an attack in your environment by aggregating multiple security technologies for a holistic investigation and remediation
● Threat hunting - Proactively search for active threats in your environment with a holistic, integrated approach by aggregating visibility and insight from multiple security technologies
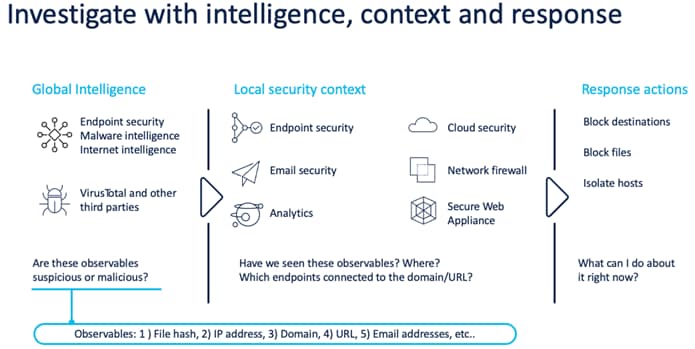
Cisco XDR Threat Response
Cisco XDR provides both investigation and incident response capabilities. It simplifies threat hunting and incident response by accelerating detection, investigation, and remediation of threats. Cisco XDR provides your security investigations with context and enrichment by connecting all of the Cisco security solutions that have been described in this document (along with other Cisco Security solutions that are out of scope) and integrating with third-party tools, all in a single console.
Cisco Breach Protection Suite Deployment
| Product |
Version |
| Cisco Secure Client Cloud Management |
1.0.1.400 |
| Cisco Network Visibility Module |
5.1.0.136 |
| Cisco Secure Client |
5.1.0.136 |
| Cisco Secure Email Threat Defense |
N/A |
| Cisco Secure Endpoint Module |
8.1.7.21585 |
| Cisco Secure Network Analytics |
7.4.2 |
| Cisco Umbrella Module |
5.0.4027.0 |
| Cisco XDR |
2.0 |
Cisco XDR Breach Protection Suite Integrations
Integrate Secure Endpoint with Cisco XDR
Step 1. In Cisco XDR, navigate to Administration > Integrations.

Step 2. Find Secure Endpoint from the available Cisco Integrations, then click Enable.
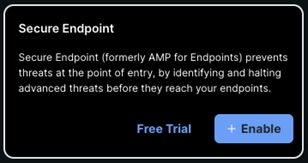
Step 3. Login to your Secure Endpoint Cisco Security account to allow Secure Endpoint to integrate with Cisco XDR.
Step 4. You can confirm that Secure Endpoint has been added by returning to the Administration > Integrations page, expanding My Integrations, and confirming that Secure Endpoint is listed and Connected.
![]()
![]()
Integrate Secure Malware Analytics with Cisco XDR
Step 1. In the Secure Malware Analytics GUI, click the dropdown next to your user name in the top right and then click on My Malware Analytics Account.

Step 2. Locate the API section and click on the copy icon to copy the API Key.

Step 3. In Cisco XDR, navigate to Administration > Integrations.

Step 4. Find Secure Malware Analytics from the available Cisco Integrations, then click Get Started.
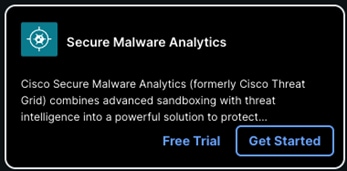
Step 5. Scroll down to the Add Integration section. Enter a name for the integration, click the URL dropdown arrow to select a region, and paste the API Key collected in step 2 into the API Key field. The Create Dashboard option can be checked or unchecked, dashboard creation steps are given in the next section. Click Add.
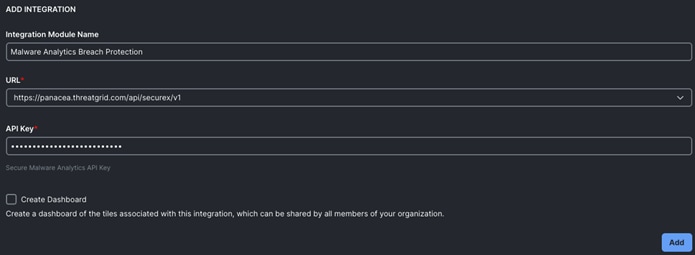
Step 6. You can confirm that Secure Malware Analytics has been added by returning to the Administration > Integrations page, expanding My Integrations, and confirming that Malware Analytics is listed and Connected.
![]()
![]()
Integrate Email Threat Defense with Cisco XDR
Step 1. From Cisco XDR, navigate to Administration > Integrations.

Step 2. From Integrations, either search for Email Threat Defense or scroll down to locate it. Click Enable.
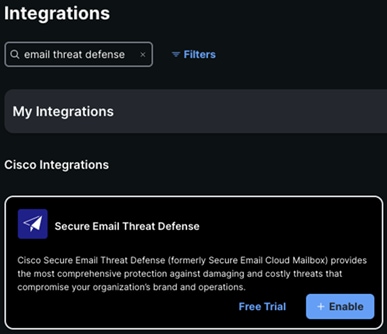
Step 3. Login to your Email Threat Defense account to allow ETD to integrate with Cisco XDR.
Step 4. You can confirm that Email Threat Defense has been added by returning to the Administration > Integrations page, expanding My Integrations, and confirming that Email Threat Defense is listed and Connected.
![]()
Integrate Secure Network Analytics with Cisco XDR
The integration between SNA and Cisco XDR is a multi-phase process that requires an API client and registration to Cisco Secure Services Exchange. The following steps will walk you through the entire process.
Register the Secure Network Analytics Manager with Cisco Secure Services Exchange
Step 1. Before integrating Secure Network Analytics with Cisco XDR, the Secure Network Analytics Manager must first be registered with Cisco Security Services Exchange. Use the following link to register or confirm registration:
https://admin.sse.itd.cisco.com/login
Step 2. If the Secure Network Analytics Manager is not already in the Devices list, click the + icon to add it.

Step 3. Set the number of devices equal to the number of Secure Network Analytics Managers to add and click Continue.
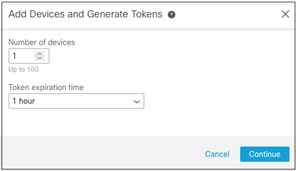
Step 4. Copy the token.
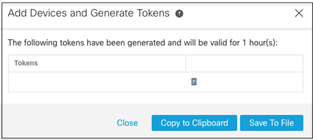
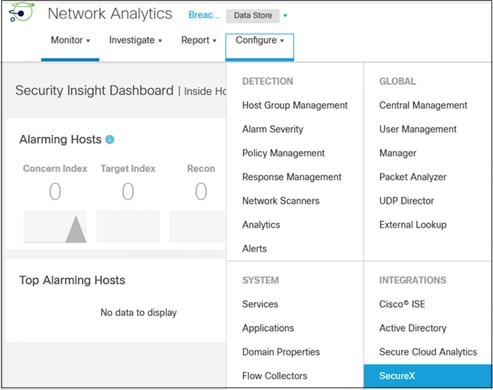
Step 5. Log in to the Secure Network Analytics Manager GUI and click on Configure > Integrations > SecureX (Note: XDR is designed to work with the legacy SecureX integration in SNA; this area of config will be updated in a future release of SNA).
Step 6. In the Device Registration section click on New Device Registration.

Step 7. Confirm the Cloud Region, enter the token that you copied earlier into the Device Token field, then click Save.
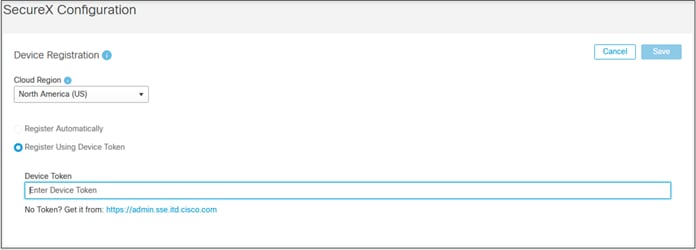
Step 8. The Device Registration section will show an Enrolled status if the registration is successful.

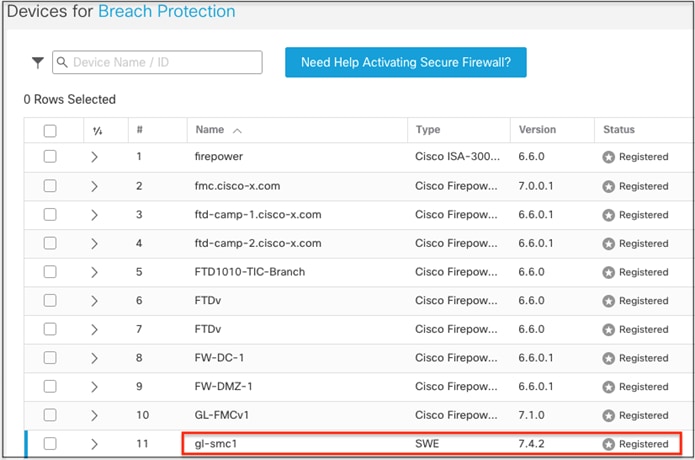
Step 9. If desired, return to Security Services Exchange and verify that the Secure Network Analytics Manager now appears in the device list.
Create an API Client for Secure Network Analytics
Step 1. We’ll now configure an API client within Cisco XDR for SNA. Please review the following from the XDR documentation:
![]()
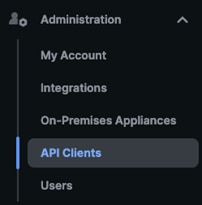
Step 2. Within the Cisco XDR GUI, navigate to Administration > API Clients.
Step 3. Click on Generate API Client.

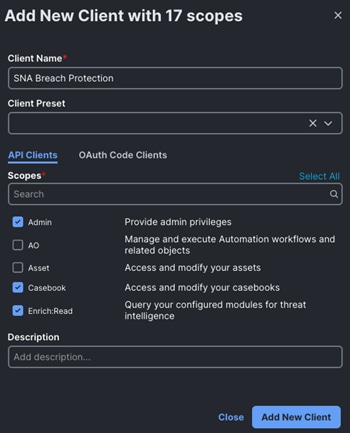
Step 4. Give the client a name and select the following under Scopes.

Note: The required list of permissions above can be found on pages 17 and 18 of the SNA 7.4.2 SecureX_Integration_Guide.
Step 5. Click on Add New Client when finished.
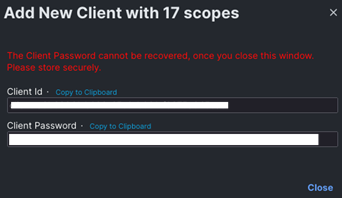
Step 6. A new popup will open. Copy the Client Id and Client Password. It’s recommended to leave the page open until integration is complete.
Step 7. Log in to the SNA Manager GUI and navigate to Configure > Integrations > SecureX.

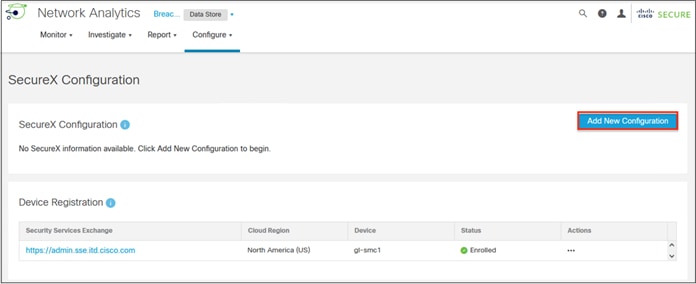
Step 8. Click on Add New Configuration in the SecureX section.
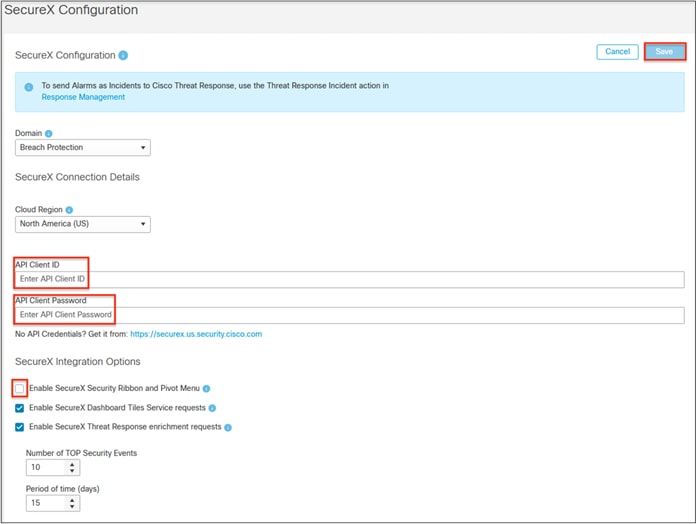
Step 9. Paste the Client ID and Client Password into their respective fields. Confirm Domain and Cloud Region are correct. The SecureX Security Ribbon and Pivot Menu can also be disabled. Click Save.
Step 10. The API integration should now show as Connected.

Finish Integration of Secure Network Analytics with Cisco XDR
Step 1. Return to the Cisco XDR GUI and navigate to Administration > Integrations.

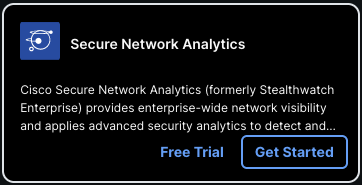
Step 2. From Integrations, either search for Secure Network Analytics or scroll down to locate it. Click Get Started.
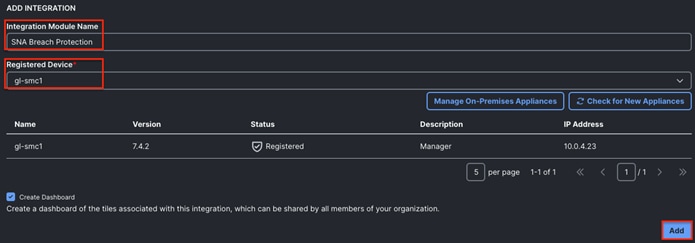
Step 3. Scroll down to the Add Integration section. Enter the Integration Module Name. Under Registered Devices, select the Secure Network Analytics Manager that was registered to Security Services Exchange in the prior section. Check the box for Create Dashboard if desired, then click Add.
Step 4. You can confirm that Secure Network Analytics has been added by returning to the Administration > Integrations page, expanding My Integrations, and confirming that Secure Network Analytics is listed and Connected.
![]()
![]()
Additional Cisco XDR Integrations
Cisco XDR integrates with many additional 3rd party and Cisco security products beyond the products in the Breach Protection Suite. This guide covers one popular additional integration, Umbrella, which adds DNS security capabilities and supplements the Secure Client. Cisco XDR offers flexibility for end users to seamlessly integrate additional products with the extensive core capabilities of the Breach Protection Suite.
Integrate Umbrella with Cisco XDR
Step 1. After logging in to the Umbrella Dashboard, copy the Organization ID within the URL. This is the value from the Umbrella browser URL between /o/ and /#/. This will be used for the Umbrella Organization ID in Cisco XDR.
![]()
Step 2. In the Umbrella Dashboard, navigate to Investigate > API Keys.
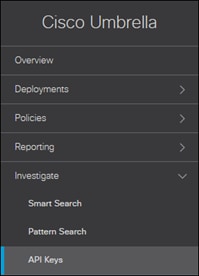
Step 3. Click Create New Token.

Step 4. Provide an appropriate name for the API Key then click Create.

Step 5. Copy and save the Access Token value for later. This will be used for the Umbrella Investigate API Token in Cisco XDR.

Step 6. In the Umbrella Dashboard, navigate to Policies > Policy Components > Integration Settings.
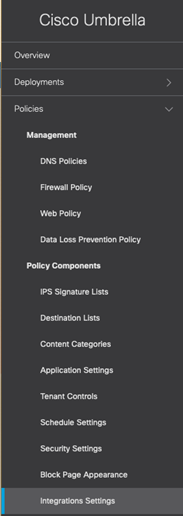
Step 7. Click Add.
![]()
Step 8. Provide an appropriate name then click Create.

Step 9. Click the newly created integration.
![]()
Step 10. Click the slider to set Integration Enabled, copy and save the URL, then click Save. The URL will be used for the Umbrella Enforcement Custom Umbrella Integration URL in Cisco XDR.
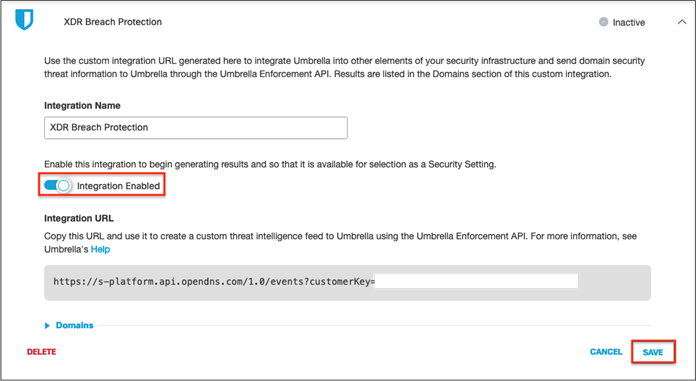
Step 11. The integration should change to Active.
![]()
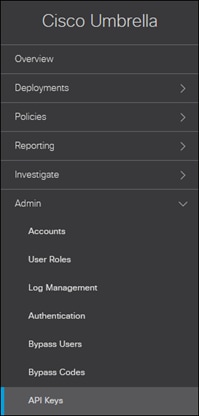
Step 12. In the Umbrella Dashboard, navigate to Admin > API Keys.
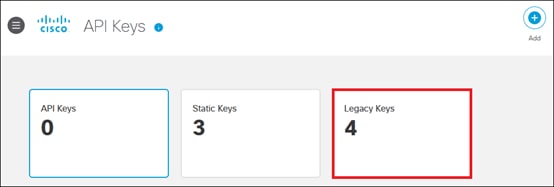
Step 13. Click Legacy Keys.
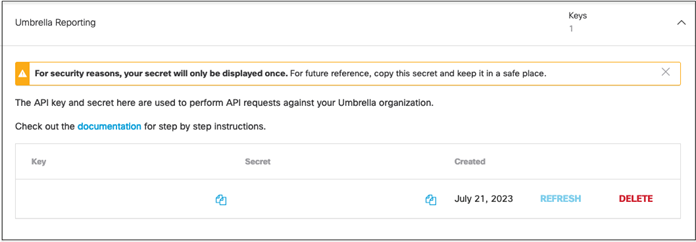
Step 14. Click Umbrella Reporting, then click Generate Token.

Step 15. Copy and save the Key and Secret values. These will be used for the Umbrella Reporting API Key and API Secret in Cisco XDR.
Step 16. Click Umbrella Management, then click Generate Token.

Step 17. Copy and save the Key and Secret values. These will be used for the Umbrella Management API Key and API Secret in Cisco XDR.
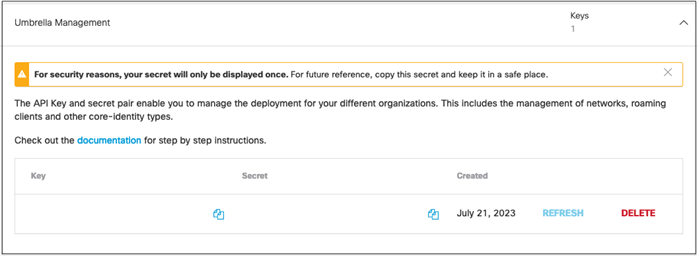
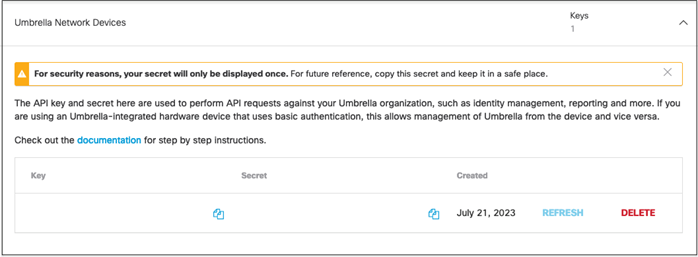
Step 18. Click Umbrella Network Devices, then click Generate Token.

Step 19. Copy and save the Key and Secret values. These will be used for the Umbrella Network Devices & Policies API Key and API Secret in Cisco XDR.
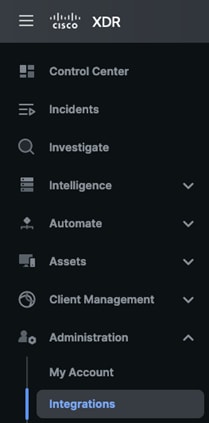
Step 20. In the Cisco XDR Dashboard, navigate to Administration > Integrations.
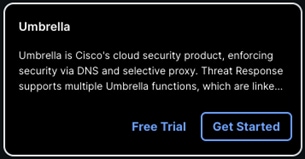
Step 21. Find Umbrella from the available Cisco Integrations then click Get Started.
Step 22. Enter an Integration Module Name.
Step 23. In the Organization ID field, paste the number copied from the browser URL bar in step 1.
Step 24. In the Investigate API Token field, paste the Access Token obtained in step 5.
Step 25. In the Enforcement Custom Umbrella Integration URL field, paste the integration URL obtained in step 10.
Step 26. In the Reporting API Key and API Secret fields, paste the Key and Secret values obtained in step 15, respectively.
Step 27. In the Management API Key and API Secret fields, paste the Key and Secret values obtained in step 17, respectively.
Step 28. In the Network Devices & Policies API Key and API Secret fields, paste the Key and Secret values obtained in step 19, respectively.
Step 29. The option to Create Dashboard can be checked or unchecked. The next section will cover manual dashboard creation.
Step 30. Click Add.
Step 31. You can confirm that Umbrella has been added by returning to the Administration > Integrations page, expanding My Integrations, and confirming that Umbrella is listed and Connected.
![]()
![]()
Step 1. From the Control Center, click on Edit Dashboards.

Step 2. Click on Create new dashboard.

Step 3. Name the dashboard and click on Add All across from any of the integrations you created in the prior section. Alternatively, you can click the dropdown arrow and select specific tiles. Click Save.
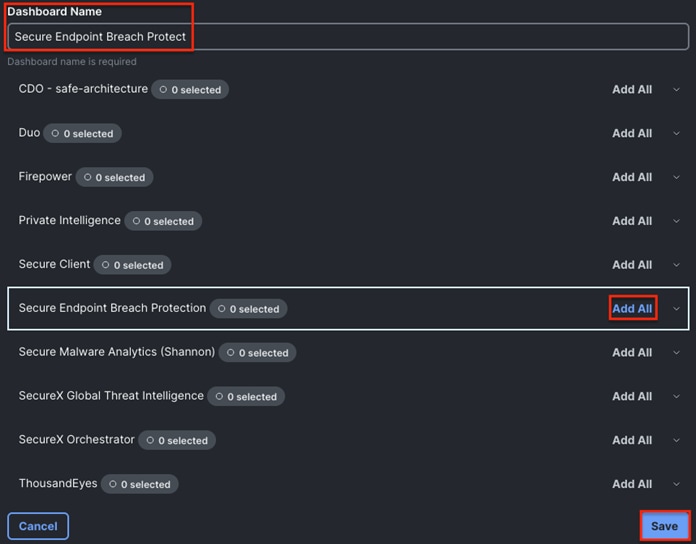
Step 4. The new dashboard will now be accessible from the Control Center.

Step 5. Repeat the dashboard creation process for any other integrations.
Deploy Secure Client with Cloud Management from Cisco XDR
This section provides example configuration for the following:
● Secure Endpoint base configuration
● Secure Endpoint Group configuration, which is automatically imported into Cisco XDR
● Network Visibility Module configuration
● Combining all of the above into a Cloud Managed Secure Endpoint deployment in Cisco XDR
● Deploying the configuration on an endpoint
The configurations in this section are provided as general guidelines that can be used to complete the validation testing sections later in this guide. Organizations should perform a full review of the capabilities for Secure Endpoint and tailor the configuration to their security needs and objectives. Some additional resources for configuration are provided below:
The Secure Endpoint Deployment Strategy guide is a comprehensive starting document that contains links to additional resources.
The Zero Trust: User and Device Security Design Guide covers a broad range of design and configuration topics, including the following:
· Many organizations will want to automate provisioning of Cisco Secure Client. The Provisioning section contains steps for using Meraki MDM (Mobile Device Management) as a solution. Deploying Duo Device Health is also covered in the same section.
· Configuration of additional modules including AnyConnect VPN, Network Access Manager (NAM), and Identity Services Engine (ISE) Posture are included in the CSC Preliminary Setup section.
Lastly, users who have both the Breach Protection Suite and Umbrella may wish to deploy Umbrella with Secure Client. For alternative Secure Client configuration steps that include Umbrella, please proceed to Appendix B – Deploy Umbrella with Secure Client after completing the Secure Endpoint Configuration section below.
Cisco Secure Endpoint (Formally AMP for Endpoints) is a cloud-managed endpoint security solution that prevents cyber-attacks and rapidly detects, contains, and remediates malicious files on endpoints. Cisco Secure Endpoint contains a comprehensive database of every file that it has seen and maintains a corresponding good or bad disposition. As a result, known malware is quickly and easily quarantined at the point of entry without any processor-intensive scanning.
This section covers a basic setup for a Windows Secure Endpoint agent. For more comprehensive documentation that includes other endpoints, please see the Secure Endpoint Deployment Strategy guide.
Policies determine how Secure Endpoint behaves on the device. For example, how Secure Endpoint responds to suspicious files, specific exclusions, or how often it checks for updates.
Step 1. In the Secure Endpoint console, navigate to Management > Policies.
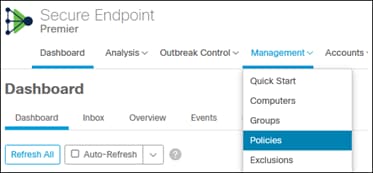
Step 2. Click New Policy.
![]()
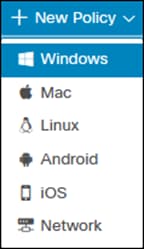
Step 3. Select Windows from the dropdown.
Step 4. Add a Name and select Conviction Modes for the policy. You can also use Cisco recommended settings on the right by clicking Apply Workstation Settings or Apply Server Settings.
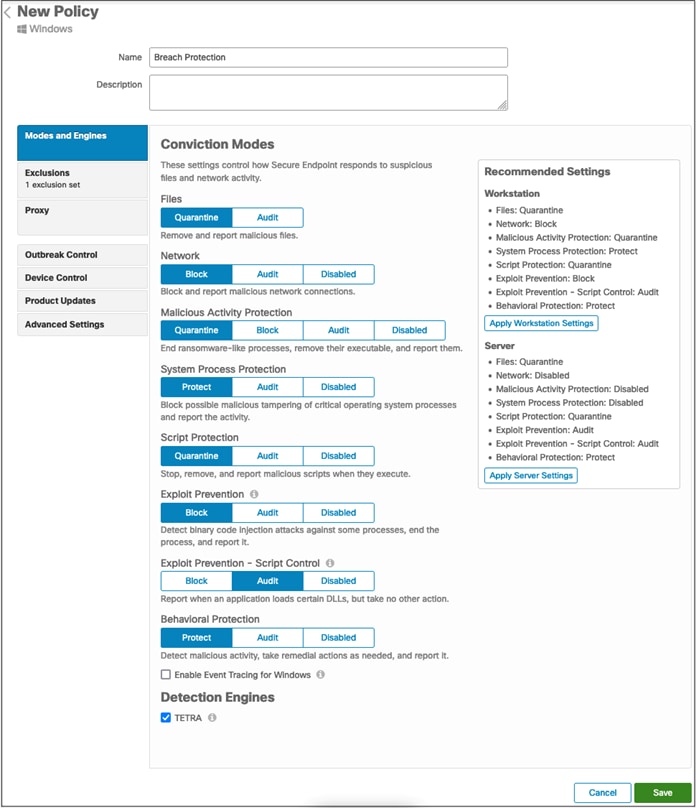
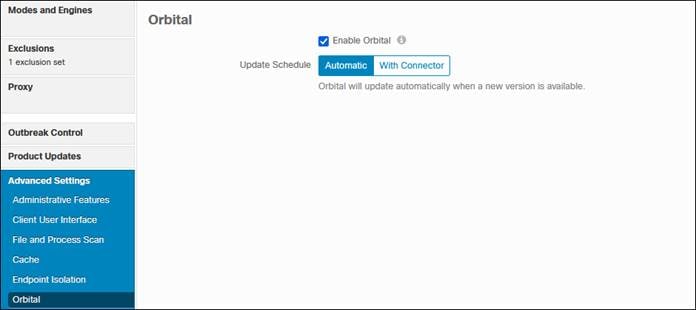
Step 5. Orbital is enabled by default; however, you can verify it will be installed by going to Advanced Settings > Orbital and ensuring Enable Orbital option is checked.
Step 6. Click Save.
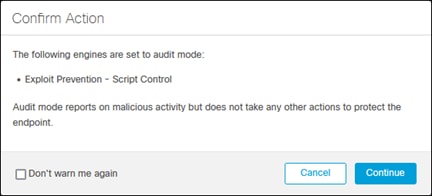
Step 7. Confirm the audit setting for Exploit Prevention – Script Control, or return and set it to Block if preferred. Click Continue.
Creating Groups
Once a policy is created, it must be applied to a Group before it can be assigned to a computer.
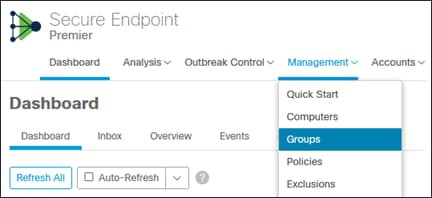
Step 1. In the Secure Endpoint console, navigate to Management > Groups.
Step 2. Click Create Group.

Step 3. Give the group a relevant name and select the policy that will be used for each operating system. In this design guide, the Breach Protection policy created in the prior section will be used for the Windows Policy.
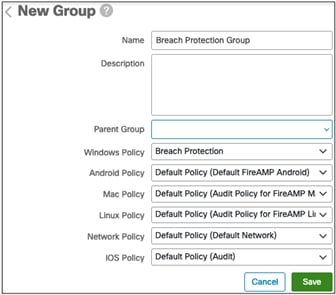
Step 4. Click Save.
Secure Client with Cloud Management Configuration
Step 1. Within Cisco XDR, navigate to Client Management > Deployments.
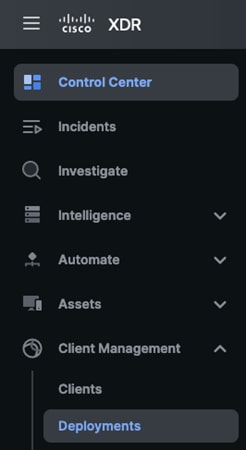
Step 2. Click the Create New button.
![]()
Step 3. The New Deployment page has multiple areas of config, which we’ll cover one at a time from the top. The first area of config is Cloud Management. Set the preferred version and specify a Cloud Management Profile. This guide will use the Default Profile, which sets logging to Error level and allows updates at any time of day.

Note: If you would like to create a new Cloud Management Profile or review available settings, this can be done via Client Management > Deployments > Create New.
Step 4. Under Secure Endpoint, select the desired version under Version control. Click the drop-down arrow for Choose an Instance and select your Secure Endpoint Cisco XDR integration.

Step 5. With the Instance set, click on Choose a Group and select the Secure Endpoint group configured previously. The final configuration will look like the screenshot below.

Step 6. Under Secure Client, set the desired version. We’ll also enable the Network Visibility Module and set the profile as the NVM Cloud Default Profile. The NVM Cloud Default Profile will automatically send logs to Cisco XDR via an encrypted HTTPS connection.
Note: if you would like to send NVM data to a different collector, you can configure a custom profile via Client Management > Profiles > Create New.
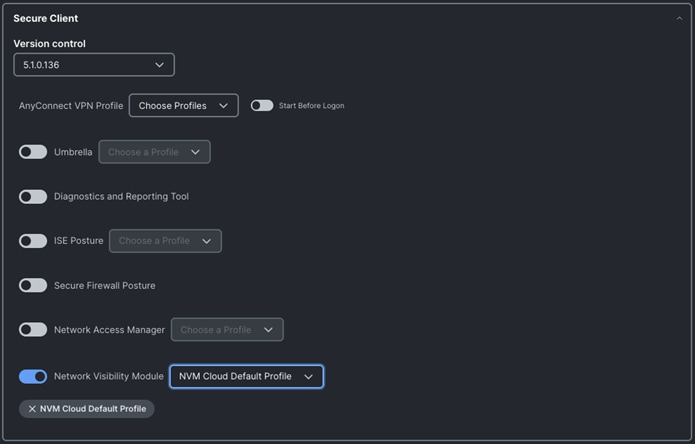
Step 7. Scroll back to the top of the page and give the Deployment a meaningful name. Click the Save button.

Most organizations will have an existing method of endpoint management that can be used to provision Secure Client. This section will cover a manual installation procedure that can be used for testing, or for small organizations.
Step 1. From Cisco XDR, navigate to Client Management > Deployments.

Step 2. Click the ellipses for the deployment configuration created in the prior section and select Full Installer.

Step 3. After the Full Installer downloads, transfer it to the endpoint(s), and run the file to install.

Step 4. Click Continue to proceed with the installation.
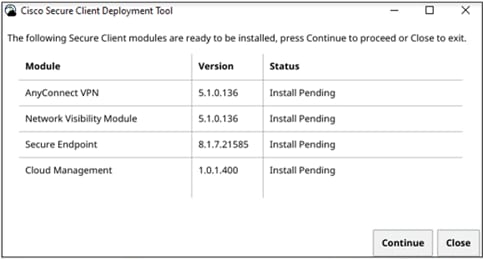
Step 5. Click Close when the installation is complete.
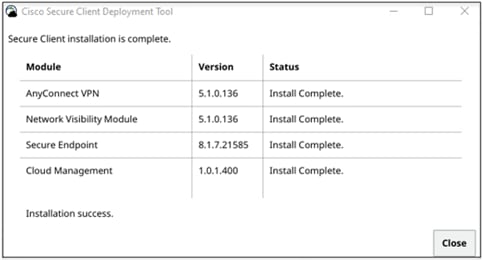
Note: it may take a few minutes for Secure Endpoint to fully connect.
This section focuses on deploying Email Threat Defense with Office 365. For steps to configure Email Threat Defense with Secure Email Gateway (SEG) and for other general instructions, please see the Cisco Secure Email Threat Defense User Guide. Note: The pre-requisites of this guide are a Microsoft 365 account with Global Admin rights and an email address capable of receiving undeliverable journal reports. The email address used will not be journaled; do not use an address you want Cloud Mailbox to analyze.
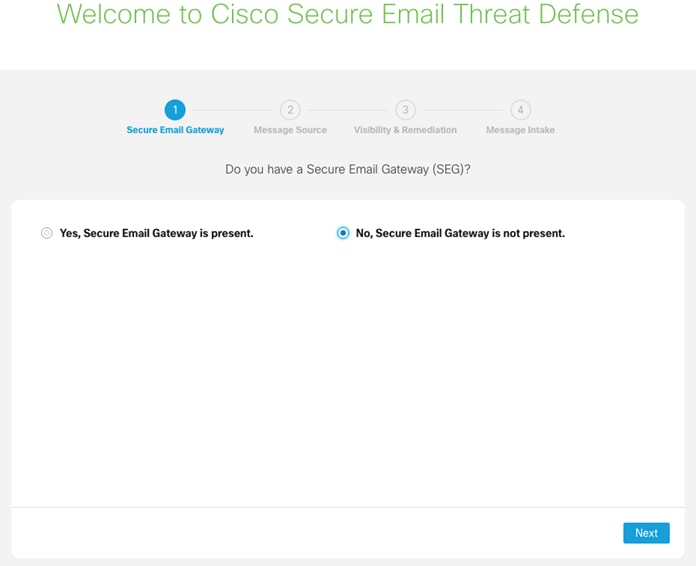
Step 1. Select whether or not your deployment has a Secure Email Gateway configured. If no Secure Email Gateway is set, Office365 is assumed as the message source. Click Next.
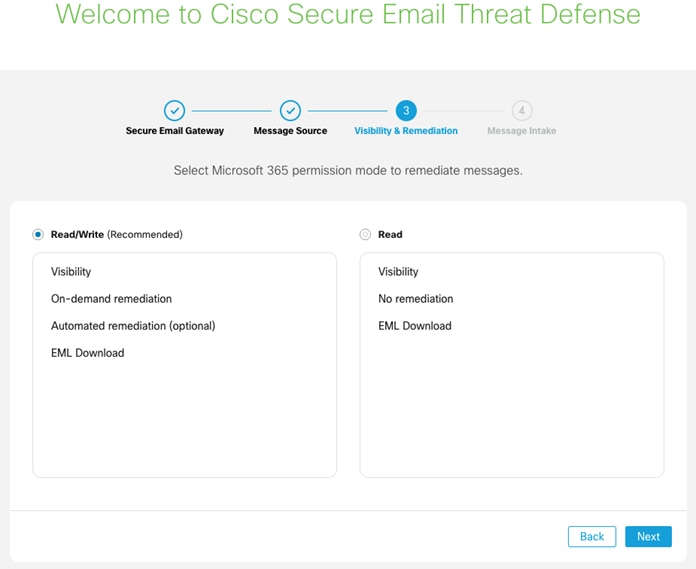
Step 2. Select the permissions for Email Threat Defense. Note that Read/Write is needed for remediation functionality. Click Next.
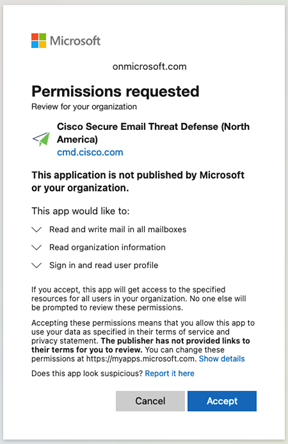
Step 3. Email Threat Defense will prompt you to log into the associated Office 365 account. Note that the user who signs into Office 365 should have admin privileges. After you authenticate, Office 365 will generate a prompt asking you to confirm granting Office 365 permissions to Email Threat Defense. Click Accept to proceed.
Step 4. Email Threat Defense will display a confirmation page after the permissions have been granted. Copy the Journal Address that is shown on this page.

Step 5. Go to your Microsoft Purview compliance portal: https://compliance.microsoft.com/homepage.
Step 6. Navigate to Solutions > Data lifecycle management > Exchange (legacy).
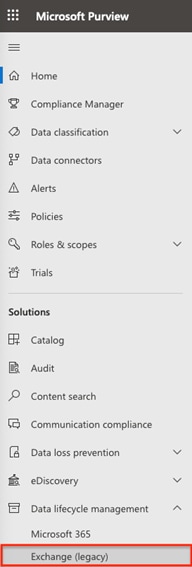
Step 7. Unless it is already configured, we should add an email address to accept undeliverable journal reports. Click on Settings.

Step 8. Enter the email address that will receive the undeliverable journal reports. Click Save.

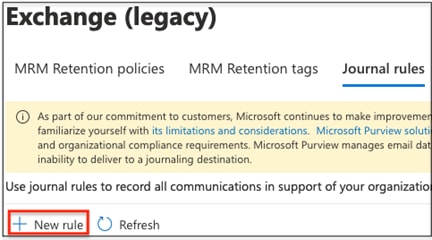
Step 9. Return to the Exchange (legacy) page and click on the Journal rules tab. Click on New rule.
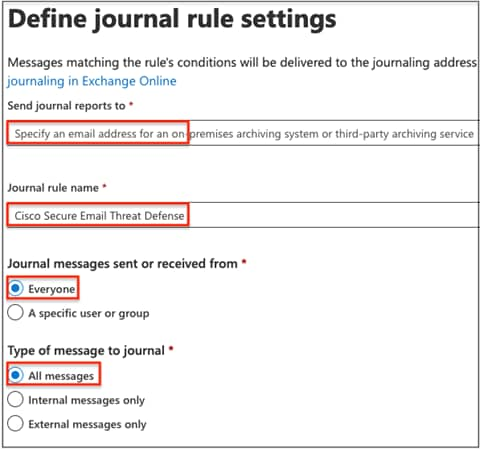
Step 10. In the Send journal reports to field, paste in the journal address copied from Email Threat Defense in step 4. Enter Cisco Secure Email Threat Defense as the Journal rule name, and select Everyone and All messages for the two radio buttons. Review the settings carefully before clicking Next.
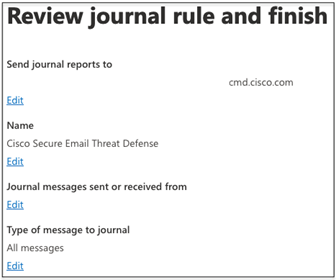
Step 11. Microsoft Purview will display a summary of the settings. Review them and click Submit at the bottom of the page.
Note: Purview left the Journal messages sent or received from field blank on the review page during testing, rather than displaying the expected value of Everyone.
Step 12. Microsoft Purview will display a confirmation page when the journal rule is complete.

Step 13. Return to Email Threat Defense, and log back in if the session timed out. Click on the Review Policy button.
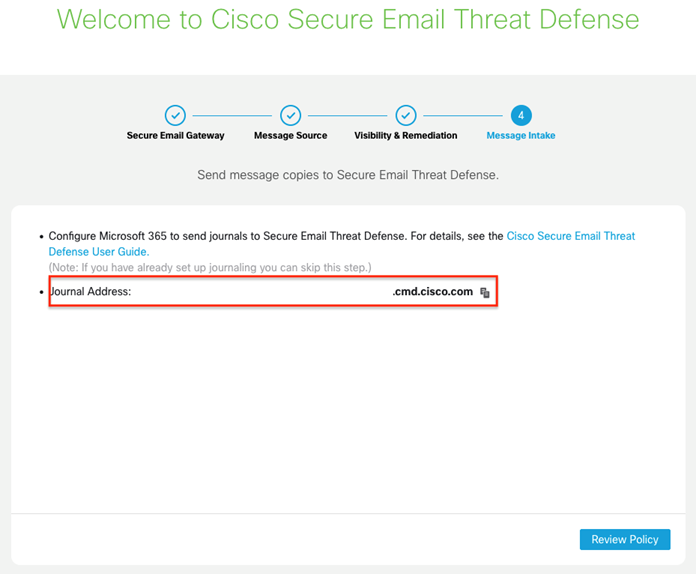
Step 14. With Office 365 now integrated, we can review and finalize Email Threat Defense settings. Click on the gear icon and select Policy.

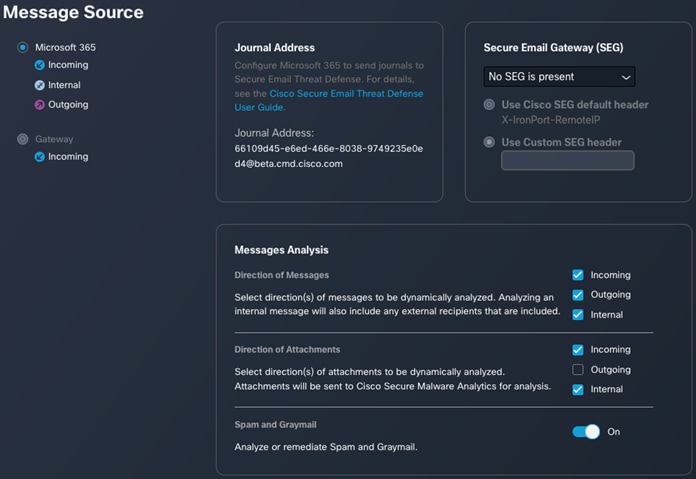
Step 15. Review the Message Analysis settings. Note that some directional attachment settings and spam/graymail are disabled by default but can be changed if desired. For this example, we will enable Spam and Graymail analysis and inspect attachments for both incoming and internal emails. However, note that while inspecting attachments for internal emails can prevent malicious files from being spread internally, it can also come with high overhead for larger organizations.
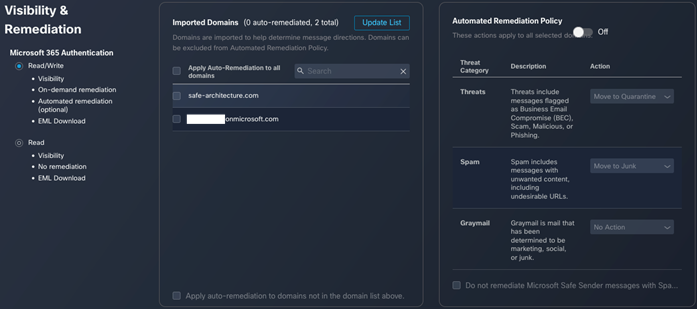
Step 16. Scroll down to configure Visibility & Remediation. On the left, confirm that Office 365 has the Read/Write capability configured earlier. Under Imported Domains, confirm that the domains associated with the Office 365 account have been imported. If they have not, click on the Update List button to initiate a pull request. Once the domains have been imported, the Automated Remediation Policy can be configured.
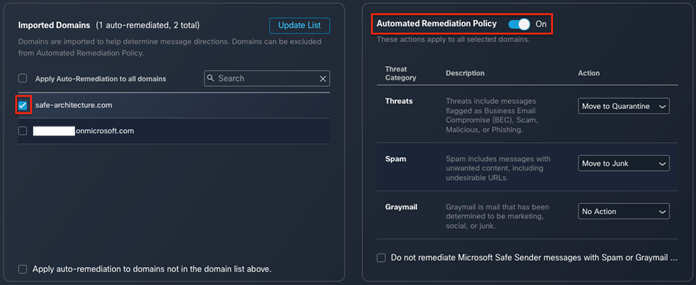
Step 17. Check the box next to any imported domains that should have Auto-Remediation. For this example, we will enable the safe-architecture.com domain for Auto-Remediation. Under Automated Remediation Policy, toggle the switch to On. By default, Threats will be moved to quarantine. Spam and Graymail have default settings that are grayed out, but these can be modified if the Analyze or remediate Spam and Graymail toggle switch covered in step 15 is enabled.
Step 18. When satisfied with the settings, click on Save and Apply in the top right.

Breach Protection Suite Validation Tests
The test cases given in this Cisco XDR section use lab generated data to provide an in-depth demonstration of the Incident and Remediation workflows in Cisco XDR. The validation test sections later in this guide for Secure Endpoint, Email Threat Defense, and Secure Network Analytics include steps for generating events in your own network for testing purposes.
If you would like to access the demo lab data for the test cases in this Cisco XDR section, please perform the following steps:
● Go to: http://cs.co/xdr-demo
◦ (an incognito or private browser with no pop-up blockers is recommended)
● Log into dCloud:
◦ User: [your Cisco username]
◦ Password: [your Cisco password]
● Click on the View button and wait for the demo to load.
◦ If you see a Single Sign On (SSO) tab open, ignore it. You want the script to run for the demo account
● Once the scripts run, if you don’t land on the Control Center, click Control Center on the left menu
Test Case #1 – Incident Manager Workflow
Step 1. In the Cisco XDR GUI, go to the Incidents page.
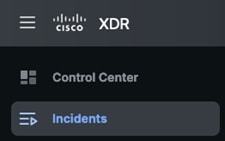
Step 2. The Incidents page shows a prioritized list of incidents from multiple sources. For this example, we’ll select the Suspected Malicious URL on ip-192-168-249-115 incident to open its summary.
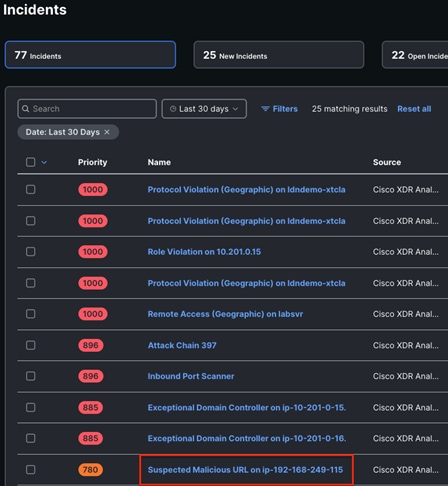
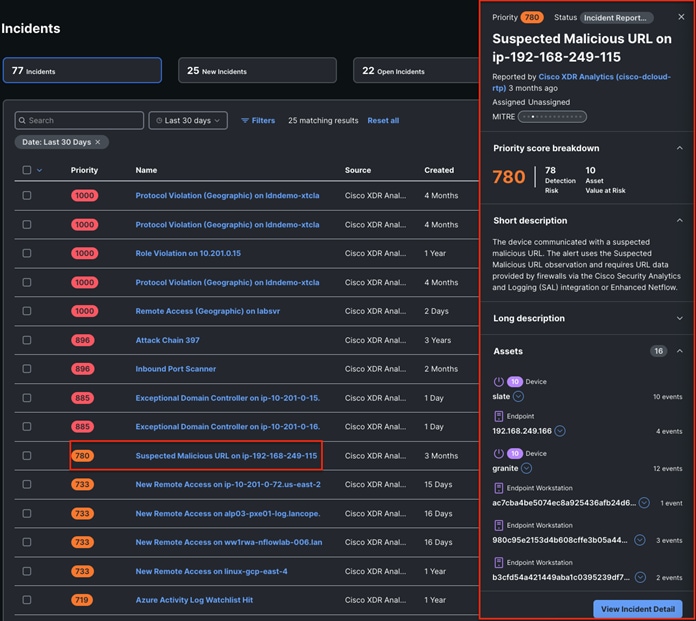
Step 3. The summary is an example of progressive disclosure—the delicate balance of providing the right amount of relevant information at the right time so an analyst can decide when to further the investigation and when to respond.
This incident suggests that one of our devices connected to a malicious URL, so we should use the summary data to look into it more extensively.
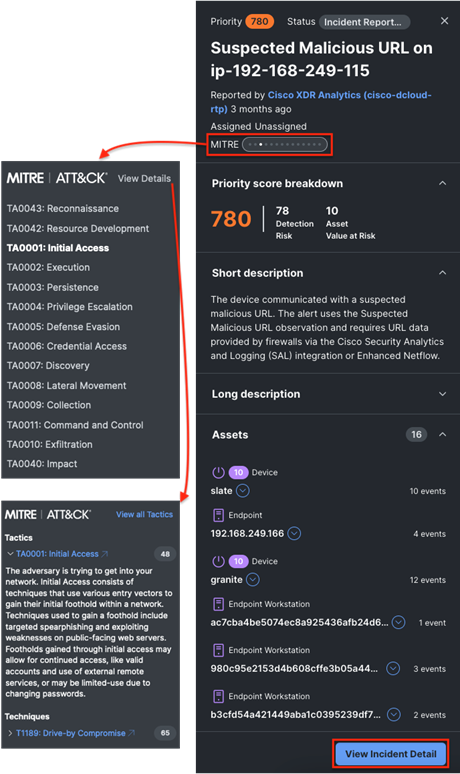
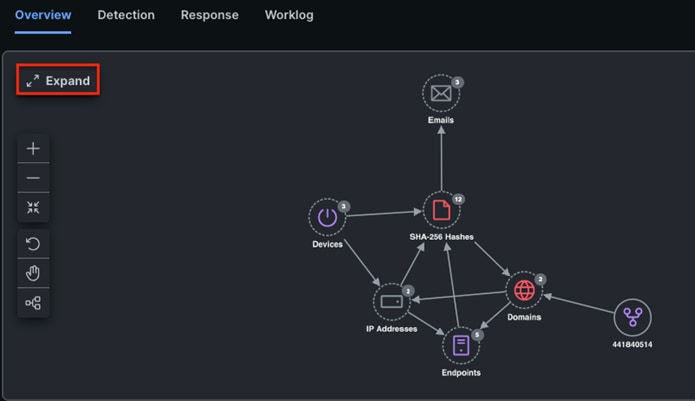
Step 5. The incident overview shows all the assets included in the incident and their relationships. The attack graph compresses the associated detections and provides a graphical view of the relations between the observables. This graph can be zoomed into, panned around, and the observables can be dragged and dropped. Objects are consolidated by type and can be expanded by double clicking on them.
● Assets are the endpoints, networks, hosts, users, and email addresses involved in the incident.
● Observables are the raw elements used as indicators in the reporting products, such as IP addresses, hostnames, file hashes, URLs, emails, file names, and so on.
● Indicators are the actual detections fired from the various security products.
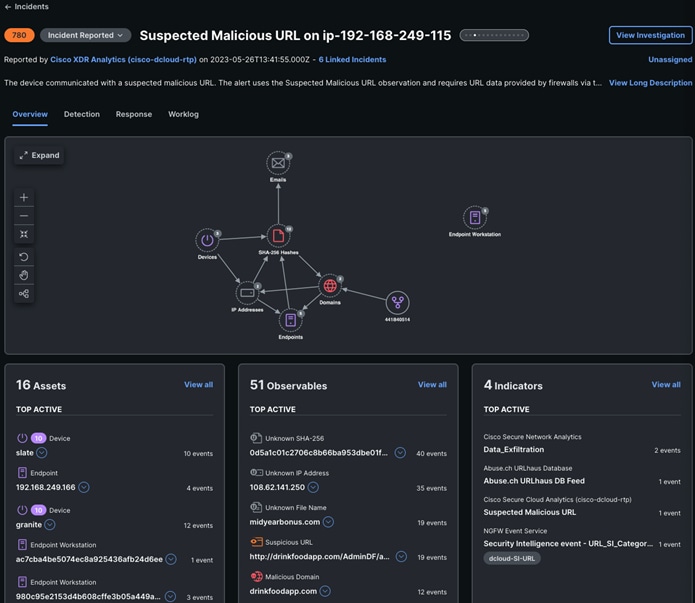
Step 6. In the Observables section, click on View all.
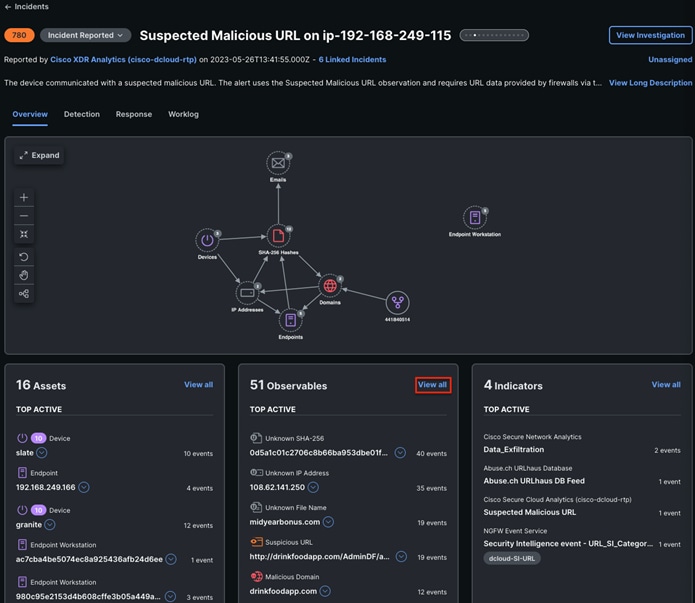
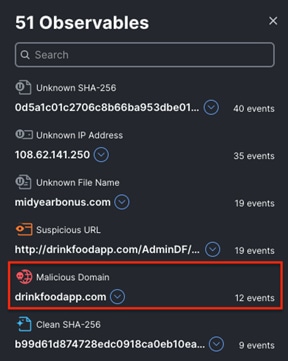
Step 7. The Observables panel will show data entries such as URLs, IPs, and file hashes that are associated with potentially malicious events. For this example, we will focus on the drinkfoodapp URL, which XDR has identified as a malicious domain.
Step 8. We’ll now use the attack graph to better understand the objects involved in the incident and their relationships. Click the Expand button (top left) on the graph to get a better look at the whole picture.
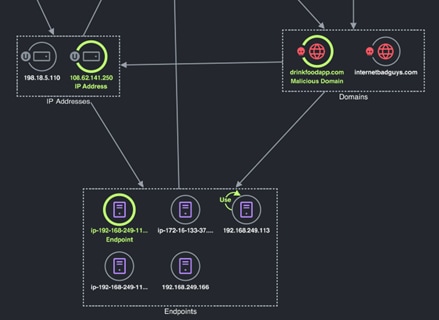
Step 9. If we expand a couple of the collapsed objects (by double clicking on them) and then hover over the malicious drinkfoodapp domain we saw before, we can see some relationships. We see that one of our endpoints (192.168.249.115) connected to this domain and that there’s a related IP address (108.62.141.250). This information helps identify who may have connected to the malicious domain and the IP address of the bad actor.
Step 10. Let’s move on to the Detection tab. This is where we can dig into the details of the events that are part of the incident. Click Collapse and then click on Detection.
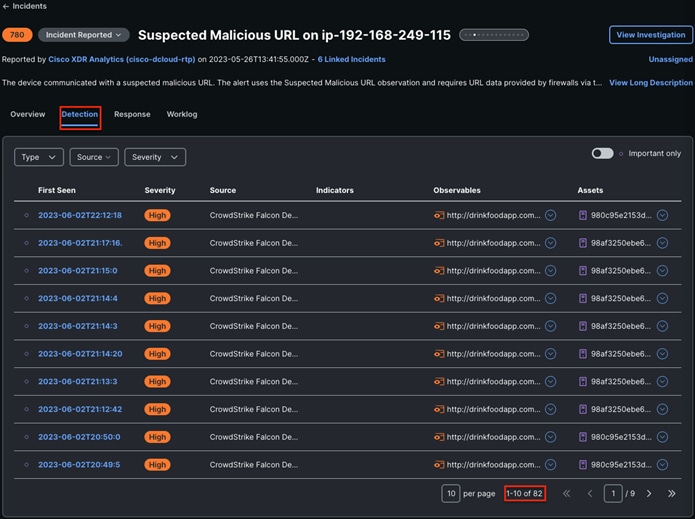
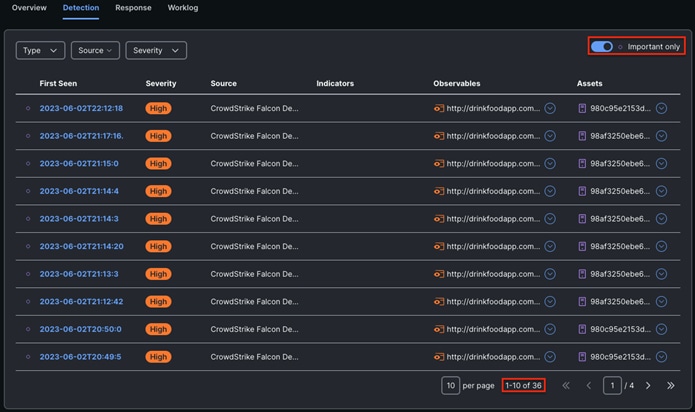
Step 11. This incident has 82 detections that came from various products integrated into Cisco XDR. To filter out some of the noise, let’s click the Important only toggle switch. This causes the detections list to be filtered to only show events that are of a higher severity or that have MITRE ATT&CK data. Toggling the switch reduces the number of events shown to 36 and saves us some time.
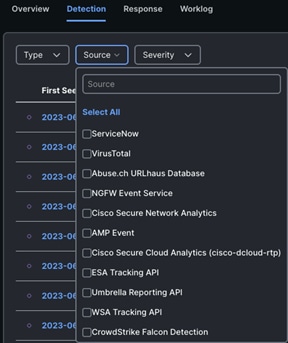
Step 12. We can also filter the events based on the source product they came from by clicking on the Source dropdown and selecting one or more sources.
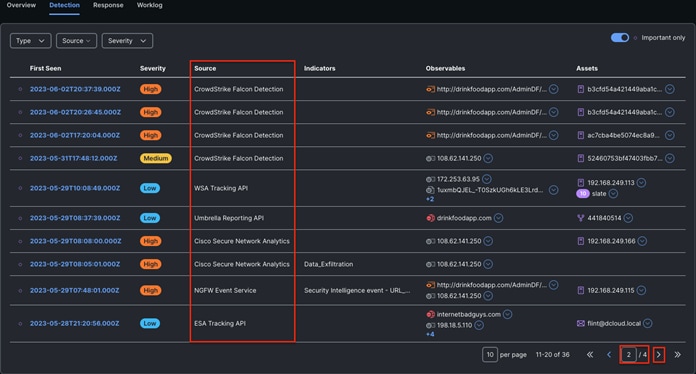
Step 13. Close the Source popup, click the forward arrow in the bottom right of the Detection page, and review the Source column data in the Detection page. We can see this incident has been enriched from multiple security controls such as firewalls, EDRs, cloud analytics, and email security. Data from 3rd party technologies like CrowdStrike are also included in this incident.
Test Case #2 – Investigate & Email Quarantine
By this stage, XDR has given us all the information we need to determine the “why, what, and when” of what happened. All from one UI, saving us time and effort to resolve the issue. Next, we can use the information we’ve gathered to apply a response.
Step 1. To view this incident in a full graphical view with a timeline, click View Investigation at the top right of the incident page.

Step 2. On the Investigation page, we see a similar graph to what we saw in the incident but with more data. This version of the graph can also be customized using multiple view modes. Explore the graph and hover over the various nodes to learn more about how they are related.
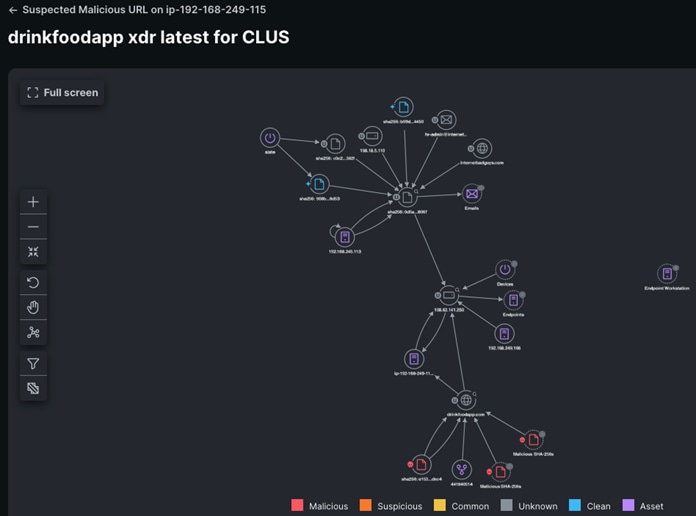
Step 3. The timeline below the graph allows us to customize the amount of information we see visualized. Using the handles on either side of the timeline, filter the data down to May 22, 2023. The number of nodes will go from 33 to 8.
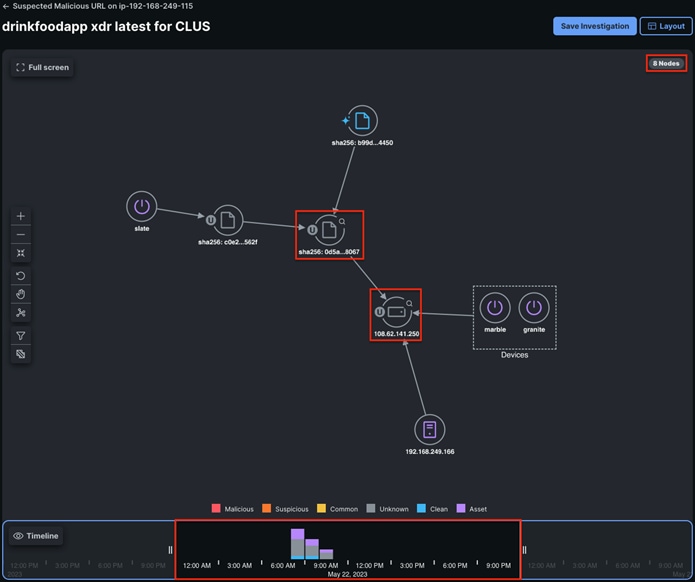
Step 4. From this view we can see multiple hosts connecting to the same .250 IP address we saw associated with the malicious drinkfoodapp URL in the last section. We can also see a file of unknown disposition associated with the .250 IP address. While an unknown file disposition isn’t a smoking gun, we do have enough information by now to be suspicious. Click on the sha256 file hash beginning with 0d5a.
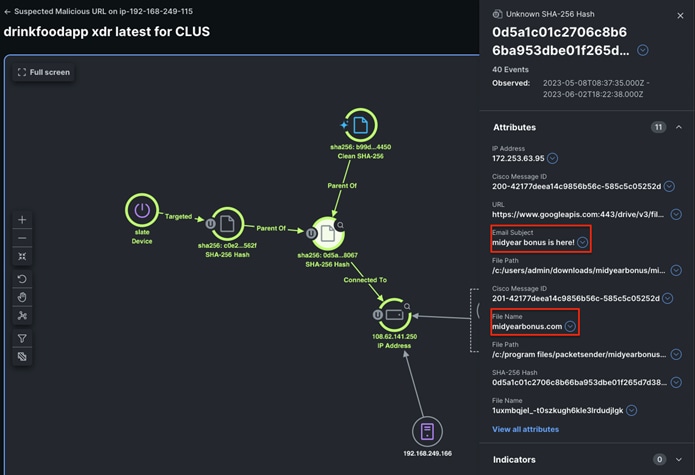
Step 5. Clicking on a file in XDR brings up a list of Attributes for the file. From here we can see that the file was delivered via email, and both the Email Subject and File Name are enough to further raise our suspicions—doubly so, if the timing or messaging doesn’t match our company’s internal bonus communication.
Step 6. There’s plenty more we’d like to know about this file—more details on the sender, a full list of recipients, sandbox analysis of the file, any endpoint security response, to name a few. However, this is a prime example of a point in an investigation where our priority may shift to containment. Click on the dropdown arrow next to the midyear bonus is here! Email subject and then click on Quarantine Messages. This will allow us to use the integration between Cisco XDR and Cisco Secure Email Threat Defense to quarantine emails with this subject line.
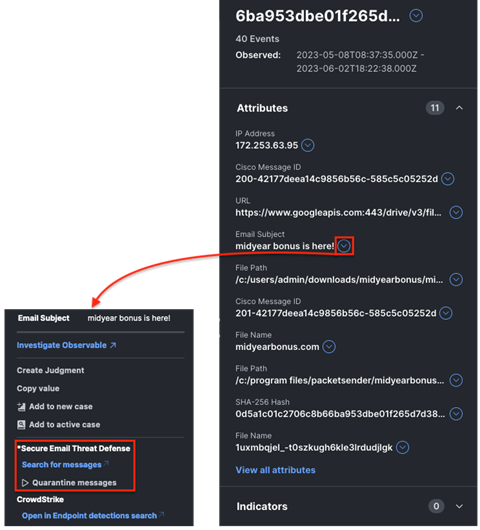
Step 7. Taking this action from Cisco XDR saves the analyst time since they don’t need to log into Email Threat Defense to search for and quarantine messages. In this demo, Cisco XDR will generate a pop-up stating that there is nothing to quarantine—seems another analyst beat us to the punch.
Step 8. Next, let’s go back to the incident by clicking on its name above the investigation name.

Test Case #3 – Incident Response & Host Quarantine
Step 1. We’ve used Email Threat Defense to take one response action against the email that introduced the suspicious file, but we still have endpoints in the environment that received the email and file attachement and thus may be compromised. Back in the incident, let’s go to the Response tab.

Step 2. The incident response playbook offers four phases you can walk through to identify and respond to an incident. Some of these actions provide guidance and the ability to create a note while others allow you to take actions using XDR Automation workflows.
Step 3. Click on the Containment tab and then expand Contain Incident: Assets.
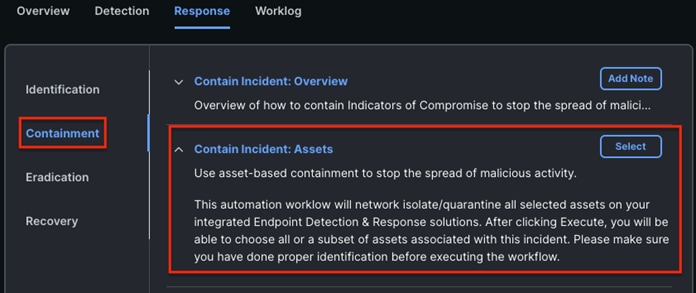
Step 4. This response action will locate the selected endpoints in a supported EDR product and request that they be isolated. In this case, we’re using Cisco Secure Endpoint so that’s where the workflow will look for endpoints.
Step 5. Click the Select button and then select the endpoint we identified earlier (ip-192.168.249.115). Click the Execute button to run the workflow.
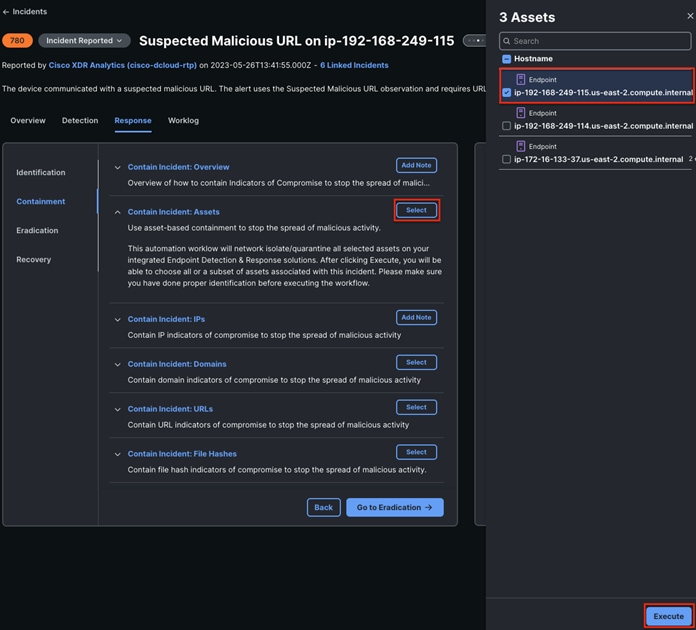
Step 6. The workflow will execute in the background and request that the selected hosts be isolated in Cisco Secure Endpoint.

Step 7. Once the workflow is running, you can go to the Worklog tab to see its progress and the result.

Test Case #1 – Malware Evasion Indication of Compromise (IoC)
Netsh is a command-line scripting utility that allows you to, either locally or remotely, display or modify the network configuration of a computer that is currently running. Port Forwarding is the technique of taking packets destined for a specific TCP or UDP port and machine, and forwarding them to a different port and/or machine. This is done transparently, meaning that network clients cannot see that Port Forwarding is being done. They connect to a port on a machine when in actual fact the packets are being redirected elsewhere.
Step 1. On a Windows device protected by Cisco Secure Endpoint, open the command prompt and enter the command below. Note: we were able to get this to fire without launching CMD as admin, but launch CMD as admin if the event doesn’t fire.
![]()
Step 2. In Cisco XDR, navigate to Intelligence > Events.
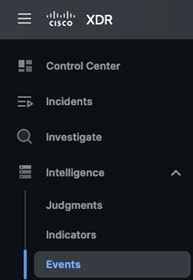
Step 3. Click on the Private tab and locate an event with the text W32.NetshFirewallPortForward.ioc.
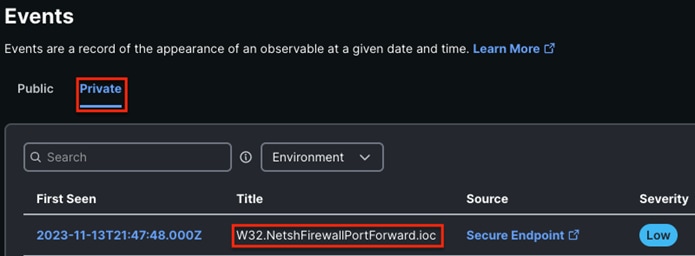
Step 4. If desired, you can click on the Secure Endpoint link under Source to view Device Trajectory and Event Details. Note that the description directly describes the command that was run, saving valuable research time. This event is associated with TA0005: Defense Evasion in the MITRE ATT&CK framework.
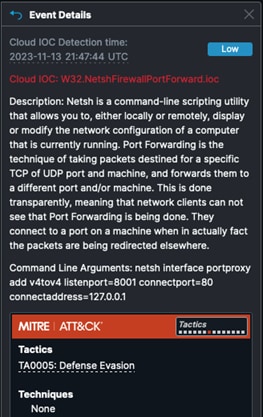
Test Case #2 – Endpoint Malware Defense
Cisco Secure Endpoint contains a comprehensive database of every file it has ever seen along with a corresponding good or bad disposition. As a result, known malware is quickly and easily quarantined at the point of entry without any processor-intensive scanning.
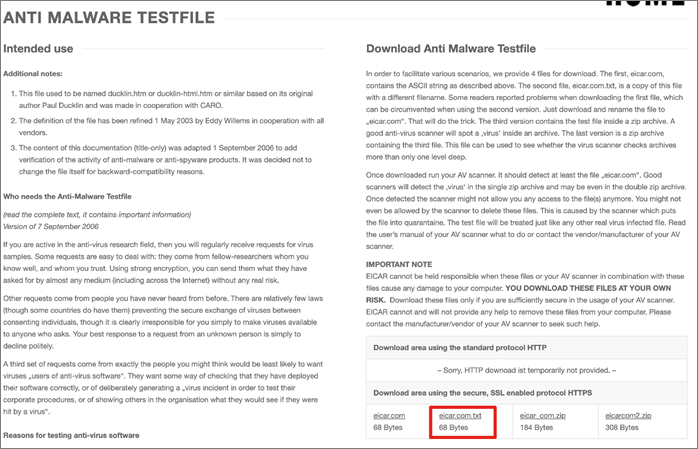
Step 1. Using a device protected by Cisco Secure Endpoint, navigate to eicar.org, then click on Download Anti Malware Testfile.

Step 2. Download the eicar.com.txt file onto the device using right-click, save link as.
Note: EICAR is safe to pass around, because it is not a virus, and does not include any fragments of viral code. It is a file that has been created for Anti-virus products to react to for test purposes. Also note that Cisco Umbrella can also block access to this file if you have it installed (depending on configuration).
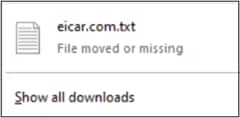
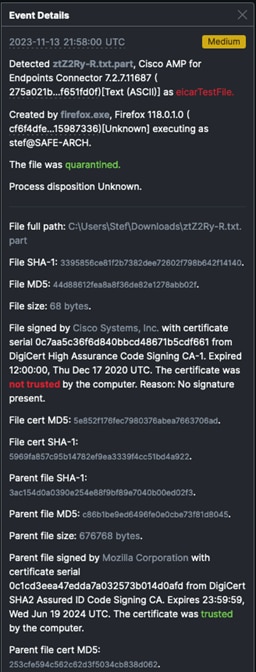
Step 3. Cisco Secure Endpoint can take several actions to contain the file, including blocking the download, stripping the payload (leaving an empty file in the download folder), or quarantining the file. The following screenshot from a Firefox download bar shows a file that was quarantined after download.
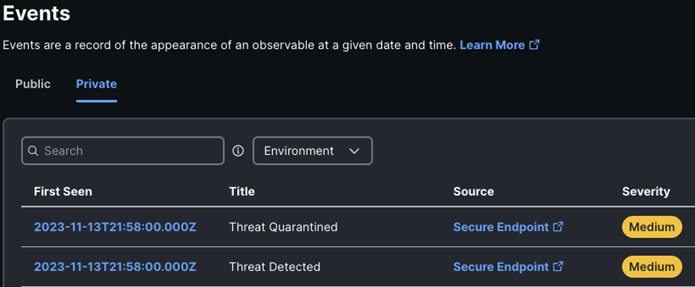
Step 4. In Cisco XDR, navigate to Intelligence > Events, then click the Private tab. Look for Detected or Quarantined events.
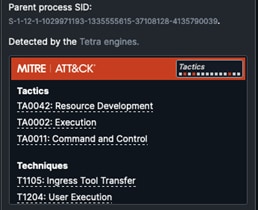
Step 5. Click on the Secure Endpoint link for an event to see more details. As shown below, the simulated piece of malware was associated with three Tactics and two Techniques from the MITRE ATT&CK framework.
Test Case #3 – Endpoint Malware Defense – In-Memory Protection
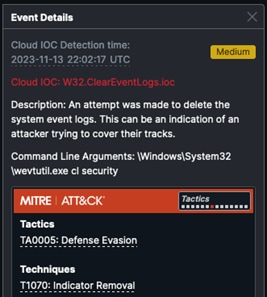
The wevtutil utility in Windows enables you to retrieve information about event logs and publishers. The command can also be used to install and uninstall event manifests, to run queries, and to export, archive, and clear logs. This can be an indication of an attacker trying to cover their tracks.
Step 1. On the Windows device protected by Cisco Secure Endpoint, open the command prompt and enter:
![]()
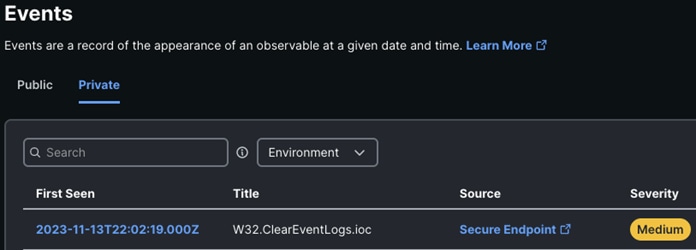
Step 2. In Cisco XDR, navigate to Intelligence > Events > Private. Look for an event that references W32.ClearEventLogs.ioc.
Step 3. Click on the Secure Endpoint link to get further details on the event.
Additionally, Bitsadmin is a command-line tool that can be used to create, download or upload jobs and monitor their progress. However, it can also be used to maintain persistence and evade checks for usual persistence mechanisms. An attacker with Administrator's rights can use the setnotifycmdline option to create a persistent job and then specify a /Resume option at a later time to execute the job. This mechanism allows the malware to survive reboots since the job is run repeatedly after a system restart. Bitsadmin by default downloads files unless the destination server is running IIS with the required server component and /UPLOAD is specified in the command-line. While this is not by itself malicious, the command-line needs to be reviewed to ascertain the origin and intent.
Step 1. On the Windows device protected by Cisco Secure Endpoint, open the command prompt as and enter:
![]()
Step 2. In Cisco XDR, navigate to Intelligence > Events > Private. Look for an event with the text W32.Bitsadmin.ioc.
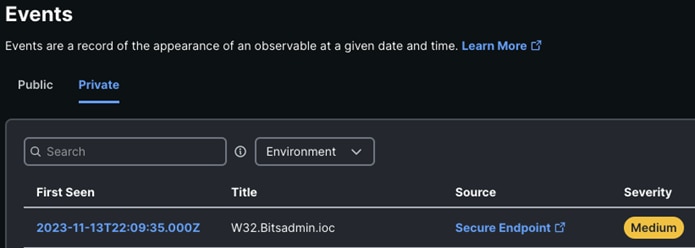
Step 3. Click on the Secure Endpoint link to review more details and the Tactics and Techniques.
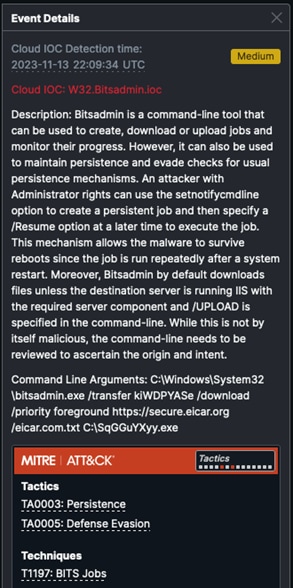
Test Case #4 – Cisco XDR Incident Correlation
Cisco XDR can generate an incident by correlating the events in the prior tests. After performing the prior tests, follow the steps below to review the correlated incident.
Step 1. From the Cisco XDR GUI, click on Incidents.
Step 2. Review the recent incidents and look for one from the endpoint that you performed the prior tests on. Note that Cisco XDR has given the incident a Priority score and that the incident is currently unassigned. Once located, click on the incident.

Step 3. Click on View Incident Detail.
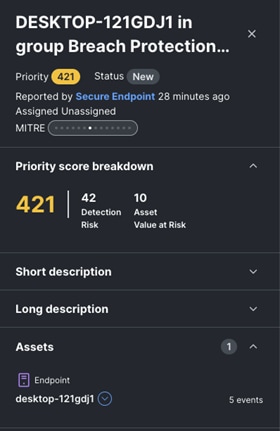
![]()
Step 4. The Overview tab shows information on the host that caused the incident, including any Observables (like the eicar file we downloaded) and Indicators (like the other events we generated).
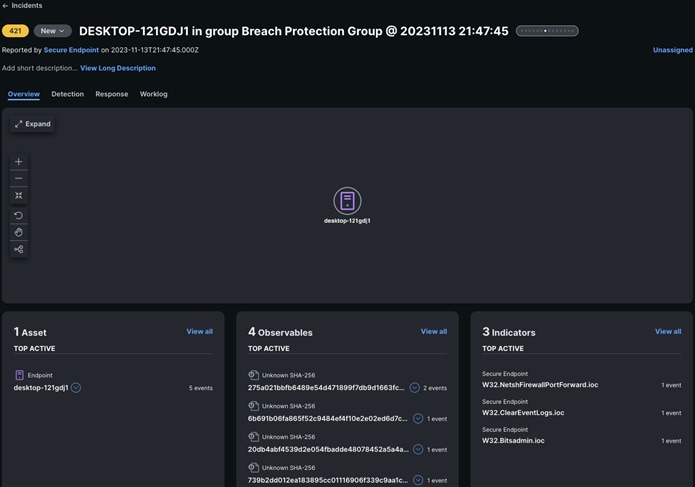
Step 5. In this case, we already understand all of the Observables and Indicators that occurred so there isn’t anything else for us to investigate. However, in a real world scenario the collection of Observables and Indicators could be the difference between a successful investigation and a missed attack. If desired, you can treat this as a test Incident by clicking Unassigned in the top right to assign an analyst, then clicking through the Detection tab (to review the events) and the Response tab (to review Identification, Containment, Eradication, and Recovery workflows). The Worklog tab will document recorded analyst actions.
Email Threat Defense acts as a value add to Office 365 security, providing additional detection and advanced features like malware sandboxing. The order of inspection is Office 365 first and ETD second, which means that any emails seen in ETD have been allowed by Office 365. While this helps reduce event volume in ETD, it can cause problems with the testing and validation exercises in this section. If you find that Office 365 blocks an email that you’re using for ETD testing, you can release the email from Office 365 quarantine by following the steps in Appendix A – Release Emails from Office 365 Quarantine. At the time of testing, Office 365 did not block the URL used in Test Case #1 but did block the eicar file used in Test Case #2.
Also pay attention to the directionality of emails sent during these exercises. ETD has granular configuration in the Policy section for Incoming, Outgoing, and Internal emails, so ensure that the direction of email you’re testing with has the corresponding analysis enabled.
Test Case #1 - Phishing Email Quarantine
Note that this scenario uses live malicious URLs, so exercise proper caution not to click on links and use a suitable test device if you perform this exercise.
Configuration
This test involves analysis of the email message body, and so depends on the Message Analysis configuration in the ETD Policy. Ensure that you send a test email from an inspected direction for this test.

Test
Step 1. Use a phishing URL feed or phishing URL repository like https://openphish.com to identify some potential phishing URLs. For this example, we’ll use a phishing URL targeting WhatsApp.
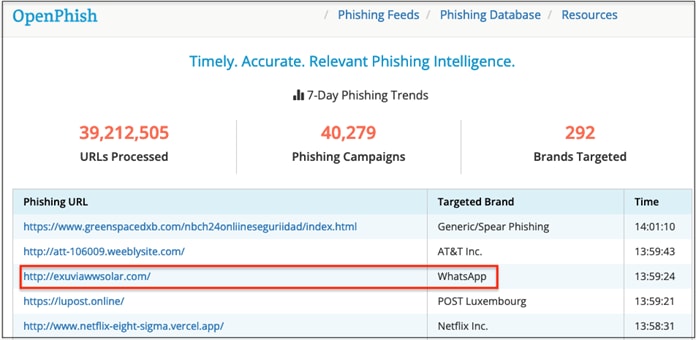
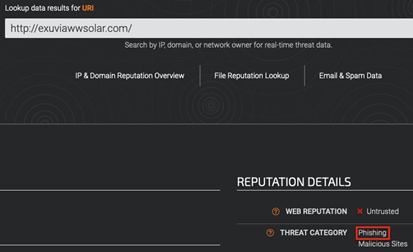
Step 2. Copy the target phishing URL and search for it at https://www.talosintelligence.com/reputation_center/ for more details.

Step 3. Ideally the URL returns a Phishing designation which isn’t overshadowed by bigger threat categories. This particular URL is a good fit.
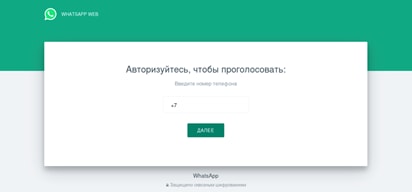
Step 4. If you want to go even further with the recon, you can use a site like https://urlquery.net (note: be sure to go to urlquery.net, not .com) and detonate the URL. For our example URL, the detonated webpage does indeed look like a WhatsApp phishing page targeting a foreign country, so it appears the phishing designation is accurate.
Step 5. Send the URL to an email address in a domain monitored by ETD.
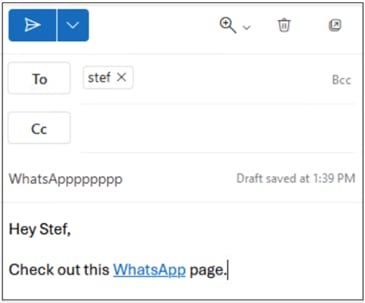
Step 6. In the Cisco XDR GUI, navigate to the Email Threat Defense Dashboard (if you don’t have one yet, see the Create Cisco XDR Dashboards section to make one). Scroll to the Malicious & Phishing dashboard.

Step 7. Click the Phishing detection to view more details on the event in Email Threat Defense, if desired. Confirm the expected Quarantine action.

Test Case #2 - Protect Against Malware Attachments
We’ll use the eicar file in this scenario to simulate a live malware test. Please note that Office 365 should block the eicar file directly, so refer to Appendix A – Release Emails from Office 365 Quarantine if you aren’t familiar with releasing files from Office 365 quarantine.
Configuration
ETD file attachment inspection is configured in the following section of the ETD Policy:

For this test, please confirm that the inspection directionality in your policy matches the direction of your test email.
Test
Step 1. On the computer that will send the test email, download the eicar file from eicar.org.


Step 2. Attach the eicar file to an email and send the email to an address in a domain monitored by ETD.
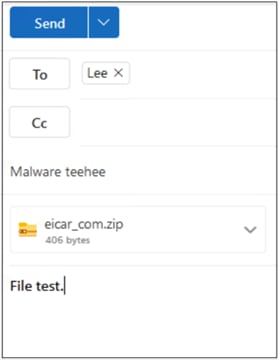
Step 3. Return to the Cisco XDR GUI and review the ETD dashboards. There should now be a new Malicious entry under the Threats dashboard.

Step 4. Click on the Malicious event to review details in ETD. Confirm that the verdict and action are expected.

Test Case #3 - Manual Email Remediation
While ETD has extensive resources like Talos threat intelligence and malware sandbox results to pull from, administrators will likely encounter scenarios where they want to take direct action to reclassify or change how an email is handled. For this exercise, we’ll send an email from outside of the organization to multiple email accounts within the ETD monitored domain, then use ETD to change the email Verdict to Spam and send it to the Junk folder on all recipient devices.
Test
Step 1. Send an email to multiple accounts monitored by ETD.
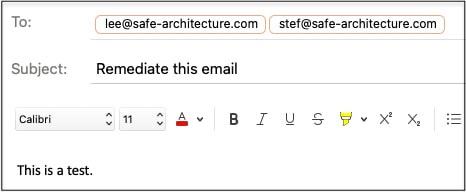
Step 2. Verify email receipt.
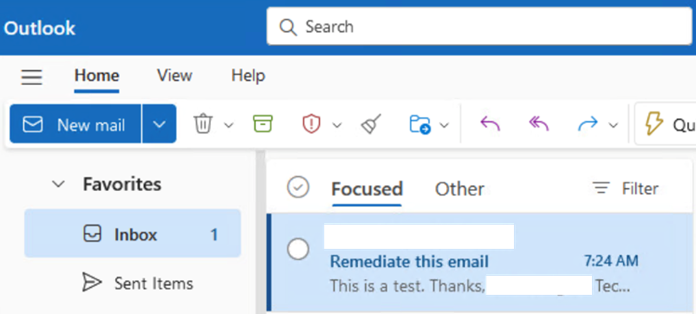
Step 3. Within the ETD GUI, navigate to Messages and confirm there is a log for the email. Note that ETD lists the primary recipient and then gives a count of additional recipients who received the same email.
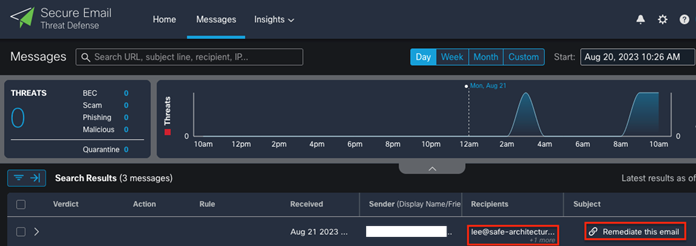
Step 4. Check the box next to the email to bring up the Reclassify bar. For this example, we will reclassify the email as Spam and set the requested action to Move to Junk. Click Update.
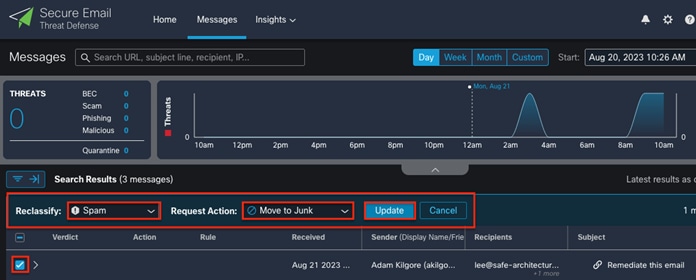
Step 5. After clicking Update, ETD will reflect the chosen email verdict and show Move Requested as the action. Note that the Spam verdict has an embedded person icon, which indicates that the verdict was set manually by an ETD user.
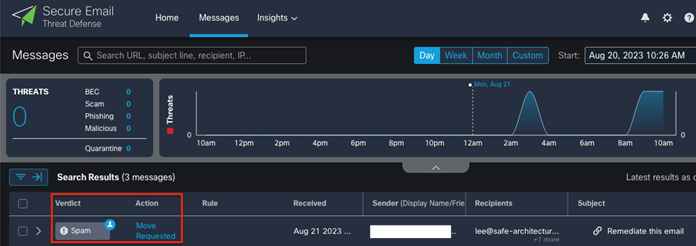
Step 6. Return to the recipient email inbox(es) and confirm that the reclassified email is no longer in the inbox. Navigate to the Junk folder and confirm that the email has been successfully moved by ETD.
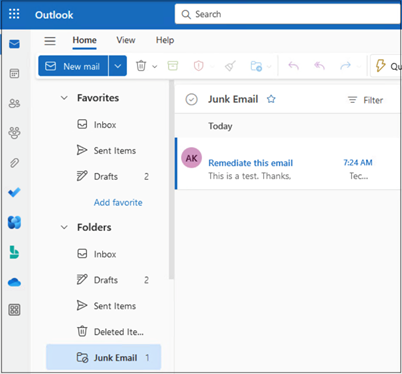
Cisco Secure Network Analytics
Earlier in this guide we configured the Cisco Secure Client with the Network Visibility Module. The NVM allows endpoints to send telemetry data directly to Cisco XDR via an encrypted tunnel. This communication channel between the endpoint and Cisco XDR can collect telemetry from anywhere, whether the endpoint is on premises, remote, or on VPN.
Endpoint monitoring is only one component of a strong telemetry solution. Secure Network Analytics can collect flow and log data from switches, firewalls, and virtualization environments to map connections from any origination point within a network to the edge of a network boundary. SNA’s visibility can be extended into the cloud, VMs, and containers to bring visibility and heuristic anomaly detection to a SOC.
The test cases in this section will highlight a few of the capabilities of SNA. Note that for the configuration tests below, we deployed SNA with a manager, flow collector, and datastore.
Test Case #1 – Rogue DNS Detection
A rogue DNS server can take a legitimate DNS query (like www.google.com) and resolve it to an IP address that is controlled by a malicious entity. This attack can be used for credential harvesting and malware delivery. Rogue DNS servers can take the form of servers controlled by an attacker, or by legitimate DNS servers that have been compromised with malicious resolution entries. The threat from rogue DNS servers can be mitigated by securing and monitoring internal DNS servers, using secure external DNS servers like Umbrella, and by inventorying and monitoring any DNS servers that don’t fall into the prior buckets. The use of any unexpected DNS server is also undesirable as it can bypass the security offered by Umbrella DNS resolution.
Deployment Note: These test cases were run from an SNA deployment with a Data Store.
Implementation Strategy
Inventory management is an important area of security, including inventory of approved DNS servers. Once all legitimate DNS servers have been inventoried by an organization, they can be entered in SNA as shown in the Configuration section below. Once SNA has a list of approved DNS servers it can begin monitoring for any DNS activity that doesn’t use an approved server. While SNA does have anomaly detection that can pick up something like a host using a new DNS server it has never used before, taking full monitoring control of all DNS server activity on the network is a stronger security posture.
As unapproved DNS servers are identified, they should be investigated to determine whether the traffic is legitimate or malicious. Even if an organization has a list of approved DNS servers for its network, it may find other legitimate traffic like operating systems that use a hard-coded external DNS server for automated updates. As these legitimate use cases are identified, they can be added to SOC documentation and the new DNS server(s) can be added to the approved list in SNA, if desired. Similarly, any identified DNS server misconfigurations can be corrected, and any identified malicious DNS server activity can be properly investigated and triaged. Once all DNS server activity on the network has been identified and documented, any new activity will represent a change from baseline and facilitate a quick response, making rogue DNS servers easier to spot. This is one example of how SNA can be leveraged as a very powerful tool to detect stealthy compromises with no known signatures that may otherwise be missed.
Configuration
Step 1. Within the Secure Network Analytics Manager, navigate to Configure > Host Group Management.

Step 2. Approved DNS servers should be configured for both Inside and Outside hosts. First, expand Inside Hosts, By Function, and Internet Services. Click the ellipses next to DNS Servers and select Add Host Group.
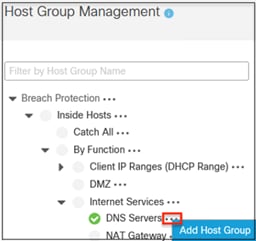
Step 3. Give the host group a name, enter the IP addresses of any internal DNS servers, and review the Advanced Options. For this example we will leave the options at their defaults, meaning that the DNS servers will be individually baselined and any configured service exclusions will apply. Click Save.
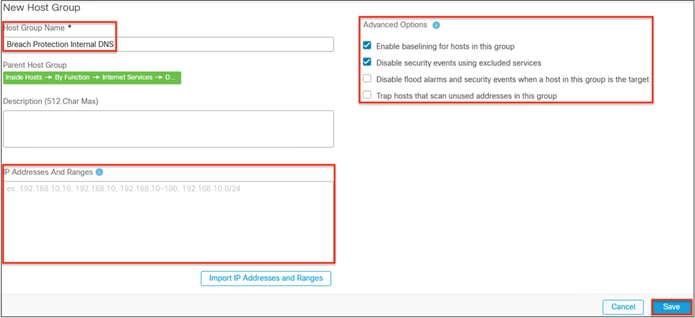
Step 4. Next, we’ll add any trusted external DNS servers. Expand the Outside Hosts dropdown and then expand Authorized External DNS Servers. Note that there is a default OpenDNS entry underneath Authorized External DNS Servers. It is recommended to review this group and confirm the listed servers are wanted.

Step 5. After reviewing the OpenDNS group, click the ellipses next to Authorized External DNS Servers, then click on Add Host Group.
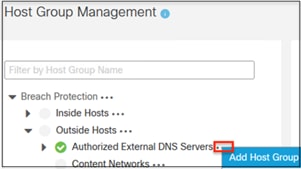
Step 6. As before, enter a name and the IP addresses of any external DNS servers. We’ll once again leave the Advanced Options as the default for this example, which is to disable individual host profiling for external IPs. Click Save.
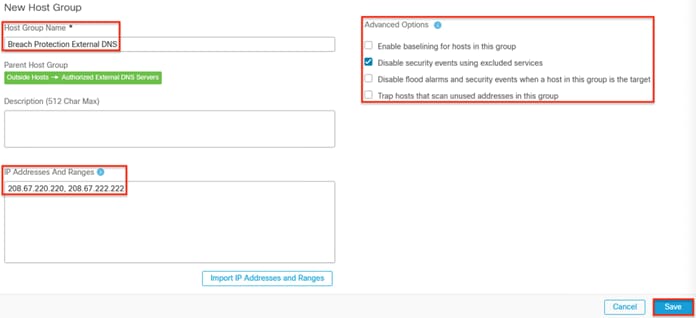
Step 7. Now that we have our DNS servers defined, we’ll create a custom security alert that will fire when telemetry for an undefined DNS server is seen. Click on Configure > Policy Management.
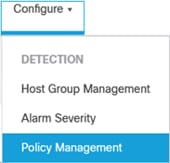
Step 8. Optional: Your deployment may already have a disabled rule for Unauthorized DNS Traffic. If desired, you can modify the rule and enable it. Otherwise, proceed to step 9 to create a rule from scratch.
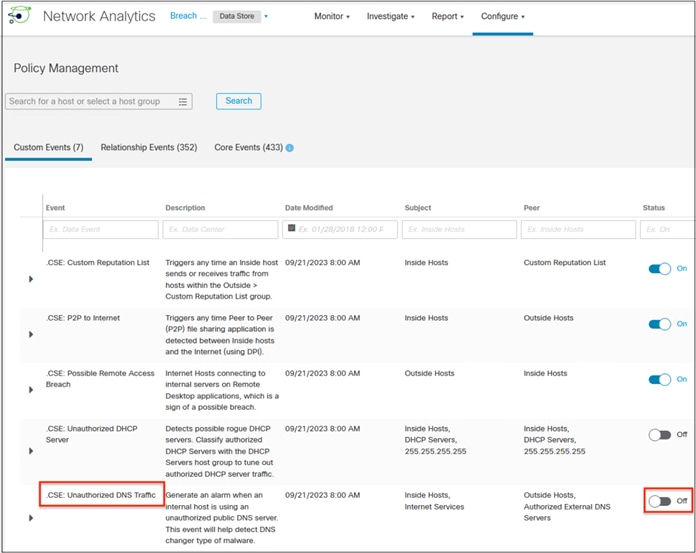
Step 9. Click on Create New Policy > Custom Security Event.

Step 10. Give the custom event a name and description, then click on the + icon to begin adding alert criteria.
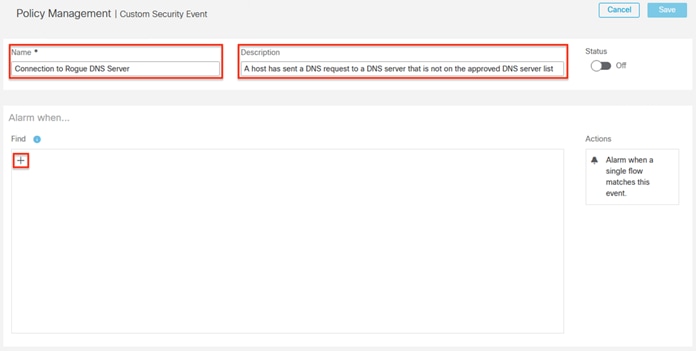
Step 11. Select Subject Host Groups.
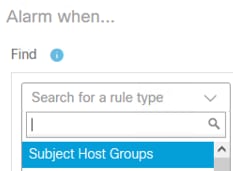
Step 12. A side window will expand. Click the circle next to Inside Hosts and confirm it shows a green checkmark as shown below. Next, expand Inside Hosts and By Function, and click on Internet Services to exclude it. This sets our rule criteria to match any inside host except for hosts with the Internet Services designation. Click Apply.
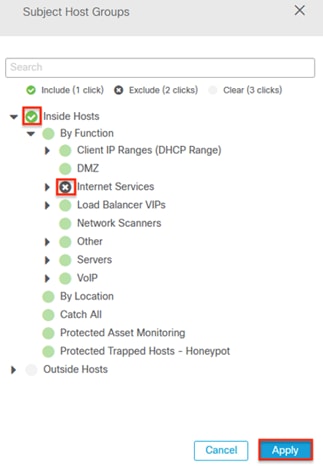
Step 13. The rule for Subject Host Groups will populate, and SNA will automatically create a text description of the rule. Click the + icon again.

Step 14. Locate Subject Orientation in the list and click on it.
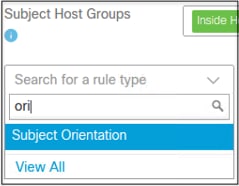
Step 15. Select Client, then click the + icon again.

Step 16. Locate Peer Port/Protocols and click on it.
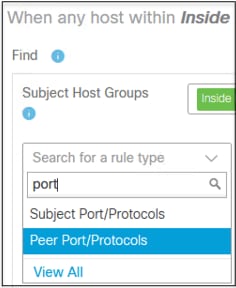
Step 17. Enter 53/udp and 53/tcp into the text bar for Peer Port/Protocols. Combined with the prior rules, we now have a match criteria of an Inside Host creating a client connection with a destination port of UDP 53 or TCP 53. Click the + icon again.

Step 18. Select Peer Host Groups.
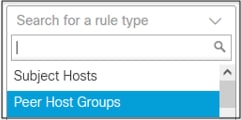
Step 19. Expand Inside Hosts and Outside Hosts and locate the entries for internal and external DNS. Double click each one so that an X appears, which will prevent requests to these DNS servers from matching this alert (recall that Authorized External DNS Servers has an OpenDNS entry by default). Click Apply.
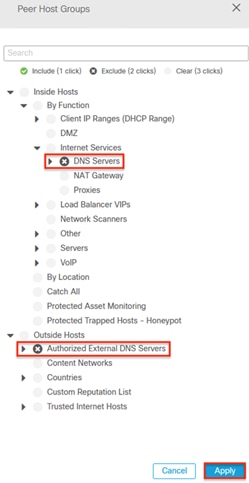
Step 20. With all rule criteria in place, SNA now displays a full summary of the alert criteria. Note that this traffic only needs to occur once for an alarm to fire. Toggle the Status to On, then click Save.
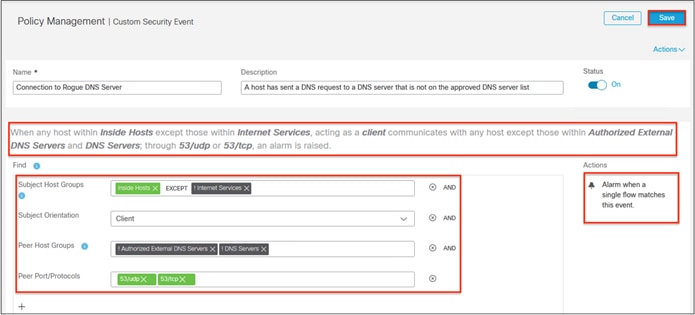
Test
Step 1. From a host that is monitored by SNA and either has Secure Client disabled or not installed, run an nslookup command against a DNS server that is not in the Authorized External DNS Servers or DNS Servers host groups. The example below shows an nslookup query that specifies the Google DNS server of 8.8.8.8 as the resolver for the query.
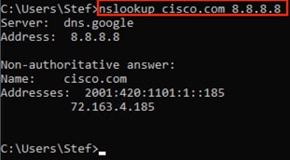
Step 2. Allow some time for the flows to process and SNA to perform the event correlation. From the Cisco XDR Control Center, navigate to the SNA dashboard and locate the Top Alarms by Count widget. If the alarm conditions have been met and SNA has had time to correlate the events, you should see events for Data Hoarding and Data Exfiltration.
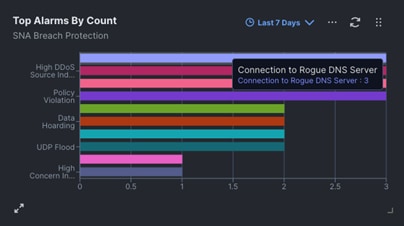
Step 3. To locate the events within the SNA Manager GUI, click on Monitor > Security Insight Dashboard.

Step 4. Locate the widget for Today’s Alarms, then click on Connection to Rogue DNS Server.
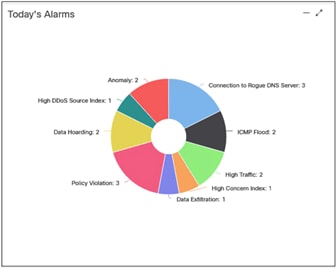
Step 5. SNA will display the flows associated with the alerts.
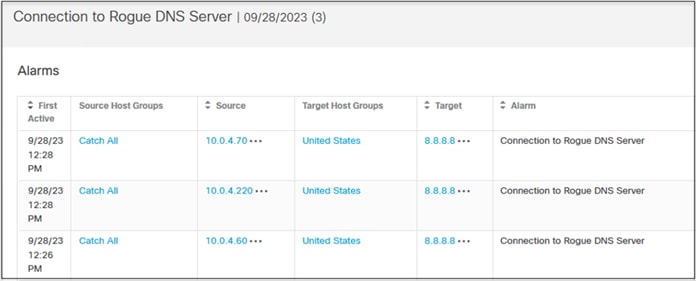
Test Case #2 – Data Hoarding & Data Exfiltration
Security Insight Dashboard
In Secure Network Analytics, alarm categories provide a quick way to view severity levels for the network and for specific hosts and users. An alarm category is a “bucket” toward which a defined list of security events contributes index points (values that represent an observed occurrence of behavior that matches a defined set of criteria). When network activity meets or exceeds a defined set of criteria specified for the alarm category, it triggers an alarm. The top-level categories are:
● Anomaly: Indicates that hosts are behaving abnormally or generating traffic that is unusual, but not consistent with another category
● Command & Control: Existence of bot-infected servers or hosts in the network attempting to contact a C&C server
● Concern Index: Tracks hosts that have either exceeded the concern index or have rapidly increased.
● Data Hoarding: Indicates a source or target host within a network has downloaded an unusual amount of data from one or more hosts
● DDoS Source: Indicates a host has been identified as the source of a DDoS attack
● DDoS Target: Indicates that a host has been identified as the target of a DDoS attack
● Exfiltration: Tracks inside and outside hosts to which an abnormal amount of data has been transferred
● Exploitation: Tracks direct attempts by hosts to compromise each other, such as through worm propagation
● Policy Violation: Subject is exhibiting behavior that violates normal network policies
● Recon: Indicates the presence of unauthorized and potentially malicious scans using TCP or UDP
● Target Index: Tracks inside hosts that have been recipient of more than an acceptable number of scan or other malicious attacks
For this exercise we’ll focus on two categories that involve data volume—the Data Hoarding and Exfiltration alerts. SNA can detect data transfers that exceed configured thresholds and that deviate from expected baselines. This visibility supplements other data protection measures like Data Loss Prevention (DLP) and access control measures.
Configuration
Step 1. In the Secure Network Analytics Manager, navigate to Configure > Policy Management.
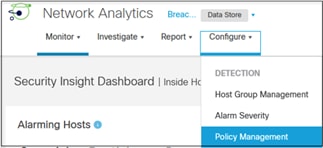
Step 2. Within Policy Management, click on Core Events.
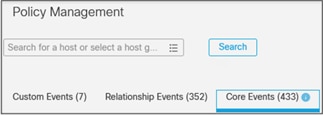
Step 3. Under Event, search for the data keyword and then select Data Exfiltration.
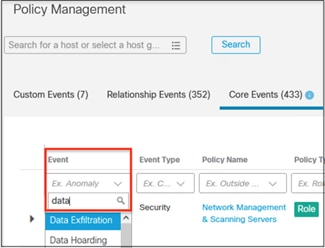
Step 4. Review the configured alerts for data exfiltration. For this example we’ll focus on the alarm for Inside Hosts as the Source. Click the arrow to expand the alarm details.
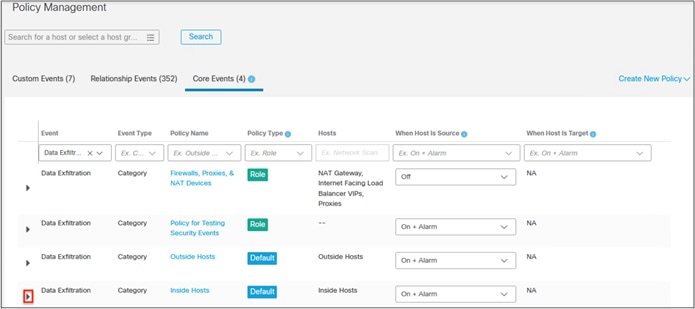
Step 5. Review the configured values. This alarm can be set to Behavior and Threshold or Threshold only. Tolerance and upper and lower bands for the alarm can also be set. For this example, we’ll leave the values as the defaults and note the 1 G automatic trigger level.

Step 6. Search for ‘data’ under Event again, and this time select Data Hoarding.
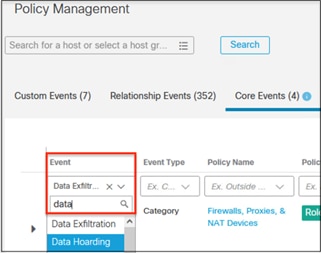
Step 7. We’ll once again focus on the alarm with Inside Hosts as the Source. Expand the alarm to see the criteria.
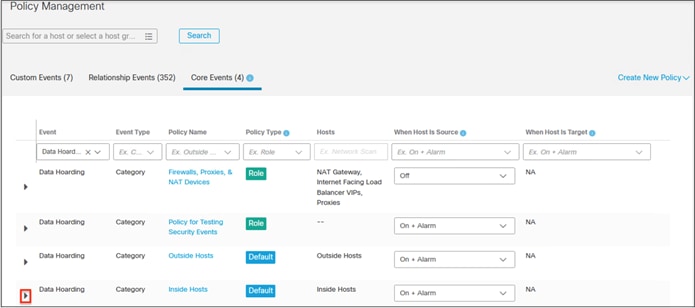
Step 8. Review the settings for the Data Hoarding alarm, and note the automatic alarm threshold of 1 G. Here again, we’ll leave the settings at their default.

Test
We’ll use a host that is part of the Inside Hosts group (which is located in Configure > Host Group Management) to move enough data to get the Data Hoarding and Data Exfiltration alarms to fire. Going from the default configurations in the last section, we need to export and import over 1 GB for each alarm type to trigger automatically. Note that these alarms can also trigger on less data based on baselining. Alternatively, if we send data significantly over the threshold then SNA will increase it’s certainty score, as we’ll see in later screenshots. For this test we’ll use a pair of Linux hosts, one of which is acting as an SCP server and has a large test file.
Step 1. From a host in the Inside Hosts group, initiate file transfers in excess of 1 GB. For this example we’ll initiate multiple SCP pull requests using a 500MB file for the Data Hoarding alarm.

Step 2. Next, we’ll perform multiple SCP push requests from the inside host for the Data Exfiltration alarm.

Step 3. Allow some time for the flows to process and SNA to perform the event correlation. From the Cisco XDR Control Center, navigate to the SNA dashboard and locate the Top Alarms by Count widget. If the alarm conditions have been met and SNA has had time to correlate the events, you should see events for Data Hoarding and Data Exfiltration.
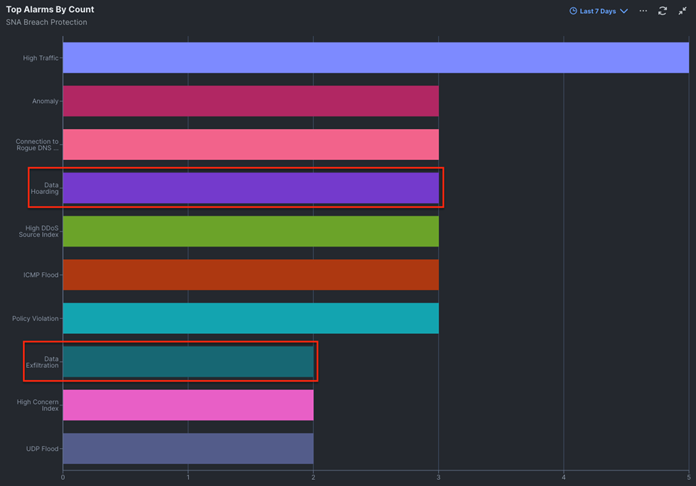
Step 4. Alternatively, you can find the events in the SNA Manager under Monitor > Security Insight Dashboard in the Today’s Alarms widget.
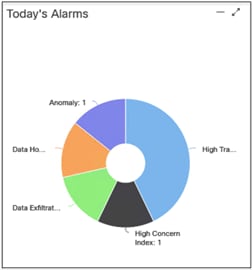
Step 5. Clicking on one of the events will bring up the flows that triggered the alarm. Note that the assigned score in the Details section vastly exceeds the allowed tolerance score. This is due both to the volume of traffic deviating from baseline and the transferred amount of traffic exceeding the allowed threshold.

Test Case #3 – Traffic to and from High Risk Countries
Visibility Assessment Application
SNA has the capability to track IP addresses based on geolocation and display them in an in-GUI Visibility Assessment application. The Visibility Assessment application provides a high level view of global traffic trends for an SNA monitored network, and also allows countries and regions to be classified based on their perceived risk for an organization. In this example, we will define some high risk countries and demonstrate how SNA can flag activity to different regions.
Configuration
Step 1. In the SNA Manager GUI, navigate to Report > Visibility Assessment.
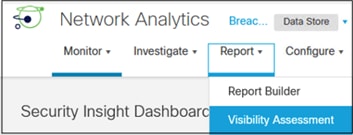
Step 2. Click on the gear icon, then click Select High-Risk Countries.
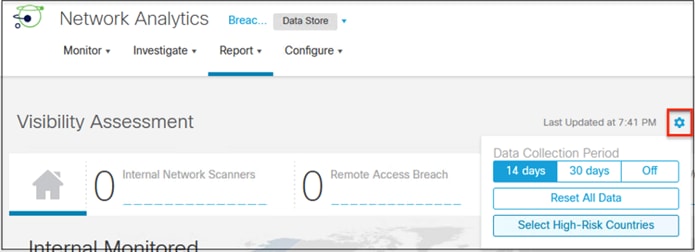
Step 3. Select any countries from the list, then click Apply. For this example, we’ll select China and Russia.

Step 4. The map will update to show the designated high risk countries in red, and aggregate inbound/outbound traffic will be shown for the top high risk countries.
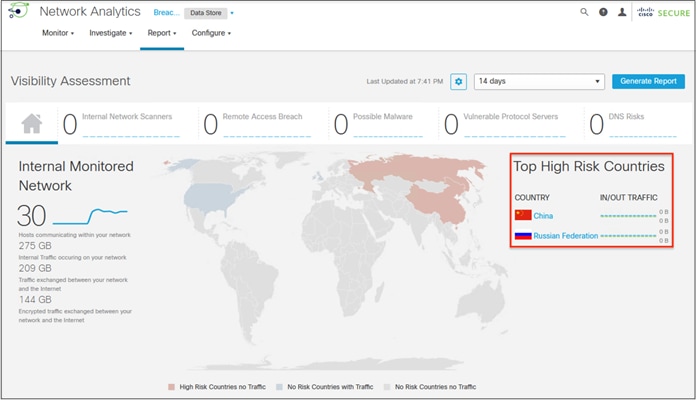
Test
Step 1. Identify a website that resolves to an IP in one of the designated high risk countries. For this example we’ll use yandex.com, which resolves to IPs in the Russian IP space at the time of this writing.
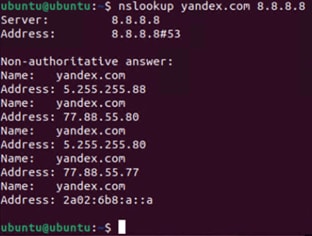
Step 2. We can confirm the geolocation of the IPs using a site like whois.domaintools.com.

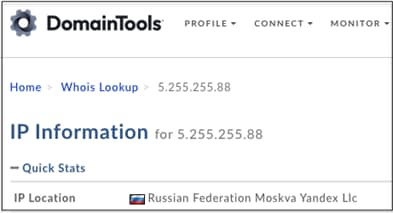
Step 3. After generating traffic to a designated high risk country, the Visibility Assessment tool will update as it sees flow records to and from designated high risk countries.
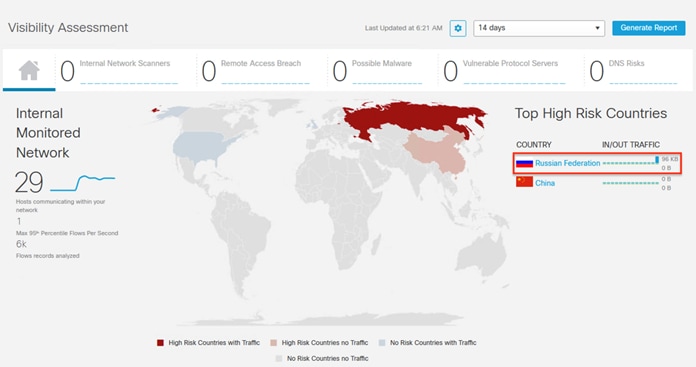
Step 4. Clicking on a country on the map will open up flow record data involving that country, along with any alarms that have fired.
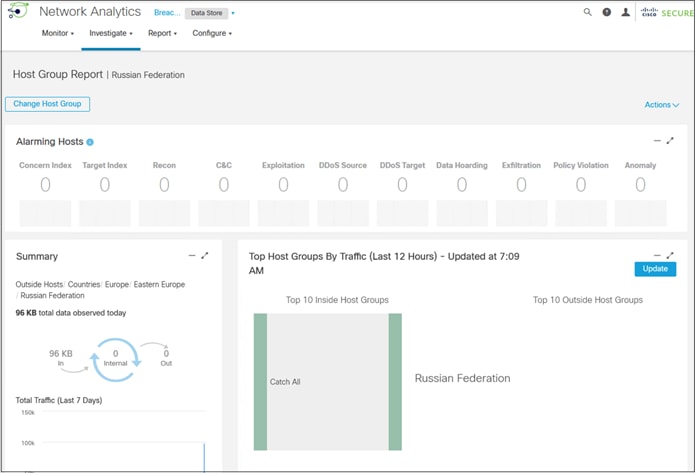
Validation tests for products that are not included with the Breach Protection Suite are included below. For this version of the guide the additional products are limited to Umbrella. Steps to integrate Umbrella with Cisco XDR and Secure Client were previously covered.
Test Umbrella DNS Resolution
Step 1. Verify that your DNS connections are routed through Cisco Umbrella by navigating to the following page in your client’s browser: https://welcome.umbrella.com. If the endpoint is connecting through Umbrella, a green banner will be displayed as shown.

If the device is not resolving DNS through Umbrella, a red message is displayed instead.
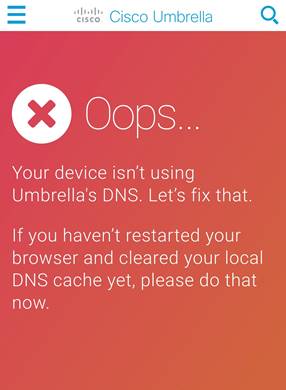
Confirm the Endpoint is Active under Roaming Computers
Step 1. Confirm the endpoint hostname. The below screenshot can be found by right-clicking This PC and selecting Properties in Windows 10.
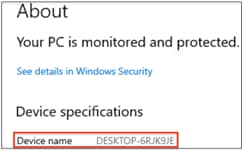
Step 2. Umbrella will automatically retrieve the hostname from Windows. In Umbrella, navigate to Deployments > Core Identities > Roaming Computers. Search for the endpoint by name if necessary and confirm the device is active and has the correct policy applied.
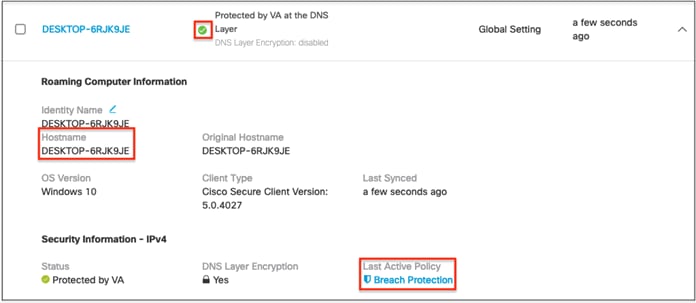
Note: If the intended policy is not applied, review the Identities Affected setting of the matched and intended DNS Policies, and modify the configuration so that the intended policy is matched.
Test Case #1 – Block DNS Tunnelling
DNS tunneling utilizes the DNS protocol to communicate non-DNS traffic (such as HTTP) over port 53. There are various, legitimate reasons to utilize DNS tunneling. For example, DNS tunneling is often used as a login mechanism for hotspot security controls at airports to access the internet. However, there are also malicious reasons to use DNS Tunneling VPN services.
Attackers know that enterprise network defenses allow DNS traffic over port 53. DNS requests can be manipulated to exfiltrate data from a compromised system to the attacker’s infrastructure. And in some cases, DNS responses are manipulated for C2 callbacks from the attacker’s infrastructure to a compromised system. For more information see DNS Tunneling.
Configuration
Step 1. In Umbrella navigate to Policies > Management > DNS Policies and click on the policy that has been applied to your network.
Step 2. Under Security Setting Applied, click Edit.
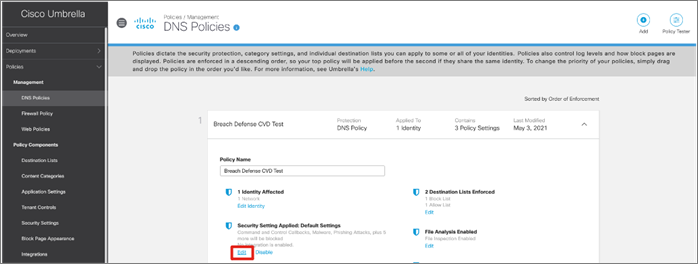
Step 3. Ensure that DNS Tunneling VPN has been enabled and click Set & Return.
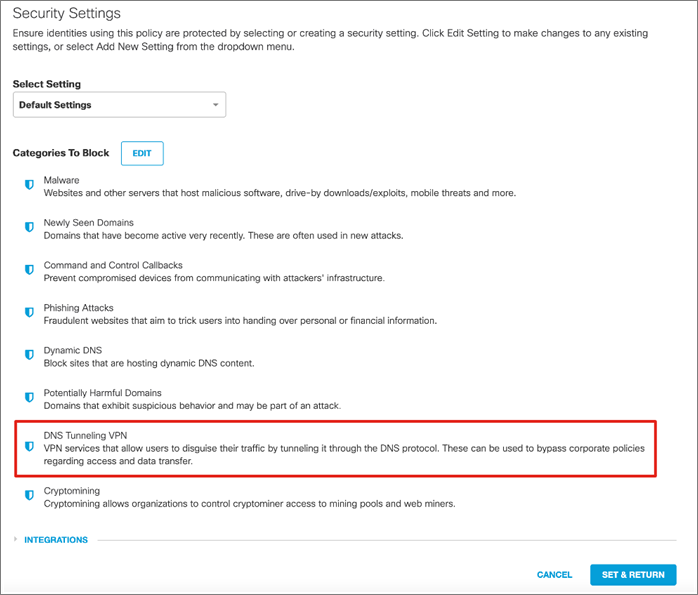
Test
Step 1. Using a device within the protected network, navigate to the following URL:

Step 2. Umbrella will block the site due to a security threat.
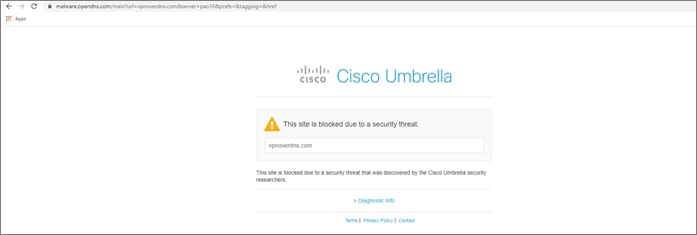
Test Case #2 – Protection from Malicious Domains
Cisco Umbrella has the following security categories:
● C2 Callbacks – Prevent compromised devices from communicating with hackers’ command and control servers
● Cryptomining – Block identities from accessing known crypto mining pools which protects you from the recent emergence of Cryptomining malware
● DNS Tunneling VPN – Discussed in test case above
● Dynamic DNS – Block sites that are hosting dynamic DNS content
● Malware – Block requests to access servers hosting malware and compromised websites
● Newly Seen Domains – Detect domains that have been seen being queried for the first time very recently
● Phishing Attacks – Protect users from fraudulent hoax websites designed to steal personal information
● Potentially Harmful Domains – Domains that exhibit suspicious behavior and may be part of an attack
Configuration
Step 1. In Umbrella, navigate to Policies > Management > DNS Policies and click on the policy that has been applied to your network.
Step 2. Under Security Setting Applied, click Edit.
Step 3. Enable each of the categories that you would like to block for your organization.
Note: C2 Callbacks, Malware and Phishing are recommended to be on by default.
Test
Step 1. Using a device within the protected network, navigate to any of the following URLs:
Command and Control test page:

Malware test page:

Phishing test page:

Step 2. For more examples, see Umbrella Test Destinations.
Step 3. Umbrella will block each site due to a security threat along with all other domains and IP addresses in the threat intelligence database.
Test Case #3 – Enforce Content Filtering
When configuring a policy and determining which categories of content to block, there are several levels of protection to choose from: High, Moderate, Low, and Custom. Categories included in the High, Moderate, and Low levels are predetermined and cannot be changed. Custom includes all levels—High, Moderate, and Low as well as categories unique to Custom. For this test, we will choose Moderate. For more information, see Manage Content Categories.
Configuration
Step 1. In Umbrella, navigate to Policies > Management > DNS Policies and click on the policy that has been applied to your network.
Step 2. Under Content Setting Applied, click Edit.
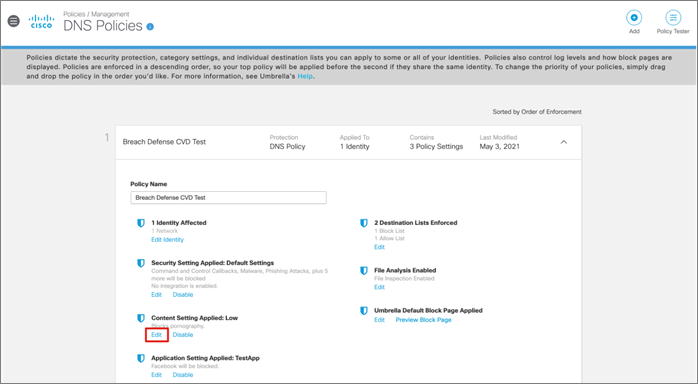
Step 3. Choose Moderate and click Set & Return.
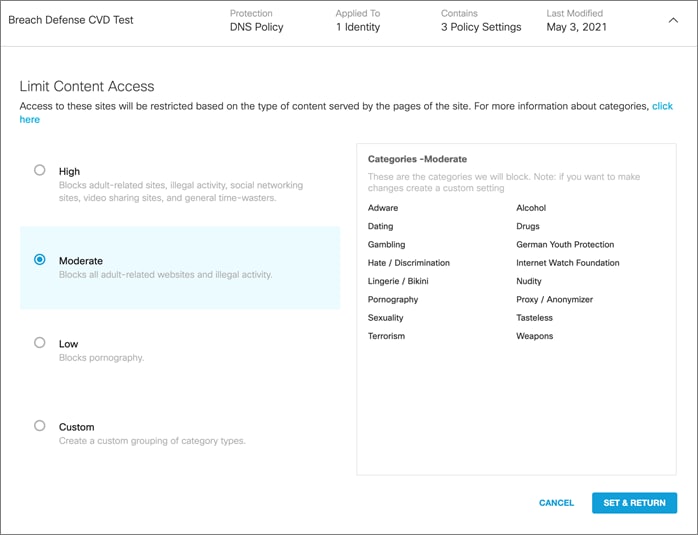
Step 4. Click Set & Return then Save.
Test
As Moderate content policy controls include the blocking of adult content, we will use that as an example.
Step 1. Using a device within the protected network, navigate to:

Step 2. Umbrella will block the site if the content has been blocked successfully.
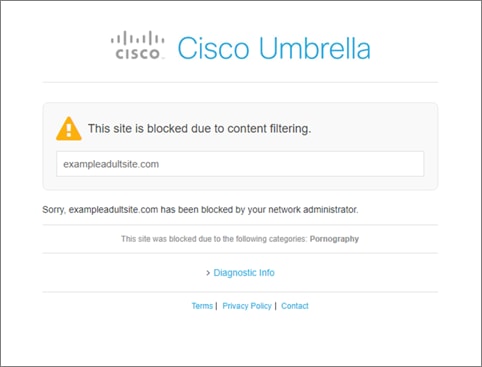
Test Case #4 – Permit or Deny Access to Cloud Apps
Application Settings organize applications into categories based on the type of processes or services provided, for example, shopping, education, or human resources. You can limit identity access to applications by selecting applications you want Umbrella to block. For this example, we will control access to Facebook.
Configuration
Step 1. In Umbrella, navigate to Policies > Management > DNS Policies and click on the policy that has been applied to your network.
Step 2. Under Application Setting Applied, click Edit.
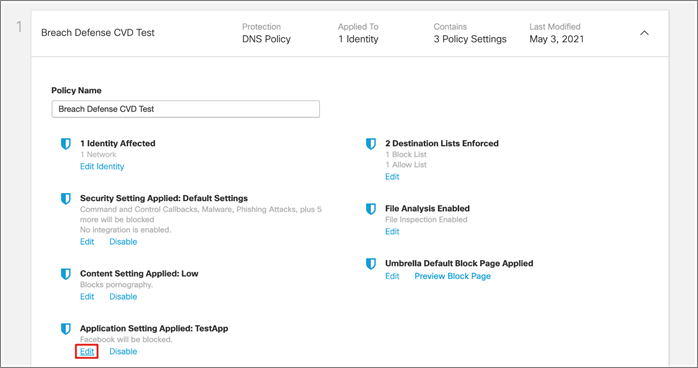
Step 3. Search for the application you wish to monitor, click the app to enable and then choose the action by clicking the gear icon. By default, the action is set to Block.
Note: Some applications have more functionality than just allow or block. In the case of Facebook, we can choose to just block Posts/Shares, which would just enable the viewing of content.
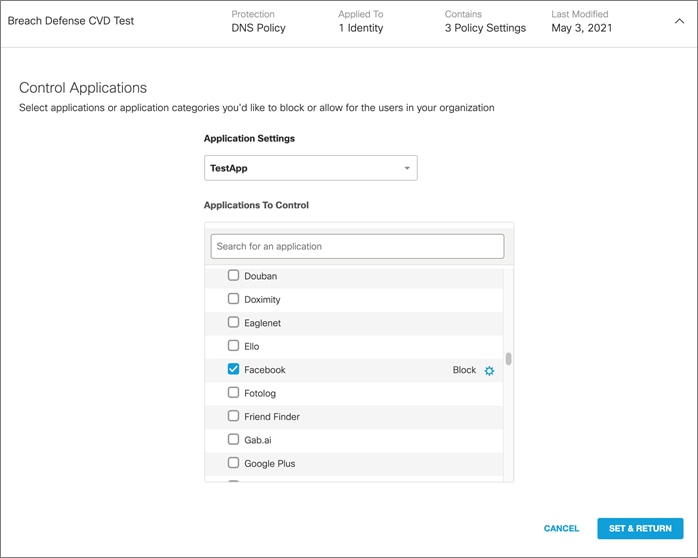
Step 4. Click Set & Return and then Save.
Test
Step 1. Using a device within the protected network, navigate to the application you just blocked.
Step 2. Umbrella will return the block page if the application has been blocked successfully.
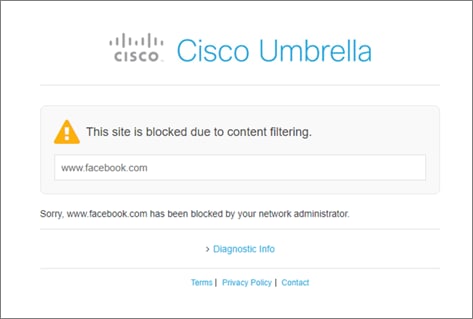
Appendix A – Release Emails from Office 365 Quarantine
If Office 365 blocks an email needed for Email Threat Defense testing, you can perform the following steps to release the email from Office 365 quarantine.
Step 1. Open the Office 365 Admin Center.
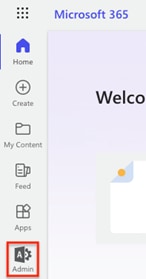
Step 2. Click on Show All.
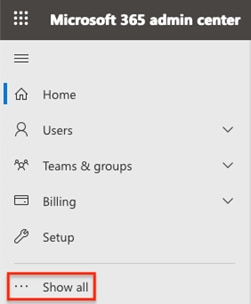
Step 3. Under Admin centers click on Security.
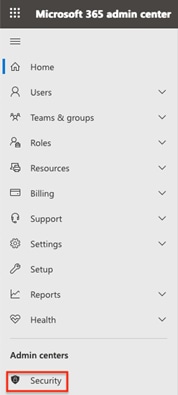
Step 4. Under Email & collaboration click on Review.
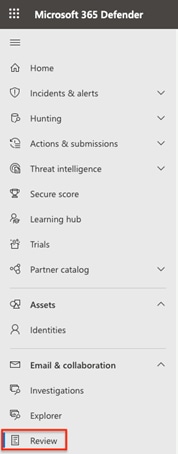
Step 5. Click on Quarantine.
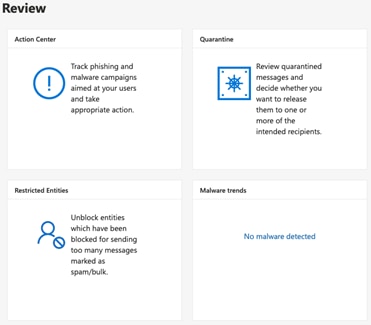
Step 6. Check the box next to any emails to release to ETD, then click on the checkmark to release them.

Step 7. A confirmation page will appear. Select the desired options then click Release message at the bottom of the page.
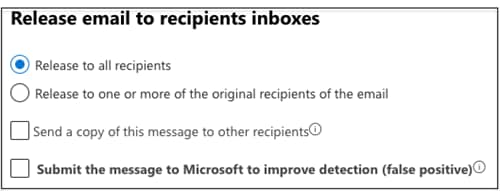
Appendix B – Deploy Umbrella with Secure Client
The configuration in this section is for users who have both the Breach Protection Suite and Umbrella, and who wish to deploy Umbrella with Secure Client. The Secure Endpoint Configuration in the Deploy Secure Client with Cloud Management from Cisco XDR section should be completed before proceeding with Appendix B.
Umbrella DNS Policy Configuration
DNS resolution is typically the first step when connecting to a service on the Internet. Thus, enforcing security at the DNS and IP layers is the first line of defense against threats and is a great way to stop attacks before users connect to bad destinations.
In this section we’ll create a basic DNS policy that can be exported as part of our Secure Client configuration. To see configuration steps for other Umbrella features including Web Policy, Cloud Firewall, Intrusion Prevention System, Data Loss Prevention, Remote Browser Isolation, and Meraki integration, please see the Cisco Umbrella Security Policy section of the Cisco Secure Access Service Edge (SASE) with Meraki SD-WAN Design Guide.
Step 1. In the Umbrella Dashboard, navigate to Policies > Management > DNS Policies.
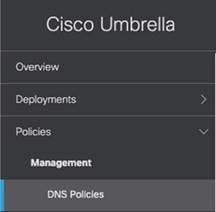
Step 1. Click Add.
![]()
Step 2. Review the Advanced Settings and choose which type of access control or threats to block. Click Next.
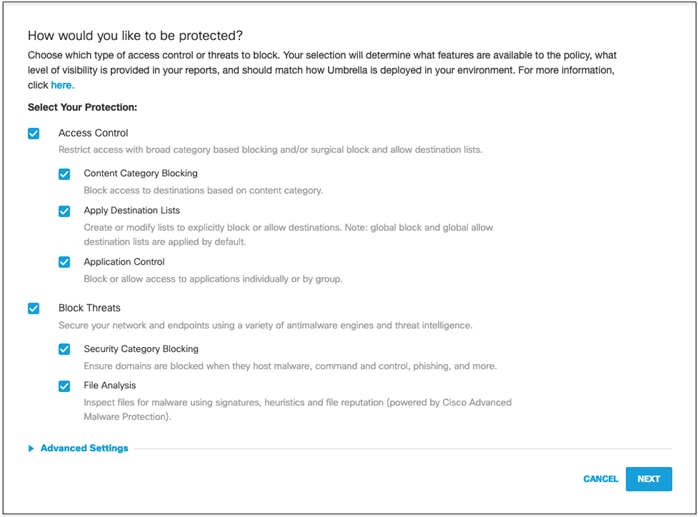
Step 3. Select the identity group(s) or Roaming Computers that the policy should be applied to. For this example, we’ll select a single test computer. Click Next.
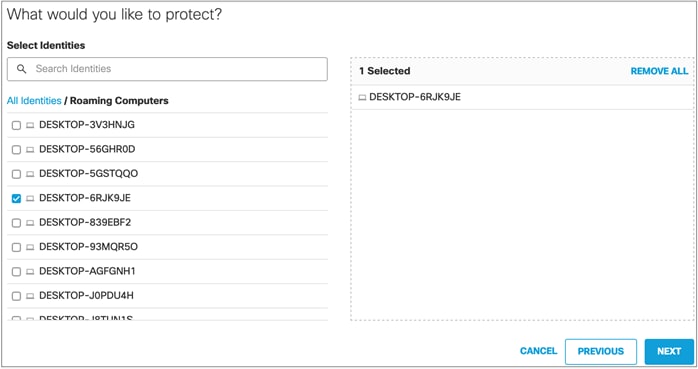
Step 4. On the Security Settings tab, choose which categories to block and expand Integrations to confirm that the Cisco XDR integration configured in the Integrate Umbrella with Cisco XDR section is selected. click Next.
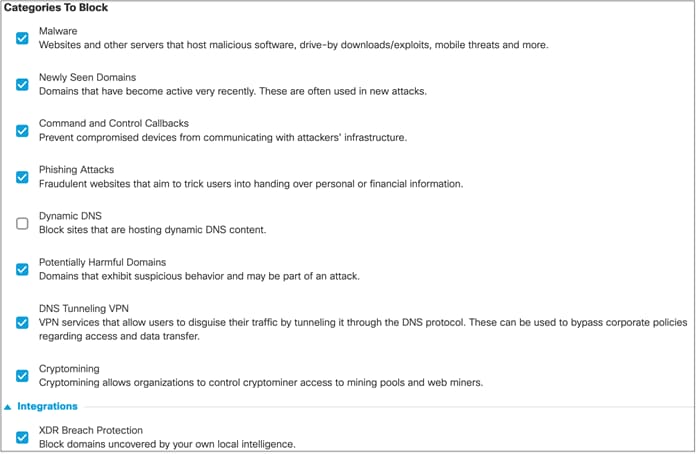
Step 5. Select the desired content filter level and click Next.
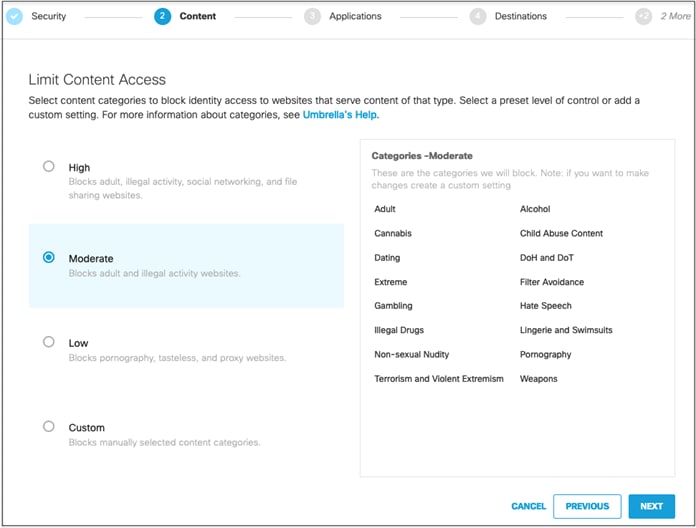
Step 6. Customize Application Control settings as desired. Note that this area of configuration will block applications that may have legitimate purposes for different organizations. As with all security, it is ideal to allow only needed applications and block everything else, but this may only be feasible for organizations with controlled environments and narrowly defined user roles. For this example, we will leave the top-level categories unblocked, and only set the Facebook application to block for later testing purposes. When finished, click Next.
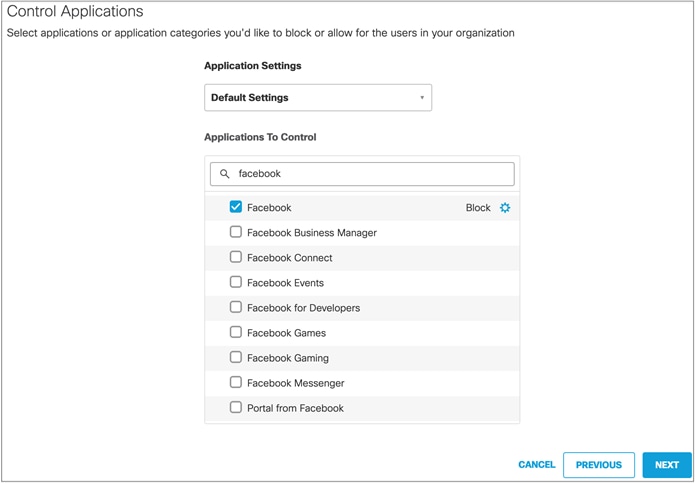
Step 7. Add new Destination Lists as desired or leave the defaults and return to configure later. Click Next.
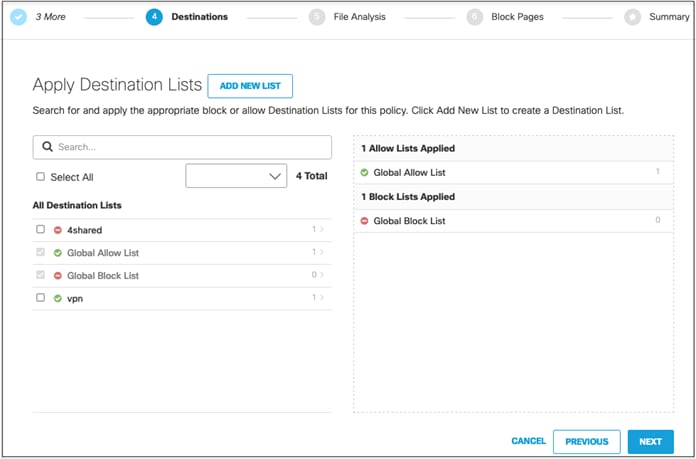
Step 8. Confirm File Analysis settings. Click Next.
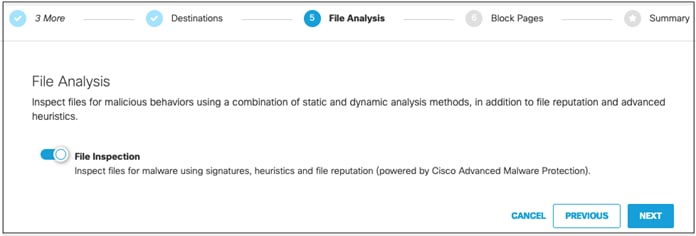
Step 9. Either leave the Block Page as the default or set a custom appearance. To modify, see Customize Block and Warn Pages in the Umbrella User Guide. Click Next.
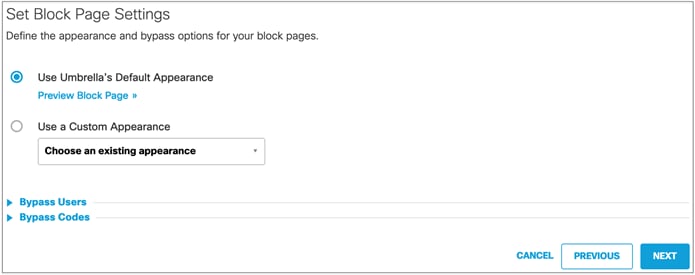
Step 10. Give a meaningful name to the policy and review the configuration. Click Save.
Note: if you would like to modify any of the Advanced Settings, first save the policy and then edit it.
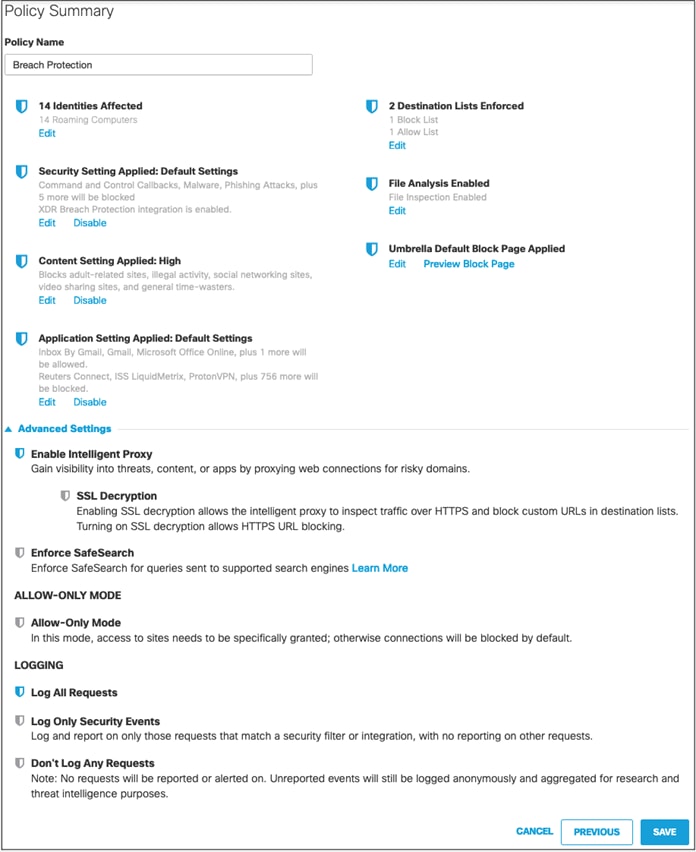
Export Umbrella Roaming Security Module to Cisco XDR
The OrgInfo.json file contains specific information about your Cisco Umbrella service subscription that lets the Umbrella Security Roaming module know where to report and which policies to enforce. In this section the OrgInfo.json file will be uploaded to Cisco XDR so that it can be easily deployed with the Secure Client Cloud Management module in a later section.
Step 1. Navigate to Deployments > Core Identities > Roaming Computers.
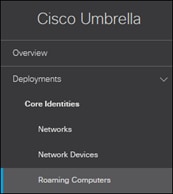
Step 1. Click Roaming Client.

Step 2. Under Umbrella Roaming Security Module for Secure Client, click Download Module Profile to obtain the OrgInfo.json file.
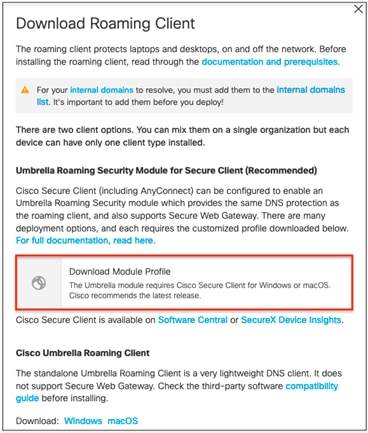
Step 3. In Cisco XDR, navigate to Client Management > Profiles.
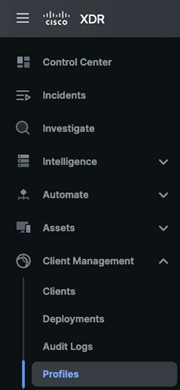
Step 4. Click on the Upload button.
![]()
Step 5. Select Umbrella, then click the Upload button.
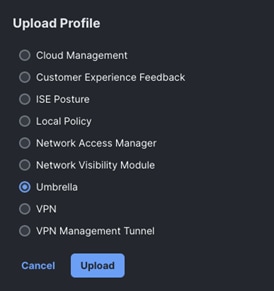
Step 6. Provide a Name for the Umbrella Configuration, upload the Orginfo.json file downloaded from step 3, then click Upload.
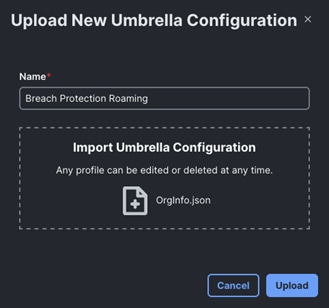
Secure Client + Umbrella with Cloud Management Configuration
Step 7. Within Cisco XDR, navigate to Client Management > Deployments.
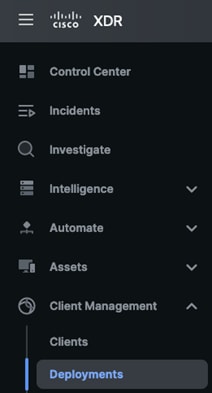
Step 8. Click the Create New button.
![]()
Step 9. The New Deployment page has multiple areas of config, which we’ll cover one at a time from the top. The first area of config is Cloud Management. Set the preferred version and specify a Cloud Management Profile. This guide will use the Default Profile, which sets logging to Error level and allows updates at any time of day.

Note: If you would like to create a new Cloud Management Profile or review available settings, this can be done via Client Management > Deployments > Create New.
Step 10. Under Secure Endpoint, select the desired version under Version control. Click the drop-down arrow for Choose an Instance and select your Secure Endpoint Cisco XDR integration.

Step 11. With the Instance set, click on Choose a Group and select the Secure Endpoint group configured previously. The final configuration will look like the screenshot below.

Step 12. Under Secure Client, set the desired version. If you’re deploying Umbrella, also enable Umbrella and select the Umbrella roaming configuration imported previously. We’ll also enable the Network Visibility Module and set the profile as the NVM Cloud Default Profile. The NVM Cloud Default Profile will automatically send logs to Cisco XDR via an encrypted HTTPS connection.
Note: if you would like to send NVM data to a different collector, you can configure a custom profile via Client Management > Profiles > Create New.
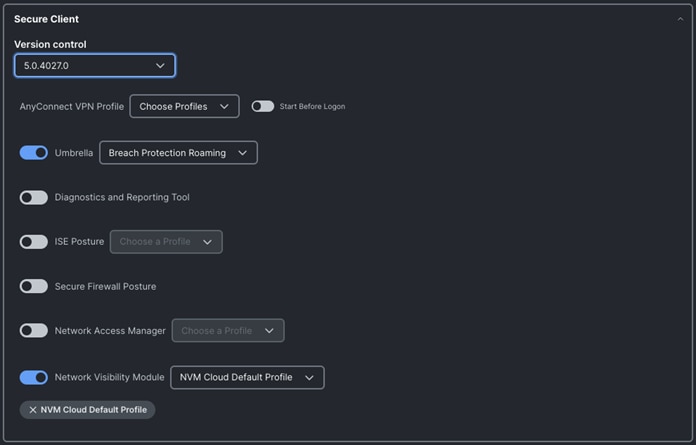
Step 13. Scroll back to the top of the page and give the Deployment a meaningful name. Click the Save button.

Install the Umbrella Root Certificate
Importing the Umbrella root certificate is necessary for Umbrella to proxy HTTPS traffic. Functionality that requires the proxy includes decrypting HTTPS traffic and injecting a block page into an HTTPS session. Umbrella has a default root certificate that can be replaced with an organization specific root certificate if desired, which can save some provisioning overhead if the organization root certificate has already been provisioned and trusted by the endpoints.
This section will cover how to manually export the default Umbrella root certificate and install it in Firefox on Windows. Other installation methods are available in the Install the Cisco Umbrella Root Certificate guide. As with the Secure Client installer in the prior section, your organization may already have a preferred method for provisioning. As mentioned previously, guidelines for distributing the Umbrella root certificate via Meraki MDM are given in the Zero Trust: User and Device Security Design Guide.
Step 1. In Umbrella, navigate to Deployments > Configuration > Root Certificate.
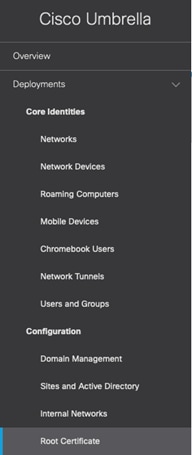
Step 1. Expand the dropdown for the Cisco Root Certificate Authority and download the certificate.

Step 2. Transfer the certificate to the endpoint that will install it.
Step 3. From the endpoint that is installing the certificate, launch Firefox and click the hamburger menu in the top right.

Step 4. Click on Settings.
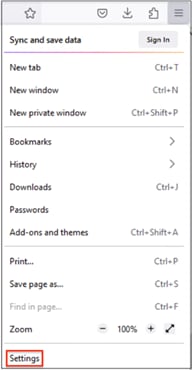
Step 5. Click on Privacy & Security.
Step 6. Scroll down to the Certificates section and click on View Certificates.

Step 7. Within Certificate Manager, click on Import.
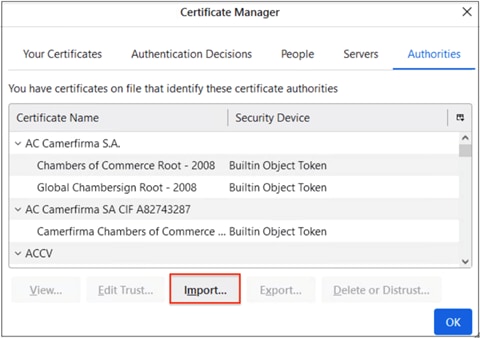
Step 8. Select the Umbrella Root certificate that was downloaded previously, then click Open.
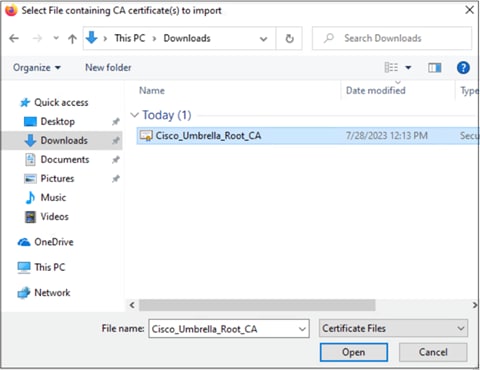
Step 9. Check the box to Trust this CA to identify websites. Click OK, then click OK again.
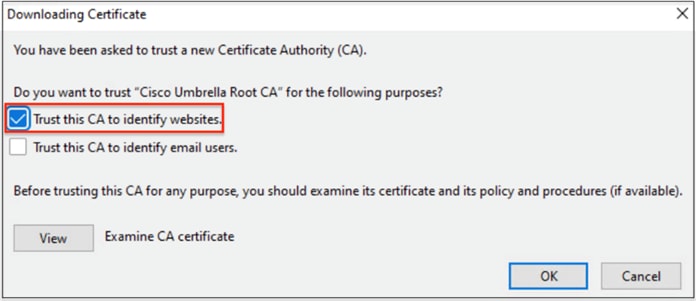
Step 10. Restart Firefox to complete the procedure.
Secure Client with Umbrella Installation
Most organizations will have an existing method of endpoint management that can be used to provision Secure Client. This section will cover a manual installation procedure that can be used for testing, or for small organizations.
Step 1. From Cisco XDR, navigate to Client Management > Deployments.

Step 2. Click the ellipses for the deployment configuration created in the prior section and select Full Installer.

Step 3. After the Full Installer downloads, transfer it to the endpoint(s), and run the file to install.

Step 4. Click Continue to proceed with the installation.
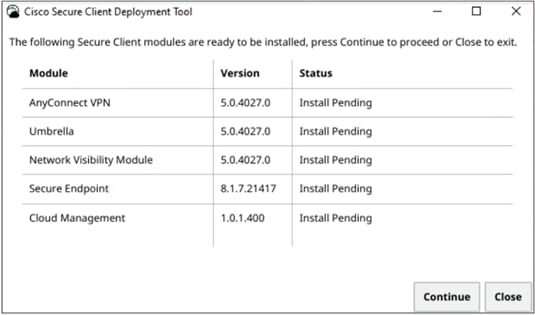
Step 5. Click Close when the installation is complete.
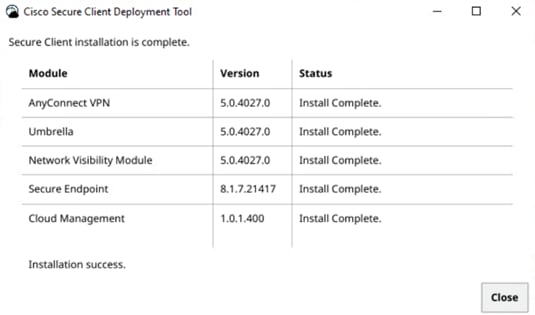
Note: it may take a few minutes for Secure Endpoint to fully connect.
| Acronym |
Definition |
| APT |
Advanced Persistent Threat |
| C2 |
Command and Control |
| CA |
Certificate Authority |
| DDoS |
Distributed Denial of Service |
| DLL |
Dynamic Link Library |
| DLP |
Data Loss Prevention |
| DNS |
Domain Name System |
| GPO |
Group Policy Object |
| GUI |
Graphical User Interface |
| ETD |
Email Threat Defense |
| HTTP |
Hypertext Transfer Protocol |
| IoC |
Indicators of Compromise |
| NDR |
Network Detection and Response |
| NVM |
Network Visibility Module |
| SNA |
Secure Network Analytics |
| SOC |
Security Operations Center |
| SSL |
Secure Socket Layer |
| TTPs |
Tactics, Techniques, and Procedures |
| VPN |
Virtual Private Network |
| XDR |
Extended Detection and Response |
● Cisco Secure Malware Analytics
● Cisco Secure Network Analytics
If you have feedback on this design guide or any of the Cisco Security design guides,
Please send an email to ask-security-cvd@cisco.com.


