Obtain Power Measurements of a DOCSIS Downstream Signal Using a Spectrum Analyzer
Available Languages
Contents
Introduction
The spectrum analyzer, like an oscilloscope, is a basic tool used for observing signals. Where the oscilloscope provides a window into the time domain, the spectrum analyzer provides a window into the frequency domain. Spectrum analyzers provide a convenient way to measure the amplitude of digitally modulated carriers. If you are not careful about what you are doing, however, it is very easy to make mistakes. This document provides step-by-step instructions to accurately measure the amplitude of digitally modulated carriers.
Prerequisites
Requirements
Readers of this document should be knowledgeable of the following:
-
The Data-over-Cable Service Interface Specifications (DOCSIS) protocol.
-
The Cisco IOS® command-line interface (CLI) on the uBR series routers.
-
The spectrum analyzer and its use and function in a cable environment.
-
The upconverter and its use and function in a cable headend.
-
The radio frequency (RF) terminology. For example, MHz, dBmV, dB, IF, QAM, and attenuation.
Components Used
The information in this document is based on these software and hardware versions.
-
HP 8591C Cable TV Analyzer
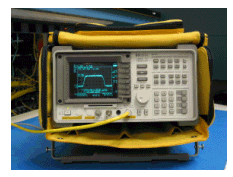
-
GI C6U Upconverter
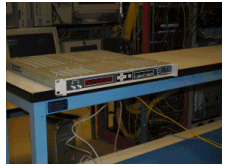
The information in this document was created from the devices in a specific lab environment. Refer to the instructions that accompany the upconverter and spectrum analyzer for additional information about the upconverter setup and operation and measurement procedures in general. All of the devices used in this document started with a cleared (default) configuration. If your network is live, make sure that you understand the potential impact of any command.
Disclaimer
The procedure shown in this document is an example based on use of the GI C6U and HP 8591C Cable TV Analyzer. Other makes/models may have different setup procedures. Also, the frequencies shown are for the example, and actual frequencies used in the customer's installation are likely to be different.
Conventions
For more information on document conventions, see the Cisco Technical Tips Conventions.
Understanding the Haystack
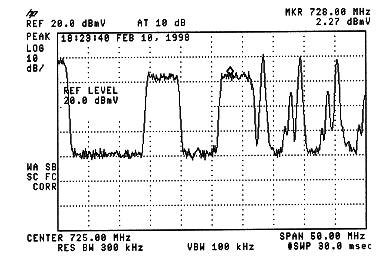
The 6 MHz downstream QAM carrier is often referred to as the haystack, as it resembles a pile of hay you would see on a farm. The haystack is a continuous MPEG bit stream. The picture below shows two digital channels (QAM) near the center of the screen followed by several analog channels (VSB Modulation). The purpose is not to just measure the amplitude of the QAM signal, but to measure the total power contained within the 6MHz carrier. This is similar to needing to measure the area within the signal (haystack) instead of its height.
A picture of the haystack is shown below.
Measuring the Power of the RF Carriers
When measuring downstream channel power, refer to the configuration guide. This guide explains the following two methods of measuring downstream channel power:
Both methods are explained using step-by-step instructions in this document.
Method 1 uses the HP8591C in Spectrum Analyzer Mode. Method 2 uses the HP8591C in CATV Mode.
Setting Up the Upconverter
The pictures below provide a visual reference of the upconverter. The C6U has two upconverters in the same chassis, which is why there is an A and B side. By convention, the cable industry generally defines a digitally modulated carrier's frequency by its center frequency. The C6U digital readout shows equivalent visual carrier frequency, and it is necessary to set the C6U 1.75 MHz below the desired center frequency.
This picture is the front view of the upconverter.

This picture is the rear view of the upconverter.

Follow the instructions below to set up the upconverter.
-
Pick a center frequency that you want to use. Refer to the NTSC frequency tables
 for more information.
 -
On your GI upconverter, choose the correct module, A or B.
-
Use the up/down arrow buttons to scroll through the menu until you find A or B on the left side of the display. Press the ENT key to select the module. The IF LED for the selected module will flash.
-
-
In the main menu, you can set the frequency and other necessary parameters listed below. Make sure you use the video carrier frequency, which is 1.75 Mhz below center frequency (when using other upconverters, you must know to use the center frequency or the video carrier frequency).
-
Select input by scrolling up or down to the INPUT menu. This should be set for IF. If it is not, press the right arrow key to make the input option to flash. Use the up/down arrow to select IF and press the ENT key to accept the change.
-
Use the up/down arrows to scroll to the OPTIONS menu. Use the right arrow to enter the menu, and the left arrow to exit the menu. Enter the menu.
-
Scroll through the options menu with the up/down arrows and verify the following options:
IDLE: OFF
RF: ON
MODE: FREQ
IAGC: OFF
IMG: (Manual if gain, no need to change this)
MODE: DIG
RF Power: Press the right arrow to adjust this. The up/down arrows
will increment/decrement the power output.
-
Connecting the Cables
Follow the instructions below to connect the cables.
-
Connect the downstream IF output on the cable line card to the IF input on the C6U upconverter, including a 10dB attenuator.
-
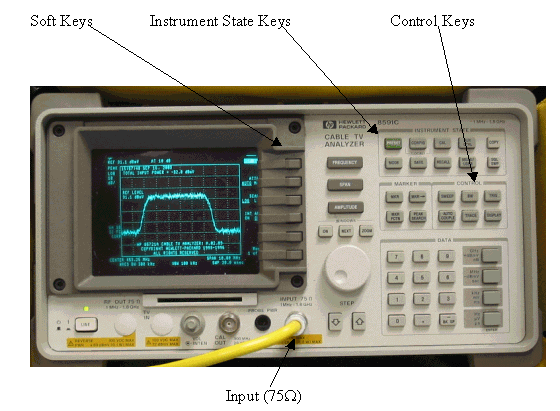
Connect the spectrum analyzer to the –20dB RF test port on the front of the C6U upconverter. When measuring the power, the actual power will be 20dB higher than what is being measured. (–20dB test ports are commonly used in the CATV industry because it allows for monitoring signals without causing interruption or adding noise).
Measuring the Downstream RF Signal Using the Channel Power Option
Follow the steps below to measure the downstream RF signal using the channel power option in spectrum analyzer mode.
-
Set the C6U upconverter for 625.25MHz.
-
Connect the RF output to the spectrum analyzer using an 8:1 splitter from the RF output on the upconverter.
-
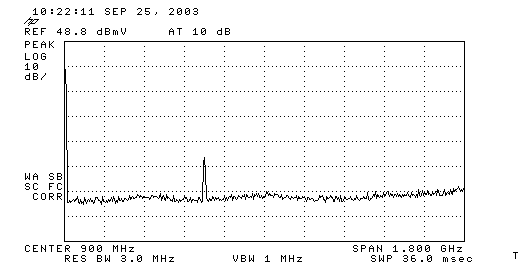
Power on the HP8591C spectrum analyzer. The analyzer display is shown below.
-
Press the top most soft key to select SPECTRUM ANALYZER mode.
-
Set the frequency to 627MHz (center frequency of the video channel, 1.75MHz above the video carrier set on the C6U). Use the instructions below.
-
Press the FREQUENCY key.
-
On the number key pad, enter 6 2 7.
-
Press the MHz button to the right of the number key pad.
-
-
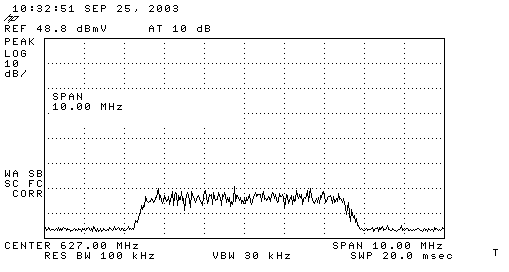
Set the span to 10MHz. Use the instructions below.
-
Press the SPAN button.
-
On the number key pad, enter 1 0.
-
Press the MHz button to the right of the number key pad. The display is shown below.
-
-
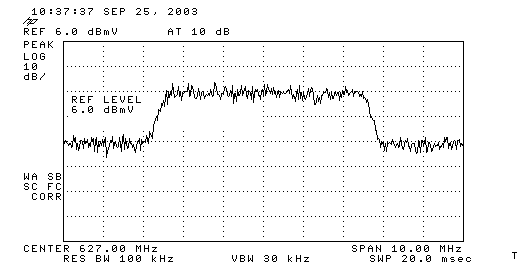
Change the display amplitude. Use the instructions below.
-
Press the AMPLITUDE button.
-
Turn the knob below (counter clockwise to increase, clockwise to decrease) so that the top of the haystack is on the second line from the top of the display. The display is shown below.
-
-
Measure the channel power with video averaging.
-
Press the Meas/User key (Instrument State Key section).
-
Press the following soft keys in this order: POWER MENU -> SETUP -> VID AVG (changes the underlined option from OFF to ON) -> CHANNEL BANDWIDTH.
-
Enter 6 on the number key pad.
-
Press the MHz button to the right of the number key pad.
-
Press the soft key for previous menu.
-
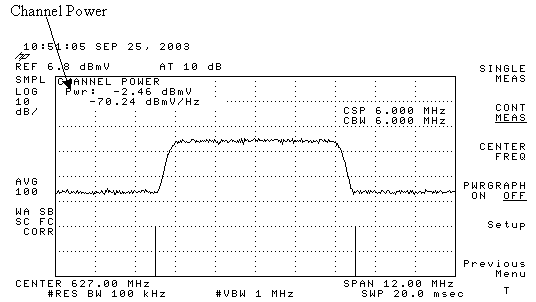
Press the soft key for CHANNEL POWER. The display is shown below.
-
Note: The power level -2.46 dBmV is shown at the top left of the display where you see the pointer above. Keep in mind that the power level will be approximately 2.5 dB lower when you are using video averaging feature. If you turn video averaging OFF, the power will be approximately 2.5 dB higher than -2.46 dBmV. Video averaging on all power measurements (spectrum analyzer and CATV mode) should be turned OFF. As noted, there is about a 2.5 dB difference between the value measured when video averaging is turned on versus when it is off. The correct power level result is obtained when video averaging is off.
Measuring the Downstream RF Signal Using CATV Mode
Follow the steps below to measure the downstream RF signal in CATV mode.
-
Connect the downstream output of the cable interface card to the upconverter input connector.
-
Connect the spectrum analyzer to the RF output of the upconverter.
-
Set the upconverter output level to the manufacturer's recommended settings. Typical output amplitudes range from +50 to +58 dBmV, although DOCSIS specifies levels as high as +61 dBmV.
-
Set the frequency on the upconverter to 439.25
-
Power on the analyzer by pressing the LINE button on the lower left corner of the unit.
-
Select the CATV Analyzer soft key button. This is the third soft key button on the right of the screen.
-
Select the channel measure soft key. This is the second soft key on the right of the screen. The display is shown below.
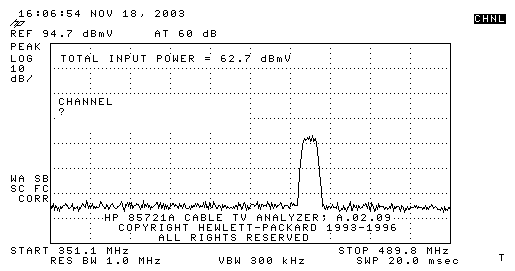
-
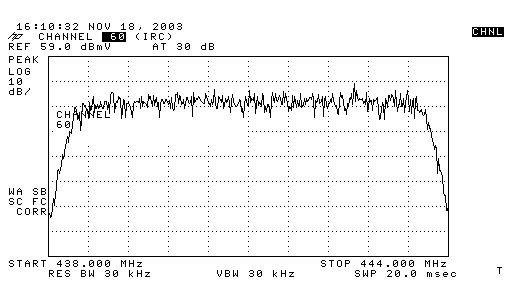
Select channel 60. Press 6, 0, and ENTER. The RF center frequency is 441 MHz (channel 60), so your GI Upconverter should display 439.25 MHz. The haystack display is shown below.
-
Press bottom main soft key twice so that it reads Main 3 of 3.
-
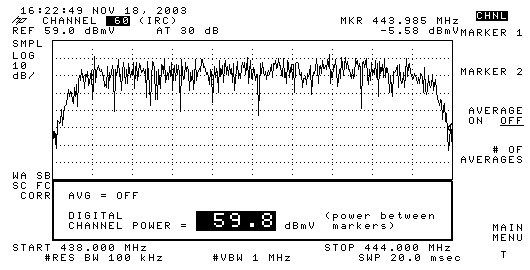
Press the digital power soft key, which is the 5th button on the right. You will see a bright green square at the bottom with a number. The display is shown below.
-
Notice the number 59.8dBmV at the bottom. This displays the power level
Note: The power level will be approximately 2.5 dB greater than 59.8 dBmV when using video averaging, as seen in the spectrum analyzer mode. Video averaging on all power measurements (spectrum analyzer and CATV mode) should be turned OFF. As noted, there is about a 2.5 dB difference between the value measured when video averaging is turned on versus when it is off. The correct power level result is obtained when video averaging is off.
Related Information
Revision History
| Revision | Publish Date | Comments |
|---|---|---|
1.0 |
04-Oct-2005 |
Initial Release |
Contact Cisco
- Open a Support Case

- (Requires a Cisco Service Contract)


 Feedback