Troubleshoot ACI Intra-Fabric Forwarding - Intermittent Drops
Available Languages
Download Options
Bias-Free Language
The documentation set for this product strives to use bias-free language. For the purposes of this documentation set, bias-free is defined as language that does not imply discrimination based on age, disability, gender, racial identity, ethnic identity, sexual orientation, socioeconomic status, and intersectionality. Exceptions may be present in the documentation due to language that is hardcoded in the user interfaces of the product software, language used based on RFP documentation, or language that is used by a referenced third-party product. Learn more about how Cisco is using Inclusive Language.
Contents
Introduction
This document describes steps to Troubleshoot Intermittent Drops in ACI.
Background Information
The material from this document was extracted from the Troubleshooting Cisco Application Centric Infrastructure, Second Edition book, specifically the Intra-Fabric fowarding - Intermittent drops chapter.
Troubleshoot ACI Intra-Fabric Forwarding - Intermittent drops
Topology example

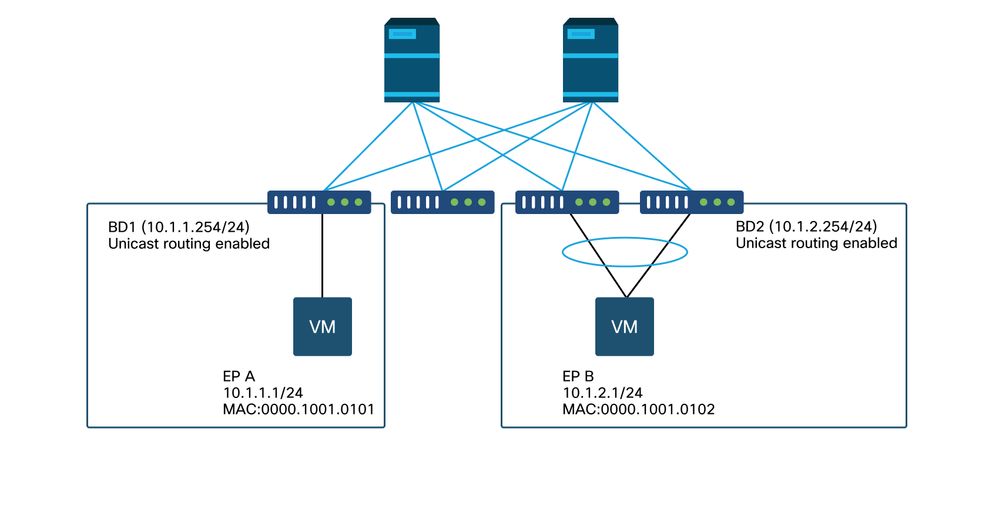
In this example, ping from EP A (10.1.1.1) to EP B (10.1.2.1) is experiencing the intermittent drops.
[EP-A ~]$ ping 10.1.2.1 -c 10
PING 10.1.2.1 (10.1.2.1) 56(84) bytes of data.
64 bytes from 10.1.2.1: icmp_seq=1 ttl=231 time=142 ms
64 bytes from 10.1.2.1: icmp_seq=2 ttl=231 time=141 ms
                                   <-- missing icmp_seq=3

64 bytes from 10.1.2.1: icmp_seq=4 ttl=231 time=141 ms
64 bytes from 10.1.2.1: icmp_seq=5 ttl=231 time=141 ms
64 bytes from 10.1.2.1: icmp_seq=6 ttl=231 time=141 ms
                                    <-- missing icmp_seq=7

64 bytes from 10.1.2.1: icmp_seq=8 ttl=231 time=176 ms
64 bytes from 10.1.2.1: icmp_seq=9 ttl=231 time=141 ms
64 bytes from 10.1.2.1: icmp_seq=10 ttl=231 time=141 ms

--- 10.1.2.1 ping statistics ---
10 packets transmitted, 8 received, 20% packet loss, time 9012ms
Troubleshooting workflow
1. Determine which direction is causing the intermittent drops
Perform a packet capture (tcpdump, Wireshark, ...) on the destination host (EP B). For ICMP, focus on the sequence number to see the intermittently dropped packets are observed on EP B.
[admin@EP-B ~]$ tcpdump -ni eth0 icmp
11:32:26.540957 IP 10.1.1.1 > 10.1.2.1: ICMP echo request, id 3569, seq 1, length 64
11:32:26.681981 IP 10.1.2.1 > 10.1.1.1: ICMP echo reply, id 3569, seq 1, length 64
11:32:27.542175 IP 10.1.1.1 > 10.1.2.1: ICMP echo request, id 3569, seq 2, length 64
11:32:27.683078 IP 10.1.2.1 > 10.1.1.1: ICMP echo reply, id 3569, seq 2, length 64
11:32:28.543173 IP 10.1.1.1 > 10.1.2.1: ICMP echo request, id 3569, seq 3, length 64   <---
11:32:28.683851 IP 10.1.2.1 > 10.1.1.1: ICMP echo reply, id 3569, seq 3, length 64     <---
11:32:29.544931 IP 10.1.1.1 > 10.1.2.1: ICMP echo request, id 3569, seq 4, length 64
11:32:29.685783 IP 10.1.2.1 > 10.1.1.1: ICMP echo reply, id 3569, seq 4, length 64
11:32:30.546860 IP 10.1.1.1 > 10.1.2.1: ICMP echo request, id 3569, seq 5, length 64
...
- Pattern 1 - All packets are observed on EP B packet capture.
Drops must be in ICMP echo reply (EP B to EP A).
- Pattern 2 - The intermittent drops are observed on EP B packet capture.
Drops must be in ICMP echo (EP A to EP B).
2. Check if another protocol with the same source/destination IP has the same issue
If possible, try to test the connectivity between the two endpoints using a different protocol allowed by the contract between them (such as ssh, telnet, http,..)
- Pattern 1 - Other protocols have the same intermittent drop.
The issue could be in endpoint flapping or queuing/buffering as shown below.
- Pattern 2 - Only ICMP has the intermittent drop.
The forwarding tables (such as endpoint table) likely have no issue because forwarding is based on MAC and IP. Queuing/buffering is not likely the reason either, as this would affect other protocols. The only reason that ACI would make a different forwarding decision based on protocol would be the PBR use-case.
One possibility is that one of spine nodes has an issue. When a protocol is different, the packet with same source and destination could be load balanced to another uplink/fabric port (that is, another spine) by the ingress leaf.
Atomic Counters can be used to ensure packets are not dropped on spine nodes and reach to the egress leaf. In case the packets did not reach the egress leaf, check the ELAM on the ingress leaf to see which fabric port the packets are sent out. To isolate the issue to a specific spine, leaf uplinks can be shut down to force the traffic towards another spine.
3. Check if it is related to an endpoint learning issue
ACI uses an endpoint table to forward packets from one endpoint to another endpoint. An intermittent reachability issue can be caused by endpoint flapping because inappropriate endpoint information causes the packet to be sent out to a wrong destination or to be contract dropped as its classified into the wrong EPG. Even if the destination is supposed to be an L3Out instead of an endpoint group, ensure that the IP is not learned as an endpoint in the same VRF across any leaf switches.
See the "Endpoint Flapping" sub-section in this section for more details on how to troubleshoot endpoint flapping.
4. Check if it is related to buffering issues by changing the traffic frequency
Increase or decrease the interval of ping to see if the drop ratio changes. The interval difference must be large enough.
In Linux, '-i' option can be used to change the interval (sec):
[EP-A ~]$ ping 10.1.2.1 -c 10 -i 5     -- Increase it to 5 sec
[EP-A ~]$ ping 10.1.2.1 -c 10 -i 0.2   -- Decrease it to 0.2 msec
If the drop ratio increases when the interval is decreased, it is likely related to queuing or buffering on endpoints or switches.
The drop ratio to consider is (number of drops/total packets sent) instead of the (number of drops/time).
In such scenario, check these conditions:
- Check if any drop counters on switch interfaces are increasing along with the ping. See "Interface drops" section in the chapter "Intra-Fabric forwarding" for details.
- Check if the Rx counter is increasing along with the packets on the destination endpoint. If the Rx counter is increased with the same number as the transmitted packets, packets are likely being dropped on the endpoint itself. This could be due to endpoint buffering on TCP/IP stack.
For example, if 100000 pings are sent with as short interval as possible, the Rx counter on the endpoint can be observed as it increments by 100000.
[EP-B ~]$ ifconfig eth0
eth0: flags=4163<UP,BROADCAST,RUNNING,MULTICAST>  mtu 1500
       inet 10.1.2.1  netmask 255.255.255.0  broadcast 10.1.2.255
       ether 00:00:10:01:01:02  txqueuelen 1000  (Ethernet)
       RX packets 101105  bytes 1829041
       RX errors 0  dropped 18926930  overruns 0  frame 0
       TX packets 2057  bytes 926192
       TX errors 0  dropped 0 overruns 0  carrier 0  collisions 0
5. Check if ACI is sending the packets out or the destination is receiving the packets
Take a SPAN capture on the egress port of the leaf switch to eliminate ACI fabric from the troubleshooting path.
Rx counters on the destination can also be useful to eliminate the entire network switches from troubleshooting path as shown in the previous steps for buffering.
Endpoint flapping
This section explains how to check for endpoint flapping. Additional details can be foudn in these documents:
- "ACI Fabric Endpoint Learning Whitepaper" on www.cisco.com
- "Cisco Live BRKACI-2641 ACI Troubleshooting: Endpoints" on www.ciscolive.com
When ACI learns the same MAC or IP address in multiple locations, it looks as if the endpoint has moved. This can also be caused by a spoofing device or a mis-configuration. Such behavior is referred to as endpoint flapping. In such a scenario, traffic towards the moving/flapping endpoint (MAC address for bridged traffic, IP address for routed traffic) intermittently fails.
The most effective method to detect endpoint flapping is to use the Enhanced Endpoint Tracker. This app can run as an ACI AppCenter app or as a standalone app on an external server in case it needs to manage a much larger fabric.
Enhanced Endpoint Tracker
DEPRECATION WARNING! This guide was written on 4.2; since then then Enhanced Endpoint Tracker app has been deprecated in favor of functionality on Nexus Dashboard Insights. For more info see Cisco bug ID CSCvz59365  .
.

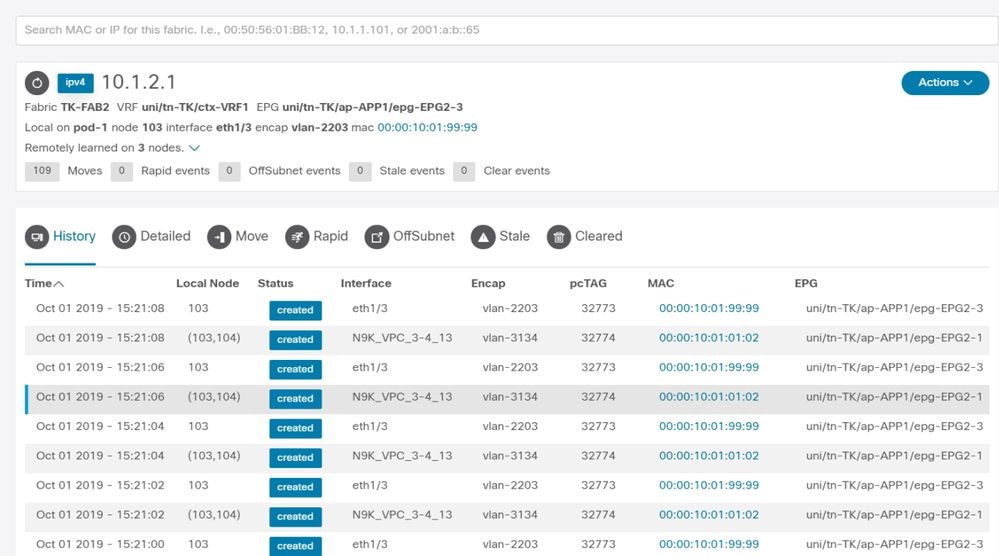
This picture shows the Enhanced Endpoint Tracker in AppCenter. This example shows how to find flapping endpoints with the Enhanced Endpoint Tracker.
Endpoint flapping example

In this example, IP 10.1.2.1 might belong to EP B with MAC 0000.1001.0102. However, an EP X with MAC 0000.1001.9999 is also sourcing traffic with IP 10.1.2.1 due to a mis-config or perhaps IP spoofing.
Enhanced Endpoint Tracker output — Moves

The Enhanced Endpoint Tracker shows when and where IP 10.1.2.1 was learned. As shown in the previous screenshot, 10.1.2.1 is flapping between two endpoints with MAC 0000.1001.0102 (expected) and 0000.1001.9999 (not expected). This causes a reachability issue towards IP 10.1.2.1 because when it is learned on the wrong MAC address, the packet is be sent to a wrong device via the wrong interface. To resolve this, take steps to prevent the unexpected VM from sourcing traffic with an inappropriate IP address.
This example shows endpoint flapping due to an inappropriate configuration.
Topology example that could cause endpoint flapping

When a server or VM is connected to ACI leaf nodes via two interfaces without a VPC, the server needs to use Active/Standby NIC teaming. Otherwise, the packets are load balanced to both uplinks and it would look as if the endpoints are flapping between two interfaces from the ACI leaf switch perspective. In this case, Active/Standby or equivalent NIC teaming mode is required or just use a VPC on the ACI side.
Interface drops
This chapter describes how to check major counters related to ingress interface drop.
Hardware drop counter types
On Nexus 9000 switches running in ACI mode, there are three major hardware counters on the ACI for ingress interface drops.
Forward
Major reasons for drops are:
- SECURITY_GROUP_DENY: A drop because of missing contracts to allow the communication.
- VLAN_XLATE_MISS: A drop because of inappropriate VLAN. For example, a frame enters the fabric with an 802.1Q VLAN 10. If the switch has VLAN 10 on the port, it inspects the contents and make a forwarding decision based on the destination MAC. However, if VLAN 10 is not allowed on the port, it drops it and label it as a VLAN_XLATE_MISS.
- ACL_DROP: A drop because of SUP-TCAM. SUP-TCAM in ACI switches contains special rules to be applied on top of the normal L2/L3 forwarding decision. Rules in SUP-TCAM are built-in and not user configurable. The objective of SUP-TCAM rules is mainly to handle some exceptions or some control plane traffic and not intended to be checked or monitored by users. When a packet is hitting SUP-TCAM rules and the rule is to drop the packet, the dropped packet is counted as ACL_DROP and it increments the forward drop counter.
Forward drops are essentially packets dropped for a valid known reason. They can generally be ignored and do not cause performance penalties, unlike real data traffic drops.
Error
When the switch receives an invalid frame, it is dropped as an error. Examples of this include frames with FCS or CRC errors. See the later section "CRC — FCS — cut-through switching" for more details.
Buffer
When a switch receives a frame, and there are no buffers available for either ingress or egress, the frame is dropped with 'Buffer'. This typically hints at congestion somewhere in the network. The link that is showing the fault could be full, or the link containing the destination is congested.
Gathering Counters using the API
Its worth noting that by leveraging the API and the object model, the user can quickly query the fabric for all instances of these drops (run these from an apic) -
# FCS Errors (non-stomped CRC errors)
moquery -c rmonDot3Stats -f 'rmon.Dot3Stats.fCSErrors>="1"' | egrep "dn|fCSErrors"

# FCS + Stomped CRC Errors
moquery -c rmonEtherStats -f 'rmon.EtherStats.cRCAlignErrors>="1"' | egrep "dn|cRCAlignErrors"

# Output Buffer Drops
moquery -c rmonEgrCounters -f 'rmon.EgrCounters.bufferdroppkts>="1"' | egrep "dn|bufferdroppkts"

# Output Errors
moquery -c rmonIfOut -f 'rmon.IfOut.errors>="1"' | egrep "dn|errors"
Viewing drop stats in CLI
If faults are noted, or there is a need to check packet drops on interfaces using the CLI, the best way to do this is by viewing the platform counters in hardware. Not all counters are shown using 'show interface'. The three major drop reasons can only be viewed using the platform counters. In order to view these, perform these steps:
Leaf
SSH to the leaf and run these commands. This example is for ethernet 1/31.
ACI-LEAF# vsh_lc
module-1# show platform internal counters port 31
Stats for port 31
(note: forward drops includes sup redirected packets too)
IF          LPort                    Input                       Output
                              Packets       Bytes          Packets    Bytes
eth-1/31    31  Total          400719   286628225      2302918    463380330
                   Unicast     306610   269471065       453831     40294786
                   Multicast        0           0      1849091    423087288
                   Flood        56783     8427482            0            0
                Total Drops     37327                        0
                   Buffer           0                        0
                   Error            0                        0
                   Forward      37327
                   LB               0
                   AFD RED                                   0
...
Spine
A fixed spine (N9K-C9332C and N9K-C9364C) can be checked using the same method as the leaf switches.
For a modular spine (N9K-C9504, ...), the linecard must be attached to before the platform counters can be viewed. SSH to the spine and run these commands. This example is for ethernet 2/1.
ACI-SPINE# vsh
ACI-SPINE# attach module 2
module-2# show platform internal counters port 1
Stats for port 1
(note: forward drops include sup redirected packets too)
IF          LPort                    Input                       Output
                              Packets       Bytes          Packets    Bytes
eth-2/1      1  Total        85632884  32811563575     126611414   25868913406
                   Unicast   81449096  32273734109     104024872   23037696345
                   Multicast  3759719   487617769     22586542   2831217061
                   Flood            0           0            0            0
                Total Drops         0                        0
                   Buffer           0                        0
                   Error            0                        0
                   Forward          0
                   LB               0
                   AFD RED                                   0
...
Queuing stats counters are shown using 'show queuing interface'. This example is for ethernet 1/5.
ACI-LEAF# show queuing interface ethernet 1/5
================================================================================
                 Queuing stats for ethernet 1/5
================================================================================
================================================================================
                 Qos Class level1
================================================================================
Rx Admit Pkts :  0                      Tx Admit Pkts :  0
Rx Admit Bytes:  0                      Tx Admit Bytes:  0
Rx Drop Pkts  :  0                      Tx Drop Pkts  :  0
Rx Drop Bytes :  0                      Tx Drop Bytes :  0

================================================================================
                 Qos Class level2
================================================================================
Rx Admit Pkts :  0                      Tx Admit Pkts :  0
Rx Admit Bytes:  0                      Tx Admit Bytes:  0
Rx Drop Pkts  :  0                      Tx Drop Pkts  :  0
Rx Drop Bytes :  0                      Tx Drop Bytes :  0

================================================================================
                 Qos Class level3
================================================================================
Rx Admit Pkts :  1756121                Tx Admit Pkts :  904909
Rx Admit Bytes:  186146554              Tx Admit Bytes:  80417455
Rx Drop Pkts  :  0                      Tx Drop Pkts  :  22
Rx Drop Bytes :  0                      Tx Drop Bytes :  3776

...
Viewing statistics in GUI
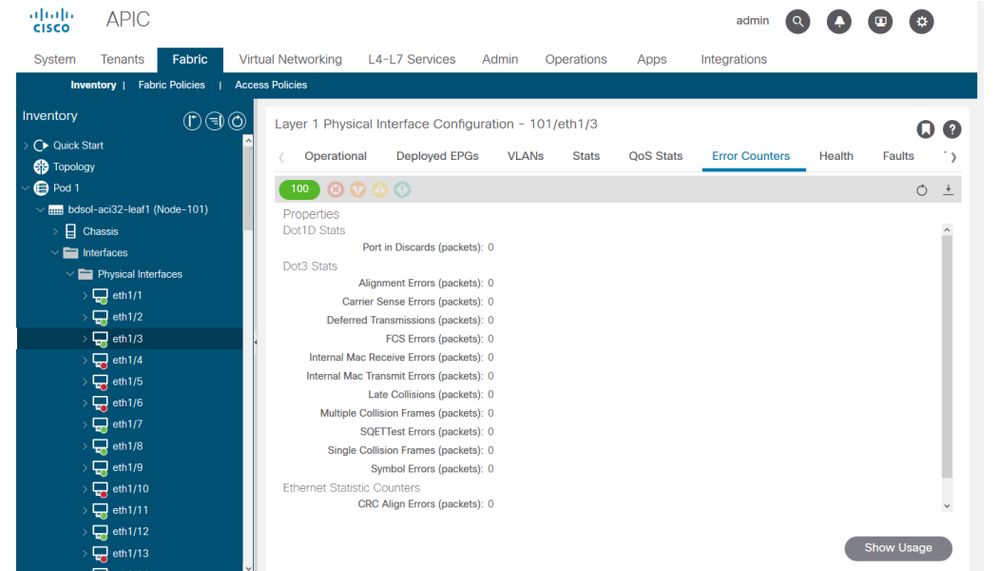
The location is 'Fabric > Inventory > Leaf/Spine > Physical interface > Stats'.
GUI interface statistics

The error statistics can be seen in the same place:
GUI interface errors

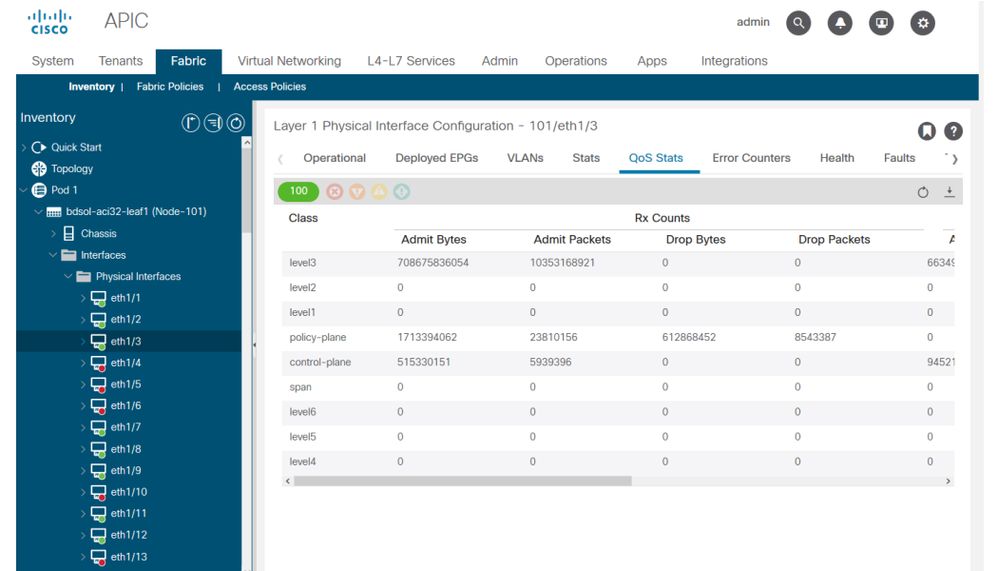
And finally, the GUI can display QoS stats per interface:
GUI interface QoS counters

CRC — FCS — cut-through switching
What is cyclic redundancy check (CRC)?
CRC is a polynomial function on the frame which returns a 4B number in Ethernet. It catches all single bit errors and a good percentage of double bit errors. It is thus meant to ensure that the frame was not corrupted in transit. If the CRC error counter is increasing, it means that when the hardware ran the polynomial function on the frame, the result was a 4B number which differed from the 4B number found on the frame itself. Frames can get corrupted due to several reasons such as duplex mismatch, faulty cabling, and broken hardware. However, some level of CRC errors are expected and the standard allows up-to 10-12 bit-error-rate on Ethernet (1 bit out of 1012 can flip).
Store-and-forward vs cut-through switching
Both store-and-forward and cut-through Layer 2 switches base their forwarding decisions on the destination MAC address of data packets. They also learn MAC addresses as they examine the source MAC (SMAC) fields of packets as stations communicate with other nodes on the network.
A store-and-forward switch makes a forwarding decision on a data packet after it has received the entire frame and checked its integrity. A cut-through switch engages in the forwarding process soon after it has examined the destination MAC (DMAC) address of an incoming frame. However, a cut-through switch must wait until it has viewed the entire packet before performing the CRC check. That means that by the time CRC is validated, the packet has already been forwarded and cannot be dropped if it fails the check.
Traditionally, most network devices used to operate based on store-and-forward. Cut-through switching technologies tend to get used in high speed networks that demand low latency forwarding.
Specifically, regarding generation 2 and later ACI hardware, cut-through switching is done if the ingress interface is a higher speed, and the egress interface is the same speed or a lower speed. Store-and-forward switching is done if the ingress interface speed is lower than the egress interface.
Stomping
Packets with a CRC error necessitate a drop. If the frame is being switched in a cut-through path, CRC validation happens after the packet is already forwarded. As such, the only option is to stomp the Ethernet Frame Check Sequence (FCS). Stomping a frame involves setting the FCS to a known value that does not pass a CRC check. Because of this, one bad frame that fails CRC could show up as a CRC on every interface it traverses, until it reaches a store-and-forward switch which drops it.
ACI and CRC: look for faulty interfaces
- If a leaf sees CRC errors on a downlink port, it is mostly a problem on the downlink SFP or with components on the external device/network.
- If a spine sees CRC errors, it is mostly a problem on that local port, SFP, Fiber or Neighbor SFP. CRC failing packets from leaf downlinks are not stomped to the spines. As if its headers are readable, it is VXLAN encapsulated and new CRC is computed. If the headers were not readable from frame corruption, the packet would be dropped.
- If a leaf sees CRC errors on fabric links, it can either be:
- An issue on the local fiber/SFP pair, the spine ingress fiber, or the SFP pair.
- A stomped frame making its way through the fabric.
Stomping: troubleshoot stomping
- Look for interfaces with FCS errors on the fabric. Since FCS occurs local to a port, it is most likely the fiber or SFP on either end.
- CRC errors on 'show interface' output reflects the total FCS+Stomp value.\
Look at an example:
Check on a port with the command
vsh_lc: 'show platform internal counter port <X>'
In this command 3 values are important:
- RX_FCS_ERR - FCS failure.
- RX_CRCERR - Received stomped CRC error frame.
- TX_FRM_ERROR - Transmitted stomped CRC error frame.
module-1# show platform internal counters port 1 | egrep ERR
        RX_FCS_ERR           0     ---- Real error local between the devices and its direct neighbor
        RX_CRCERR            0     ---- Stomped frame --- so likely stomped by underlying devices and generated further down the network
        TX_FRM_ERROR         0     ---- Packet received from another interface that was stomp on Tx direction
CRC stomp troubleshooting scenario

If a corrupted link generates a large number of corrupted frames, those frames could be flooded to all other leaf nodes and it is very possible to find CRC on the ingress of fabric uplinks of most leaf nodes in the fabric. Those would likely all come from a single corrupted link.
Revision History
| Revision | Publish Date | Comments |
|---|---|---|
2.0 |
08-Sep-2022 |
Correction to "Store-and-forward vs cut-through switching" Section |
1.0 |
10-Aug-2022 |
Initial Release |
Contributed by Cisco Engineers
- ACI Escalation Engineers
- Technical Marketing
Contact Cisco
- Open a Support Case

- (Requires a Cisco Service Contract)
 Feedback