TelePresence MCU Hardware Troubleshoot Guide
Available Languages
Download Options
Bias-Free Language
The documentation set for this product strives to use bias-free language. For the purposes of this documentation set, bias-free is defined as language that does not imply discrimination based on age, disability, gender, racial identity, ethnic identity, sexual orientation, socioeconomic status, and intersectionality. Exceptions may be present in the documentation due to language that is hardcoded in the user interfaces of the product software, language used based on RFP documentation, or language that is used by a referenced third-party product. Learn more about how Cisco is using Inclusive Language.
Contents
Introduction
This document describes the procedures used in order to troubleshoot Cisco TelePresence Multipoint Control Unit (MCU) products. The document is written for Video System Administrators and for Cisco Partners whose customers are Video System Administrators.
The MCU range of products are industry-leading multimedia conferencing products. They are complex embedded systems, with hardware designed by Cisco in order to give the best performance. This document is intended to facilitate the resolution of any situation that might be caused by a hardware failure of a Cisco MCU product. A Return to Manufacturing Authorization (RMA) must be given by a Cisco Technical Support Engineer, who verifies that the product truly has failed through a range of tests, dependent upon the suspected component. This guide aims to accelerate this process with insight into these tests.
Prerequisites
Requirements
Cisco recommends that you have knowledge of these topics:
- Cisco TelePresence MCU MSE Series
- Cisco TelePresence MCU 5300 Series
- Cisco TelePresence MCU 4500 Series
- Cisco TelePresence MCU 4200 Series
- Cisco TelePresence ISDN Gateway (GW) Series
Components Used
The information in this document is based on the Cisco TelePresence MCU Media Services Engine (MSE) Series.
The information in this document was created from the devices in a specific lab environment. All of the devices used in this document started with a cleared (default) configuration. If your network is live, make sure that you understand the potential impact of any command.
Related Products
This document can also be used with these hardware and software versions:
- Cisco Telepresence Server 7010
- Cisco Telepresence MCU 5300 Series
- Cisco Telepresence MCU 4500 Series
- Cisco Telepresence MCU 4200 Series
- Cisco Telepresence ISDN Gateway Series
Cisco TelePresence MCU MSE Series RMA Checklist
This section describes some of the more basic checks that are used in order to confirm that your MCU MSE Series blade is operational, and does not suffer from a hardware fault. The MCU behavior should be documented as these checks are completed.
Complete a Quick Check on the MCU
This section provides a checklist that you can use in order to troubleshoot the basic configuration of an MCU through its web interface. This is completed with verifications of the H.323 settings, Auto Attendant, port license usage, and loopback calls.
Verify that the blade can make a video call. If the MCU web interface can be accessed, and a call can be made, it is fundamentally functional. Complete these steps:
- Open a web browser and navigate to the MCU IP address. The home page must display right away.
Note: If the web page is inaccessible, refer to the Check the MCU Network Connectivity section of this document.
- Click the Status link in order to check the software release that currently runs on the MCU.
Note: If a version earlier than Version 4.3 is currently used, it is recommended that you review the most recent release notes and consider an upgrade.
- If you are able to access the web interface, complete these steps:
- Navigate to Settings > H.323, and set H.323 gatekeeper usage to Disabled. This step is essential because some gatekeepers prevent the calls directly from an MCU to an IP address.
- Navigate to Settings > Conferences > Advanced Settings, and ensure that Incoming calls to unknown conferences or auto attendants is set to Default Auto Attendant.
- Create a new conference, and add an H.323 participant with an IP address of 127.0.0.1. This causes the MCU to dial back to its own Auto Attendant (AA). The AA screen displays in the preview thumbnail, and both audio and video codecs are negotiated in each direction.
Here is an example of the MCU MSE 8510 screen when the MCU can successfully call itself: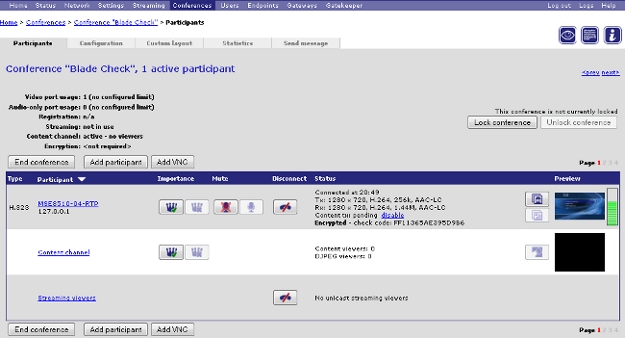
If this works, and a connected participant is seen (similar to the previous image), most likely there is a gatekeeper, network, or endpoint interoperability problem. Dial a real endpoint, and troubleshoot from there with the event log and H323/Session Initiation Protocol (SIP) log. If the connection fails immediately, but the web interface still works, continue with this procedure. - In order to verify that the port licenses are assigned to the MCU, go to the Port License management section of the Supervisor blade. Here is an image that shows the port license allocation from the Supervisor MSE 8050 blade:

In the image, the empty block under Slot 4 shows that there is a blade in this slot with no port licenses allocated to it. This blade is unable to make calls, so the loopback test described in step 3 would have failed on this blade. The blue blocks under Slots 2, 3, 5, and 7 show that those slots have a full allocation of port licences. If a slot shows a warning symbol, then there is no blade in the slot. A half-blue block indicates that the blade has some port licences allocated to it, but not that it is at full capacity. A blade like this is unable to connect its total advertised number of ports until it has more licences allocated to it. - Assign port licenses if there are none assigned to the blade (this process is described in the online help). If no keys are present for port licenses, contact your account manager.
- Navigate to Settings > H.323, and set H.323 gatekeeper usage to Disabled. This step is essential because some gatekeepers prevent the calls directly from an MCU to an IP address.
Note: If the call fails, even if the blade has sufficient port licenses, reference the Reach MCUs on the Web Interface section of this document. If the web interface becomes unavailable during this test, and contact with the blade is lost, the blade might have rebooted; retrieve the blade diagnostic log, and contact Cisco Technical Support.
Check the MCU Network Connectivity
Use this section in order to troubleshoot issues with attempts to connect to the MCU web interface from a browser, based on verification of network connectivity and network configuration.
You might encounter one of these issues when you attempt to connect to the MCU web interface from a browser:
- A problem with the network between the PC and the MCU
- A problem with the MCU itself (Network Interface Card (NIC), hardware, or configuration)
Complete these steps in order to troubleshoot the issue:
- Attempt to ping the IP address of the MCU.
Note: NetBSD products have a maximum size of 76 bytes. Most routers have a default of 100 bytes.
If the MCU responds to pings, but the web interface is down, the MCU might have failed to boot fully, or it might be locked into a reboot cycle. If this is the case, reference the Physical Checks on the Blade section of this document. If the MCU does not respond to pings, continue with this procedure. - Navigate to the web interface of the Supervisor MSE 8050 blade of the chassis that contains the MCU MSE 8510 blade. If the Supervisor blade user interface cannot be reached, then contact your local network administrators in order to investigate a possible network issue. If the Supervisor blade user interface can be reached, and the Supervisor and the MCU are not on different networks, then it is likely that the problem is with the blade or its IP settings.
- From the Supervisor blade user interface, navigate to Hardware, and click the slot number link of the MCU MSE 8510 blade. Then, click the Port A tab.
- Check the MCU Port A IP configuration, and confirm that no other host on the network is assigned the same IP address. Duplicate IP addresses are a surprisingly common problem. If necessary, consult with the Network Administrator in order to verify these settings.
- Check the Port A Ethernet status section. If the Link status is not up, check that the network cable is connected to the switch. There might be a problem with the cable or switch port.
- If the MCU is now reachable on the network, repeat the first step of this procedure. If the IP address settings are correct and the Ethernet Link status is up, but the blade is still not able to be contacted from anywhere on the network, reference the Check the MCU MSE 8510 Series Blade through the Supervisor section of this document.
Check the MCU MSE 8510 Series Blade through the Supervisor
Complete these steps in order to check the MCU blade and conference status, health and reports on uptime, software version, temperature, and voltage:
- Click Hardware, and click the slot number of the blade that has the issue. The summary page provides information about:
- The Blade status, with the IP address, Uptime, Serial number, and Software version
- The Blade health, with Temperatures, Voltage, and Real-Time Clock (RTC) battery
- The Reported status for active conferences, number of participants, audio/video ports in use, and streaming viewers
This image shows the Blade health section:
- If any Voltage status (current or worse) does not appear OK, then ensure that enough rectifiers are installed in the power shelves that power the chassis. Also, check that the power source meets the current requirements of the chassis, as detailed in the Calculating power and current requirements for an MSE 8000 Cisco article.
- If the Power Supply provision does not show OK, contact Cisco Technical Support.
- If any of the other Current statuses in the Blade health section do not show as OK, contact Cisco Technical Support.
- If all of the Current statuses show OK, but one or more of the Worst status seen does not show OK, obtain the event log and alarm logs from the Supervisor, and contact Cisco Technical Support.
- Check the uptime. If the uptime is unexpectedly short (less than 30 minutes), and there is no known reason (if it was not power-cycled or the blade has not reseated, for example), then the blade might have recently rebooted. The cause of the reboot might be a software defect or a hardware problem. This depends on whether it is a one-time reboot, or cyclical.
Complete these steps in order to determine this:- Wait 30 minutes.
- Refresh the page.
- Check the uptime again.
If you can determine from the refreshed uptime that the blade has subsequently rebooted again, reference the Crashes section of this document. - Wait 30 minutes.
- If the blade does not reboot after you check the status page, and it appears functional in every other respect (through verification of the network settings and port licenses), then it is possible that the blade might have booted without any of its Digital Signal Processor (DSP) resources available.
Complete these steps in order to verify this:- Check the Reported status section on the blade summary page from the Supervisor user interface:

- The blade shows the total number of video resources that it has successfully booted and licensed. This must be equal to the number of port licences that are assigned to the blade, up to a maximum of 20 when the blade is in High Definition (HD)/HD+ mode, or 80 when the blade is in Standard Definition (SD) mode. If these are not equal, then contact Cisco Technical Support with the documented behavior, versions, and the diagnostic log.
- Check the Reported status section on the blade summary page from the Supervisor user interface:
Physical Checks on the Blade
This section describes the steps that are used in order to perform physical checks on the blade, based on LED light interpretation and movement of the blade to a different slot.
If you cannot determine that the blade has a hardware problem after you complete the steps described in the previous sections, physically check the MSE 8000 Series chassis. Complete these steps in order to perform the physical check:
- Ensure that sufficient time is given for the blade to boot after you initially power on the chassis (or install the blade into a chassis that is already powered). This takes approximately 20 minutes.
- Observe and note the color of the LED lights that are illuminated on the front of the blade. The important LED lights are:
- Power (blue) - This light is located just above the bottom plastic tab, and is illuminated as soon as power is applied to the blade.
- Status (green) - This light is illuminated when the blade is successfully booted.
- Alarm (red) - This light is lluminated when the blade is booting or is in a state where it cannot boot.
- Ethernet Port A link (three green) - The light indicates the activity, duplex, and speed. As of Release 4.4, the 8510 only supports connections on Port A; Ports B, C, and D are not supported.
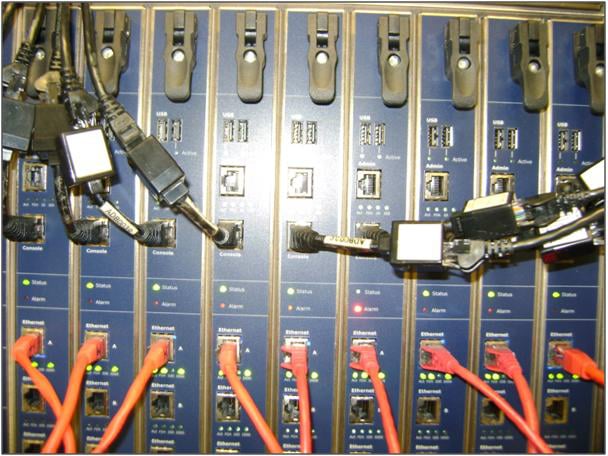
- Power (blue) - This light is located just above the bottom plastic tab, and is illuminated as soon as power is applied to the blade.
- Complete these steps if you encounter problems when you observe the LED lights:
- If none of the lights are illuminated, check that the rest of the chassis has power to it, and that the blade is properly inserted into the slot.
- If the lights still do not illuminate, move the blade to a different slot in the chassis. Preferably, interchange it with a slot that has a known working blade.
- If the blade still does not power up, contact Cisco Technical Support.
- If the blue Power light is illuminated, and none of the other lights are, contact Cisco Technical Support. If the red Alarm light remains illuminated for longer than 30 minutes, reference the Crashes section of this document.
- If the blue Power light and the green Status light are illuminated, but the green Port A light is not, an RMA is not necessary. This indicates a problem with the connection to the switch port. Use a new cable/switch port/switch, and check the blade Ethernet Port A configuration from the Supervisor Hardware tab. It is strongly recommended that both sides of the link are set for Auto negotiation.
Note: When troubleshooting, it is important to obtain a serial log and diagnostic log. These should be provided when you open a service request with Cisco Technical Support.
- If none of the lights are illuminated, check that the rest of the chassis has power to it, and that the blade is properly inserted into the slot.
Reach MCUs on the Web Interface
Cisco Telepresence MCUs can be accessed via a console session through the console cable that is supplied with the unit. If the system is not accessible via the web interface, and does not respond to ping requests, you can open a console session to the unit in order to troubleshoot it with checks of the enabled services, port configuration, and status.
Complete these steps in order to reach the MCU if the system is not ping-able, or you cannot navigate to the web interface of the system after it is assigned an IP address:
- Verify that no red Alarm lights are illuminated on the front of the unit. If the unit is powered on for over 20 minutes, and the red Alarm light remains illuminated, refer to the Crashes section of this document.
- If the green Status light is illuminated on the device, connect your PC to the console port through the supplied console cable that arrived with the unit.
Note: Reference the Connecting to the console port on a Cisco acquired Codian unit Cisco article for instructions about how to complete this step.
- In order to verify that the terminal session connected is actually connected, press the Enter key a few times and the prompt appears. The prompt that displays shows your device (IPGW:>, ISDNGW:>, or MCU:>, for example):
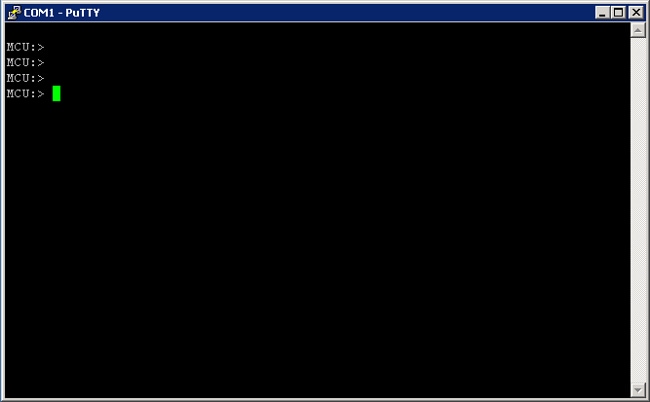
- In order to verify that the HTTP and/or HTTPS services are enabled, enter the service show command:
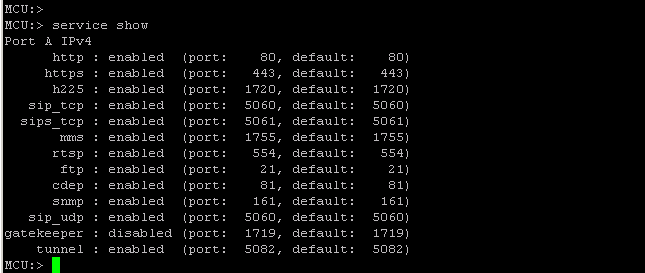
- In order to verify the link status on the device, enter the status command:

- If no link appears on Port A, attempt to connect your Ethernet cable to Port B in order to see if the link status changes:

- If Port B is able to detect the link but Port A is not, then complete these steps in order to check the IP configuration on Port A again:
- If Port A appears to have no issue, then attempt a reset_config procedure in order to bring the unit back to factory default settings.
Note: Reference the Resetting a password and restoring a unit to its factory settings Cisco article for more information on this procedure.
- Once the factory reset process is complete, reconfigure a static IP address on the port.
- If you still experience issues, reboot the system from the console, and collect the output from the boot into a text file through the terminal client that is used:
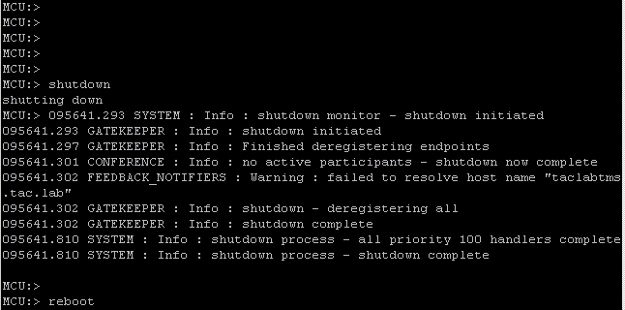
MCU MSE 8510 Series blades and MCU MSE 8710 Series blades show the two Ethernet interfaces as vfx0 and vfx1. Rack-mountable systems (MCU 4500 Series and 4200 Series, IPGW 3500 Series, and ISDN GW 3241 Series) show their Ethernet interfaces as bge0 and bge1.
- If Port A appears to have no issue, then attempt a reset_config procedure in order to bring the unit back to factory default settings.
- On MCU MSE 8510 and 8710 Series blades, verify that the MAC addresses are assigned, and that there are no problems with vfx0 and or vfx1.
- On rack-mountable units, you might see the output illustrated in the next image, with bge0, which is indicative of a Network Interface Card (NIC) failure on the device. This shows that the physical layer is not detected. If this is seen, contact Cisco Technical Support.

- If no link appears after you swap the port, verify the network connectivity. Ideally, the output should appear as illustrated in the next image, with all IP information shown. This indicates that the IP settings on the unit are configured correctly.
Note: The IP address information is obscured in the image for security reasons.

- Change the IP address on the unit in order to discover an issue with any set of IP addresses on the network.
- Move the Ethernet cable to a separate switch port in order to eliminate any switch port issues.
- If a switch port issue is eliminated, connect a laptop directly to the unit through a crossover cable, and configure the laptop with the same subnet mask, default gateway, and IP address that is contained within that subnet.
- Once the IP address is configured on the laptop, send a ping from the laptop to the unit. Attempt to reach the web interface of the unit from the laptop. Also, attempt to send a ping from the unit console session to the laptop IP address via the ping command. If there is connectivity and web access, it indicates a network connectivity issue. If not, then it is possible that an Ethernet port pin is damaged, and you should contact Cisco Technical Support.
Crashes
A crash on a Cisco Telepresence MCU product can be caused by a failure to boot completely, a continuous reboot cycle, or an incident that occurs with a continuous conference.
If the red Alarm light on the unit remains illuminated for more than 20 minutes, you cannot navigate to the unit web interface, or you are unable to make video calls, then it is likely that the unit has failed to boot fully or that it is stuck in a reboot cycle. If this is the case, complete these steps in order to troubleshoot the issue:
- Unplug the unit power lead. If it is a blade, remove it from the chassis.
- Wait for five minutes, and power on the unit.
- If the unit does not boot normally, collect a console log, which shows the unit that attempts to boot. This is the best diagnostic tool for this situation. Reference the Connecting to the console port on a Cisco acquired Codian unit Cisco article for information about how to obtain a console log.
- Power off the unit, and then power on the unit.
- Wait until either the output stops completely, or the unit has rebooted three or four times. Contact Cisco Technical Support, and provide the console log.
Troubleshoot the MSE 8000 Series Fan Tray, Power Rectifiers, and Power Shelf
The fan tray, power rectifiers, and power shelves are all monitored through the Supervisor MSE 8050 Series blade. You can troubleshoot any failure or issue related to these through the Supervisor web interface. This section describes the steps used in order to troubleshoot a fan, power shelf, or power rectifier failure through verification of the logs and the status.
Here is an image that shows the full MSE 8000 Series chassis:
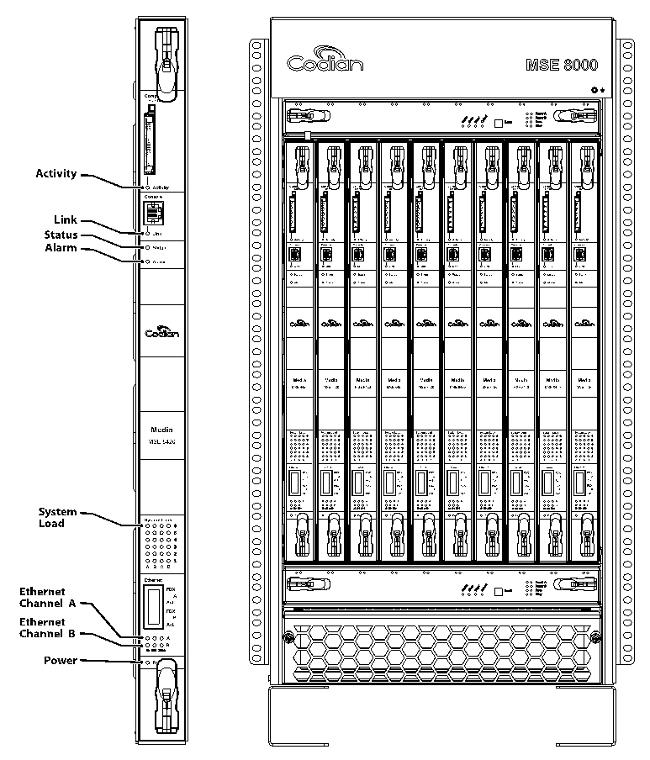
Note in the previous image:
- The upper and lower fan trays
- The inserted blades
- The close-up of an individual blade
- The rack mounts
Note: For more information about how to install the MSE 8000 Series chassis, reference the Cisco TelePresence MSE 8000 Getting started guide.
Troubleshoot an MSE 8000 Series Fan Failure
Use this section in order to troubleshoot fan failures on an MSE 8000 Series chassis through verifications of the alarm status and event logs on the Supervisor MSE 8050 Series blade.
Here is an exerpt from an event log that shows issues with the upper fan tray:
37804 2012/07/03 18:43:28.567 HEALTH   Warning
 upper fan tray, fan 3 too slow - 1569 rpm

37805 2012/07/03 18:43:28.567 ALARMS   Info
 set alarm : 2 / Fan failure SET

37806 2012/07/03 18:43:44.568 ALARMS   Info
 clear alarm : 2 / Fan failure CLEAR

37807 2012/07/03 18:44:00.569 HEALTH   Warning
 upper fan tray, fan 3 too slow
When you see errors such as these, complete these steps in order to gather the required logs:
- In order to download the alarm logs text file, navigate to Alarms > Alarms Log > Download as Text. Observe the most recent date that this was logged.
- In order download the event log text file, navigate to Logs > Event Log > Download as Text.
- Navigate to Alarms > Alarms Status, and take a screen shot of the Alarm Status page.
- Remove the top fan tray, and verify that all of the fans work properly.
- Remove the bottom fan tray, and verify that all the fans work properly.
- In order to clear the Historic Alarms from the Supervisor, navigate to Alarms > Alarms Status > Clear Historic Alarms.
- In order to clear the Alarms Log, navigate to Alarms > Alarms Log > Clear Log.
- Monitor, and see if the alarms return.
- If the issue returns, swap the top tray with the bottom tray, and determine if the issue follows the fan tray. If the issue returns and follows the fan tray, contact Cisco Technical Support with the logs that you collected.
Power Shelf Issues
Within the MSE 8000 Series chassis, there are two independent DC power inputs that you can either connect directly to two DC power supplies, or to two Valere shelves that convert AC to DC. The MSE 8000 Series chassis can be operated with one or two power shelves - A and B. These feed power independently to every fan tray and blade. The unit can be fully-powered from either supply A or supply B. In the event that either of the power supplies fail, the unit continues to operate, because it draws power from the other supply.
Cisco recommends that, for full redundancy and maximum reliability, the power feeds must be connected to independent power sources. Each must have the capacity to provide the full electrical load of the unit and each shelf that contains the same number of rectifiers.
This image shows the MSE 8000 Series DC power shelf:
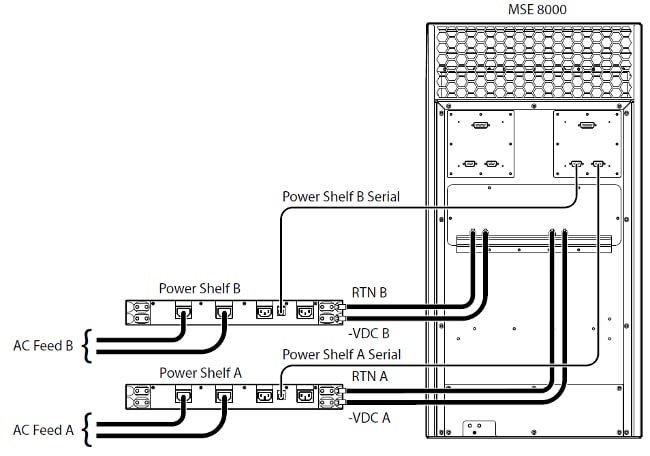
Here are two common power shelf issues that you might encounter:
- Lost Contact with Power Shelf - When you navigate to Hardware > Power Supplies, Supply A shows Lost Contact with Power Shelf. This means that the Supervisor MSE 8050 Series is unable to communicate with the power shelf.
- 10/External supply out of range SET - This means that the input voltages to the chassis are out of specification. Verify that the correct power and current is provided to the chassis via the Calculating power and current requirements for an MSE 8000 online tool.
If there are no discrepancies encountered when you perform the power and current verification previously mentioned, retrieve this information and contact Cisco Technical Support:
- MSE 8050 Series Supervisor configuration
- Audit log
- Alarm log
- Event log
- Screenshot of Alarm Status page
- Number and model of blades in the chassis
- Status of the power supplies
Configure Power Status Monitoring
Cisco recommends that you have power status monitoring configured in order to provide reliable feedback to the video administrator with regards to any errors, warnings, or other important information seen in the logs.
In order to enable monitoring of the power supply voltages, as well as the AC-to-DC power shelves (if required), complete the steps on page 61 of the Cisco TelePresence Supervisor 2.3 Online help (printable format). Clear the logs after the power status configuration is complete.
Check the power shelf monitoring cable that runs from the back of the power shelf to the chassis. This is a special cable that is used for power shelf monitoring. Take care when you check the cable, as it can be easily confused with a regular DB9-RJ45 console cable. The power shelf monitoring cable is labelled with a sticker that says Power Shelf Rear:
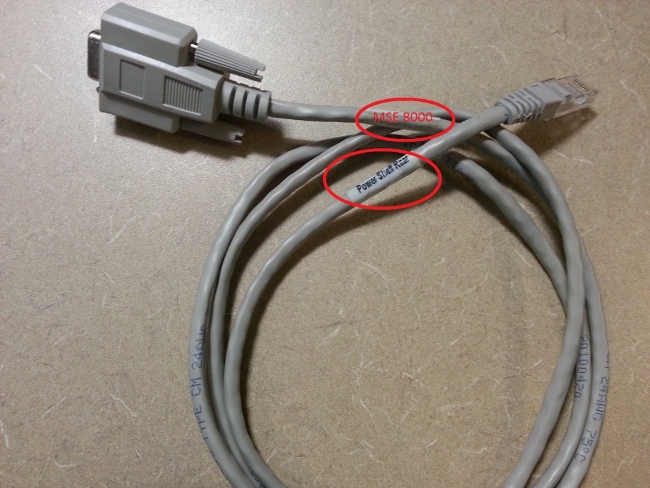
There are two pairs of connectors located at the back of the MSE 8000 Series chassis: the pair on the left is labelled Slot 10, and the pair on the right is labelled Slot 1. Ensure that the monitoring cables are connected to Slot 1, which are the connectors that represent the MSE 8050 Series Supervisor slot.
If you encounter any issues with the power shelf monitoring configuration, complete these steps:
- Swap the power shelf monitoring cable from Shelf A to Shelf B in order to determine if the issue follows the cable. If the problem follows the cable, contact Cisco Technical Support.
- Swap the NIC cards around from Power Shelf A and Power Shelf B in order to determine if the NIC cards are the cause of the issue. If the alarms return, and the issue follows the NIC card, contact Cisco Technical Support.
This image shows the power shelf NIC card:
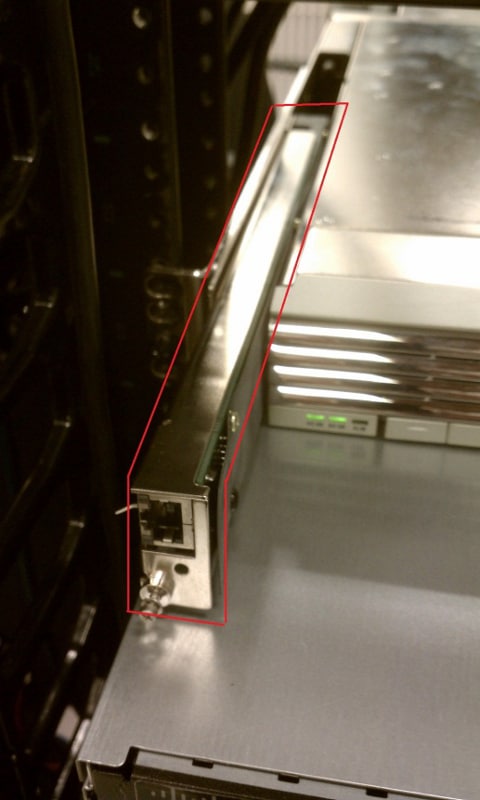
Troubleshoot Power Rectifiers
In some cases, you might encounter issues with one of the power rectifiers. This section describes how to troubleshoot these issues.
Here is a front view of the power shelf with rectifiers:

Here is the back view of the power shelf:

Complete these steps in order to resolve an issue with power rectifiers:
- If an error appears on the rectifier, reseat it and wait to see if the error still appears (the rectifiers are hot-pluggable).
- If the error still appears after a few minutes, seat the rectifier into a different slot of Power Shelf A or B in order to determine if the issue is with the rectifier or the power shelf slot.
- If you still experience issues, contact Cisco Technical Support and provide this information:
- Picture of the rectifier in the alarm state
- Serial number of the rectifier (located on either the left of right side of the rectifier)
- Screenshot of the Power Supplies page (Hardware > Power Supplies)
- Screenshot of the Health Page (Status > Health)
- Audit log
- Alarm log
- Event log
Troubleshoot Cisco TelePresence ISDN GW Issues
Cisco Telepresence ISDN GWs provide seamless integration between IP and ISDN networks with complete feature transparency via ISDN. This section describes how to troubleshoot ISDN PRI interfaces and buffers on DSPs.
PRI Layer 1 and Layer 2 Down
Use this section in order to troubleshoot PRI interface issues on the ISDN GW. The PRI port can be checked with the loopback plug in order to determine if it is faulty:
- Layer 1 (L1) indicates the physical layer, or PRI connectivity.
- Layer 2 (L2) is used for signaling.
You can use a loopback cable in order to determine the L1 status for the PRI port on the ISDN GW. Connect Pin1 to Pin4, and Pin2 to Pin5 in order to create the loopback cable.
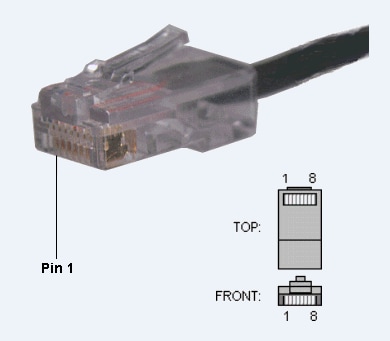
Plug the loopback cable into Port 1, and check for the L1 status. If the L1 status on Port 1 appears Up, it is likely that the issue is caused by the cables that are used. You can use the loopback cable further down the line in order to isolate the problem.
If the L1 status on Port 1 appears Down with the loopback cable, enable Port 2 for PRI on ISDN GW. Test Port 2 with the loopback cable as well. If the problem remains with a specific port, it is possible that there is a PRI port failure. Contact Cisco Technical Support.
Ping Pong Errors and DSP Timeouts
There are two buffers on a DSP that are referred to as Ping and Pong. Each buffer processes ten milliseconds of data (one ISDN frame) at a time. The intention is to process one buffer while you read the next. If these two buffers fall out of sync with each other, they swap in an attempt to get back in sync.
Here is an example from the Cisco Telepresence ISDN GW event log, where the buffers fall out of sync and attempt to correct themselves:
14031 2012/02/29 13:03:05.143 dspapi Warning DSP(05):
 "Ping Pong buffer returned to sync 0, 11111111"

14032 2012/02/29 13:03:05.399 dspapi Error DSP(05):
 "Ping Pong buffer out of sync 1, 11111111"

14033 2012/02/29 13:03:05.399 dspapi Info DSP(05):
 "Attempt to correct Ping Pong buffer sync"

14034 2012/02/29 13:03:05.400 dspapi Warning DSP(05):
 "Ping Pong buffer returned to sync 0, 11111111"

14035 2012/02/29 13:03:05.856 dspapi Error DSP(05):
 "Ping Pong buffer out of sync 1, 11111111"

14036 2012/02/29 13:03:05.856 dspapi Info DSP(05):
 "Attempt to correct Ping Pong buffer sync"

14037 2012/02/29 13:03:05.862 dspapi Warning DSP(05):
 "Ping Pong buffer returned to sync 0, 11111111"

14064 2012/02/29 13:03:21.626 dspapi Info DSP(04):
 "receive from local primary dsp timeout"

14065 2012/02/29 13:03:21.626 dspapi Info DSP(03):
 "receive from local primary dsp timeout"

14066 2012/02/29 13:03:21.638 dspapi Info DSP(15):
 "receive from peer primary dsp timeout (rx)"
Here are some questions to consider:
- Why do they fall out of sync?
- Is it possible that invalid frames, a faulty ISDN clock, or an unreliable PRI cause the issue?
Here is a list of information to gather:
- How many PRIs are connected to this GW?
- Are all of the PRIs from the same switch or from different switches?
- If all of the PRIs are unplugged and the system is rebooted, do the errors continue? Collect a console log that shows these errors.
- If only PRI 1 is connected, do the errors return?
- If only PRI 2 is connected, do the errors return? Repeat with all PRIs, one at a time.
If PRIs from different switches are used, the PRI clocks must be in sync (PRIs from the same Telco normally are). It is possible that the PRI from one switch has a clock that is completely out of sync with the clock of the PRI on the other switch. If only one PRI is connected and seems okay, then connect one PRI from one switch and one PRI from the other, reboot the system, and see if the errors return. Record your tests and behavior to provide to Cisco Technical Support if needed.
Related Information
Revision History
| Revision | Publish Date | Comments |
|---|---|---|
1.0 |
19-Nov-2013 |
Initial Release |
Contributed by Cisco Engineers
Contact Cisco
- Open a Support Case

- (Requires a Cisco Service Contract)
 Feedback