Introduction
This article explains how to capture Server side and Client side logs on Remote Expert Mobile, RE Mobile.
It applies to RE Mobile deployments with CUCM, UCCX and UCCE.
Versions: 10.6(x), 11.5(1), 11.6(1)
Server side logs
SSH on to the box
Login using the rem-ssh user and then switch users to the root user via:
su - root (enter password)
Log Capture Scripts
To capture a failure scenario you can use the logcapture script. If you are running in a HA environment it maybe easier to stop REAS2 and REMB2 and switch to a single REM and single MB to reduce the amount log logs to collect, then do:
On REAS (as root): /opt/cisco/<version>/REAS/bin/logcapture.sh -c -p -v -z -f /root/reas-logs.tar
On MB (as root): /opt/cisco/<version>/CSDK/media_broker/logcapture.sh -c -p -v -z -f /root/mb-logs.tar
After starting the above log capture, repeat the failure scenario, stop the log captures with Ctrl-C command and then send the resulting tar files for analysis.
Note: To copy the files you need to move them to /home/rem-ssh and set permission so the rem-ssh user can copy them e.g
mv /root/reas.tar /home/rem-ssh/
chown rem-ssh:rem-ssh /home/rem-ssh/reas.tar (now the file can be copied off server)
To copy logs off the server use an SFTP client using the 'rem-ssh' user account and password.
Manual Server Log Retrieval
If for what ever reason the scripts are not appropriate, for example you want to look at some logs yourself or the issue is related to server start-up issues then below lists useful log locations:
/opt/cisco/<version>/REAS/domain/log/
/opt/cisco/<version>/REAS/domain/servers/appserver<host>/log/
/opt/cisco/<version>/CSDK/media_broker/
/opt/cisco/<version>/CSDK/media_broker/rtp-proxy-instances/mb-*/
If the service has been restarted you may be requested to tar up the log directories as archives so we can check through historical data.
Here's an example of the commands you would need:
/opt/cisco/<version>/REAS/domain/#tar cvfz reas-domain-logs.tar.gz log/
/opt/cisco/<version>/REAS/domain/servers/appserver-<host>/#tar cvfz reas-server-logs.tar.gz log/
Which will produce:
/opt/cisco/<version>/REAS/domain/reas-domain-logs.tar.gz
/opt/cisco/<version>/REAS/domain/servers/appserver-<host>/reas-server-logs.tar.gz
Client side Logs
Browser Console logs
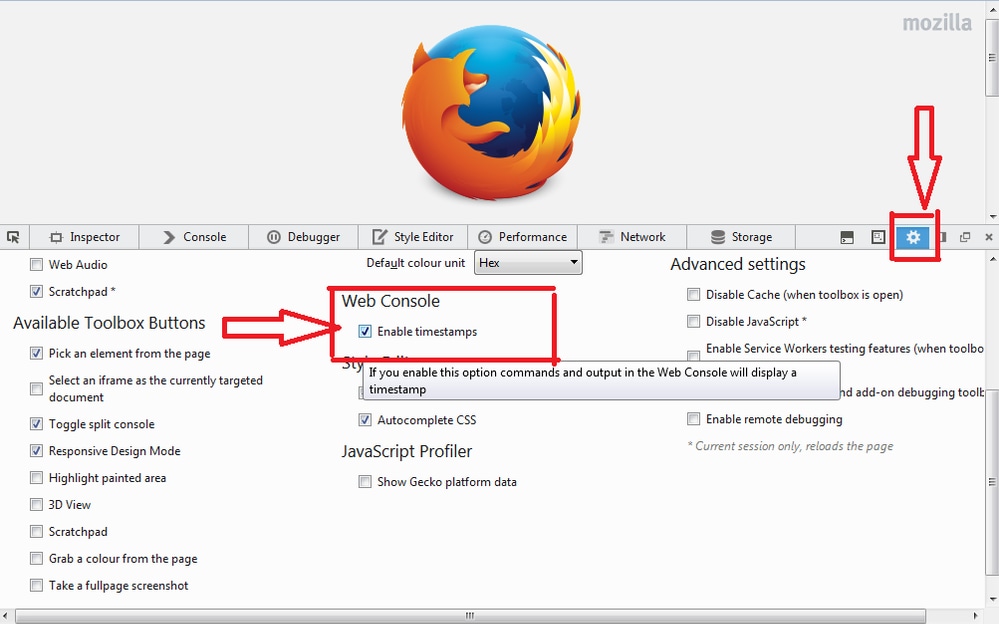
Before obtaining browsers logs (sometimes also referred to as console/client logs) from Chrome or Firefox, could you please follow the instructions below to ensure that timestamps are enabled on your browser, these can be very useful to us when attempting to resolve an issue.
Enabling timestamps:
Applies to both Chrome and Firefox: Press F12 on your browser and select the "cog" settings button as highlighted in the the screenshot below, you will then see the menu illustrated below, ensure that the highlighted boxes are ticked.


- Chrome: If using Chrome for a client then you can see the logs in the console, shown by bringing up the page context menu (normally by right clicking in the browser window) and selecting "Inspect Element", and then selecting the Console tab. These logs are normally detailed enough for us.
Note: Once the test is complete right click anywhere in the console window and select "save as" to save the logs to file.
On some occasions we need more detailed logs that are obtained by opening a new instance of chrome in debug mode as follows:
Windows: <Chrome Directory>\chrome.exe --enable-logging --v=9 --vmodule=*libjingle/source/*=9 --user-data-dir=c:\chromedebug
Mac: /Applications/Google\ Chrome.app/Contents/MacOS/Google\ Chrome --enable-logging --v=9 --vmodule=*libjingle/source/*=9 --user-data-dir=/User/<your user dir>/chromedebug
- Firefox: Firefox console logs are accessed in a similar way to Chrome above. Right click within the firefox window and either select "Inspect Element" or after the right click just press Q. Once the window has appeared there will be a "Console" tab, the logs found here are again normally detailed enough for us.
- Internet Explorer: IE works the same as Firefox above without the shortcut of Q. To access the logs from IE simply right click, then click "Inspect Element". This will then bring up a set of windows, just click the "Console" tab. These logs should contain enough information for us to diagnose.
How to obtain the Browser Console Logs
- Right click in your browser window, left click 'inspect' or 'inspect element'. This will bring up the developer tools
- Click on the console tab

- Recreate the issue you are seeing.
- To save: Each console varies from browser to browser but generally you can: Right click (inside the console tab window) > Save as (notepad text file). Or Right Click > Select All, Right click > Copy. Then you'll want to paste that into a text file.
- These text files tend to be small so you will be able to attach it directly to the ticket.
Collecting HAR network logs
The HTTP Archive format or HAR, is a JSON-formatted archive file format for logging of a web browser's interaction with a site.
How to generate a HAR on Chrome
- Open Google Chrome and go to the page where the issue is occurring.
- From the Chrome menu bar select View > Developer > Developer Tools .
- From the panel opens at the bottom of your screen, select the Network tab.
- Look for a round Record button (
 ) in the upper left corner of the Network tab, and make sure it is red. If it is grey, click it once to start recording.
- Check the box next to Preserve log .
- Click the Clear button (
 ) to clear out any existing logs from the Network tab.
- Recreate the issue you are seeing.
- Once you have reproduced the issue, right click anywhere on the grid of network requests, select Save as HAR with Content , and save the file to your computer.
How to generate a HAR on Microsoft Edge
- Browse to the URL where you are seeing the issue.
- Navigate to Developer tools (use F12 as a shortcut) and select the "Network" tab.
- Recreate the issue you are seeing.
- Click on "Export as HAR" followed by Save As... to save the HAR file.
iPad/Android device logs
- iPad: We support using Xcode, here are the instructions on how to find the logs:
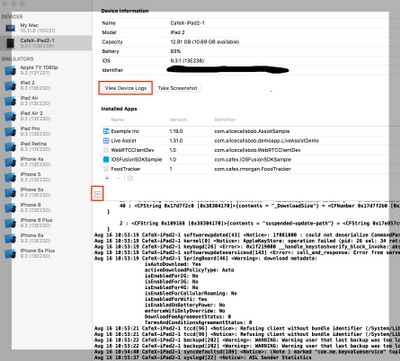
You can obtain iPad logs by plugging the iPad into a MAC, opening XCode and navigating to Window -> Devices and selecting your iPad in the left hand menu. You can view the device console by clicking the arrow in the bottom left corner of the right hand panel. To get a copy of the logs 'select all' in the console window and paste into a text file.
To get the Crash logs click the View Device Logs button and select the Crash item in the left hand pane from the time of the crash you are interested in, then right click and select export log.
- For for older Xcode 5 & 6 versions. You can obtain iPad logs by plugging the iPad into a MAC, opening XCode 5 and navigating to Window -> Organiser -> Devices and selecting your iPad in the left hand menu. In the drop down menu select console. For XCode 6 navigate to Window -> Devices and select your iPad in the left hand menu, when click the view device logs button.
- If you don't use XCode and your using iOS7 you can download the iPhone Configuration Utility for windows or Macs and connect your iPad to it to collect the console logs. For iOS8 you can download and collect logs via http://lemonjar.com/iosconsole/ if using a MAC.
- dSYM file. If your custom iPad app has crashed please include the dSYM file as well as the crash log. The dSYM file can be found in xCode by Right Clicking on your archive -> Show in Finder -> Right click on file and click on Show package content
Getting REAS WG Configuration
Providing the configuration for the cluster is also normally needed along with logs. The easiest way to provide this is to navigate to
https://REAS_MASTER:8443/admin/gateway/1.0/configuration
You need to provide the CSDK web_plugin_framework credentials. Then cut and paste the contents of the page into a text file and attach it to the ticket.
Note: Please don't use MS notepad as it corrupts the formatting of the page


 Feedback