Troubleshoot CVP Customer Virtual Assistant (CVA)
Available Languages
Download Options
Bias-Free Language
The documentation set for this product strives to use bias-free language. For the purposes of this documentation set, bias-free is defined as language that does not imply discrimination based on age, disability, gender, racial identity, ethnic identity, sexual orientation, socioeconomic status, and intersectionality. Exceptions may be present in the documentation due to language that is hardcoded in the user interfaces of the product software, language used based on RFP documentation, or language that is used by a referenced third-party product. Learn more about how Cisco is using Inclusive Language.
Contents
Introduction
This document describes how to troubleshoot Customer Voice Portal (CVP) CVA feature.
Prerequisites
Requirements
Cisco recommends that you have knowledge of these topics:
- Cisco Unified Contact Center Enterprise (UCCE) Release 12.5
- Cisco Package Contact Center Enterprise (PCCE) Release 12.5
- CVP Release 12.5
- Cisco Virtualized Voice Browser (CVVB) 12.5
- Google Dialogflow
Components Used
The information in this document is based on these software versions:
- Cisco Package Contact Center Enterprise (PCCE) Release 12.5
- CVP Release 12.5
- Cisco Virtualized Voice Browser (Cisco VVB) 12.5
- Google Dialogflow
The information in this document was created from the devices in a specific lab environment. All of the devices used in this document started with a cleared (default) configuration. If your network is live, make sure that you understand the potential impact of any command.
Background
CVP 12.5 introduces the Customer Virtual Assistant (CVA) feature, in which you can use Google Text to Speech (TTS), Austomatic Speech recognition (ASR) and Natural Language Processing (NLP) services. This feature supports human-like interactions that enable you to resolve issues quickly and more efficiently within the Interactive Voice Response (IVR) with Natural Language Processing. This document focuses on troubleshoot, if you want to learn more about CVA configuration review this document Configure CVP Customer Virtual Assistant (CVA)
Troubleshoot
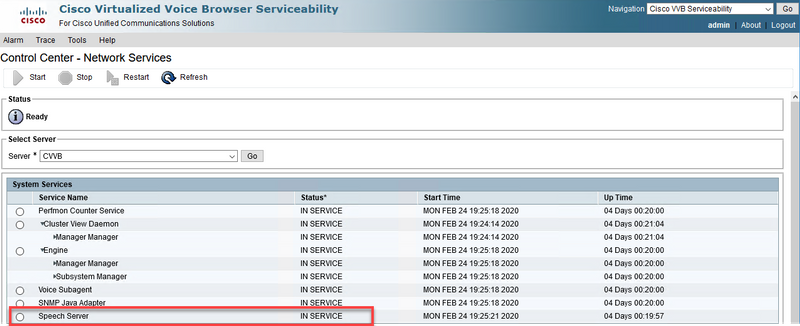
Most of the issues found in the CVA deployment can be identified via the Speech Server logs. First you need to ensure that the Speech Server is active.
Step 1. On the CVVB, navigate to Cisco VVB Serviceability.
Step 2. On the serviceability page, navigate to Tools > Network Services. Ensure that the Speech Server is IN SERVICE state.
Second, before you enable traces and collect logs, you can test and troubleshoot the Dialogflow response to intents from the Dialogflow virtual agent.
For example, try the response to the default welcome message.
On the Dialogflow virtual agent on the right-hand side, type hello and then Enter. You can see the response to the welcome message.

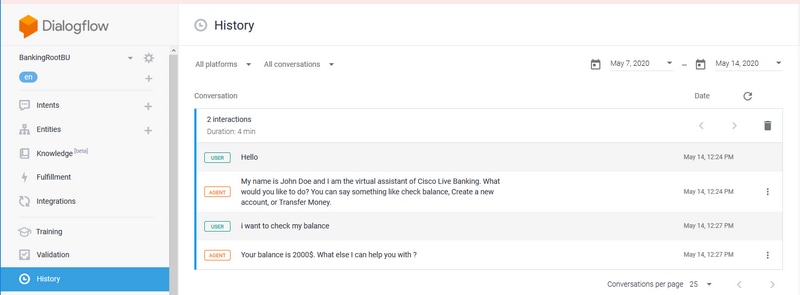
You can also check the history of the agent conversation.
Step 1. Select History from the Dialogflow virtual agent.
Step 2. In the history page, select the last conversation. You see all the interaction between the virtual agent and caller, as shown in the image.
Log Trace Levels and Collection
Cisco VVB Speech Server
To enable the the Speech Server logs, follow these steps:
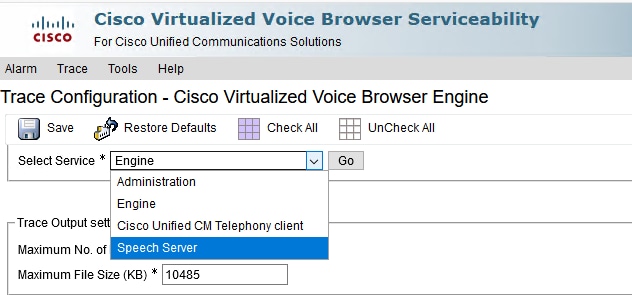
Step 1. On the Cisco VVB Serviceability page, navigate to: Trace > Configuration .
Step 2. Select Speech Server.
Step 3. Now, you see the default level of traces set.
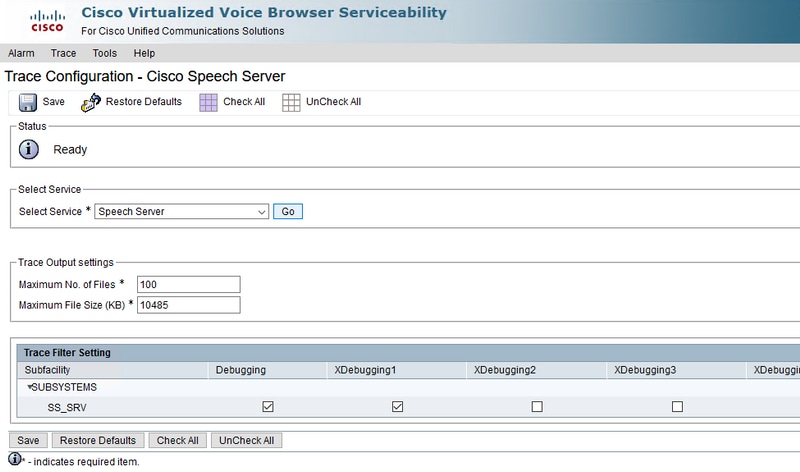
Caution: The Speech Server trace level requires to be increased in order to see the message exchange between the Cisco VVB Speech Server and Google Dialogflow. However, when you Increase the Speech Server trace level, the system may experience performance degradation. Ensure to do this during non-production time or in a lab environment.
Step 4 Increase the Speech Server trace level to XDebuggin3 in order to see the message flow between the Cisco VVB Speech Server and Google Dialogflow.

Speech server logs are not available via the Real Time Monitor Tool (RTMT), so you must download the logs via the Cisco VVB Comman Line Interface (CLI).
file get activelog speechserver/logs/SpeechServer

file view activelog speechserver/logs/SpeechServer/*.log
Google Dialogflow
These are two main logs that can be used to troubleshoot Cisco CVA integration with Google Dialogflow: Google Stackdriver and Activity logs.
Note: Enable Google logs has an additional fee to the API usage.
Google Stackdriver helps you to follow the requests from the caller to the virtual agent and the respective responses. Here are the steps to enable and collect the Google Stackdriver logs.
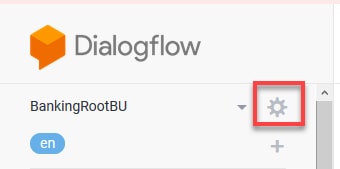
Step 1. On the Dialogflow virtual agent click on the settings icon.
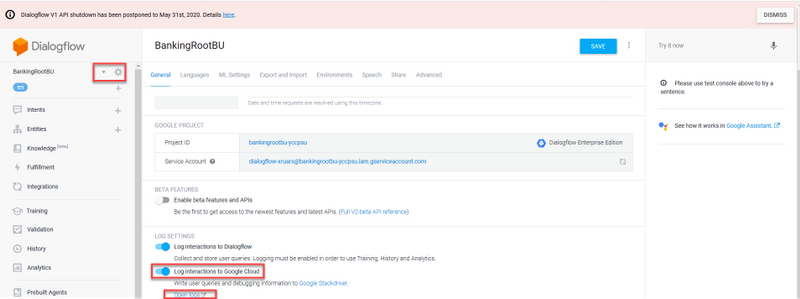
Step 2. On the setting window, slide the Log interactions to Google Cloud bar to the right so you enable the logs. You see the Google Stackdriver enabled and the option to open the logs.
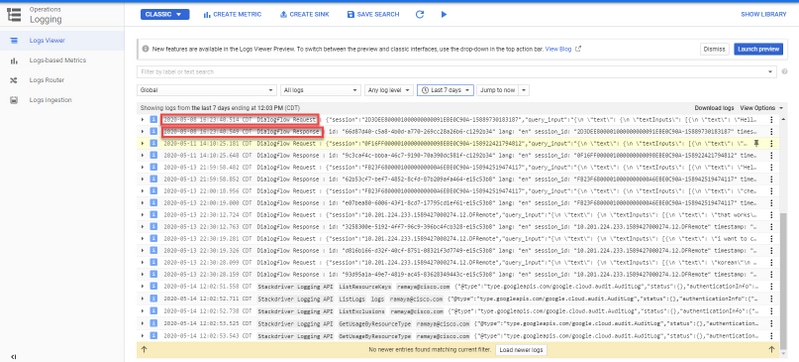
Step 3. Place some calls in order to recreate the issue and click on Open logs. You see the requests to the virtual agent and the responses.
Note: You can use the session id in the Strackdriver logs, which is the same as the CALLGUID in CVP logs and callid in Call studio aplication Activity logs, to track the call end-to-end from CVP to Dialogflow virtual agent.
Activity logs basically register all the activities that happens on the Google project. CVA feature is mostly related to Dialogflow activities. Therefore, to troubleshoot CVA issues you only need to enable the Dialogflow activities.
Here are the steps to enable and collect the Dialogflow Activity logs
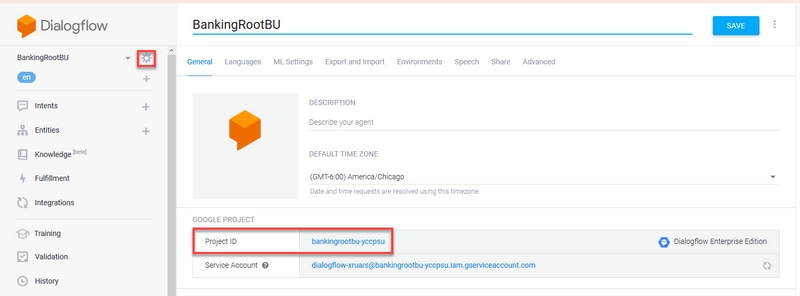
Step 1. On the Dialogflow virtual Agent settings window, click on the Project id, as shown in the image.
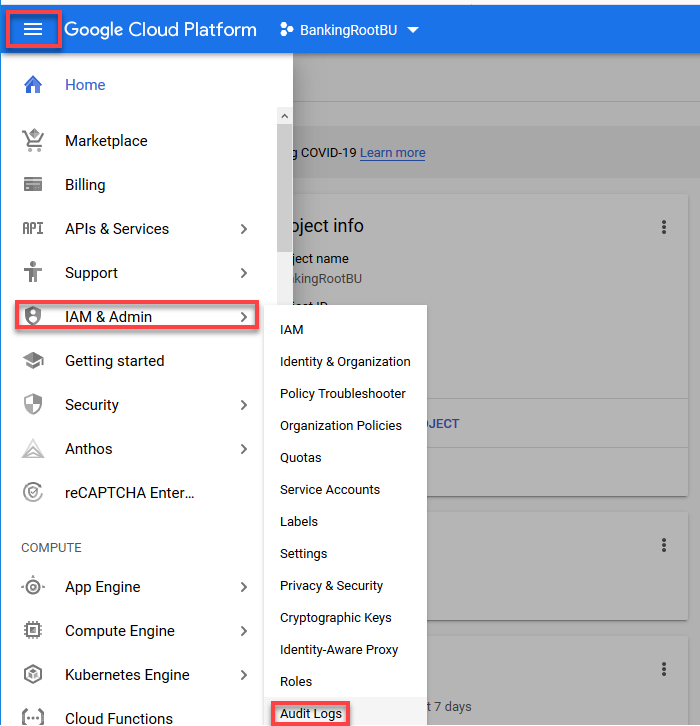
Step 2. On the Google Cloud Platform, click on the setting bars on the top left-hand side corner. Then, navigate to IAM & Admin > Audit Logs.
Step 3. On the Audit Logs window, type Dialogflow to filter all logs. Check the Dialogflow API box and all the permissions on the right-hand side as shown in the image.

Step 4. Click on the Google Cloud Platform and select the Activity tab.
Step 5. On the right-hand side on the Categories section, click on the Activity types. Uncheck all activities, check only Data Access and click OK.
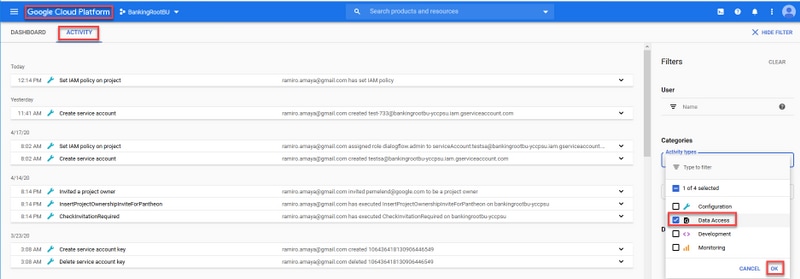
You see the activities related to Dialogflow now in the Activity window.

Most Common Issues
These are the most common issues found in the Cisco CVA and Google integration.
Unable to View Details in NOAMP When Cisco VVB Is Selected
This issue is mainly related to certificate exchange between the Cisco VVB and the CVP Operations Manager (OAMP) server via the New OAMP (NOAMP) configuration User interface (UI).

In the OAMP Logs ( C:\Cisco\CVP\Logs\OAMP\)

Unable to View CVA Feature in SPOG
In the PCCE Admin Worksation (AW) Single Pane of Glass (SPOG) you see this error

In the AW Tomcat logs (C"\icm\tomcat\logs\CCBU*), you see :

This issue is mainly related to the addition to the Cisco VVB into the SPOG and the certificate exchange beween the Cisco VVB and the AW.
Speech Sever is down while VVB/Engine is up
In this scenario, error message is played to the caller(error.wav).
If the Text to Speech (TTS) or audio prompts are cached, the initial prompt is played.
In the Speech Server logs you see:

In the Call Studio application Activity logs you see:

VXML Server Goes Down in the Middle of the Call
- Calls is dropped.
- You don't see any logs in the VXML application as the VXML Server is down.
- Speech Server logs display the last response from Google.
- Engine logs show connection refused error when Engine tries to communicate with VXML Server
In the Cisco VVB ( Engine/MIVR ) logs you see:

Cisco VVB not Able to Communicate with Google Dialogflow
In the Cisco VVB Speech Server logs you see:

In the Call Studo application Activity logs you see either No Reource or Error depending on the deployment. For DialogFlow element you see:

For DFIntent you see:

No Input Scenario
In the Call Studio application Activity logs you see:

In the Cisco VVB ( Engine/MIVR ) logs you see:

Incorrect Json Key
In the Cisco VVB Speech Server logs you see:

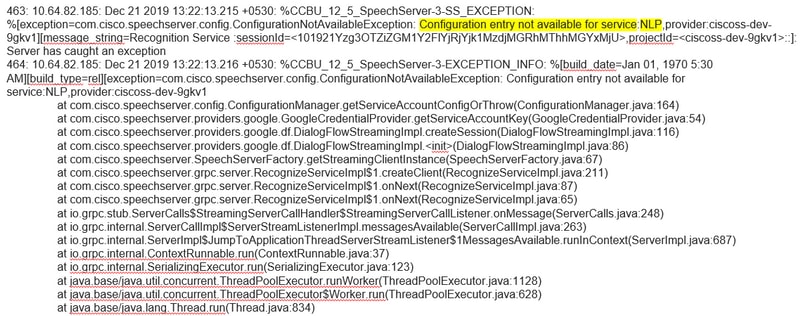
Issue in Service Account Configuration
In the Cisco VVB Speech Server logs you see:
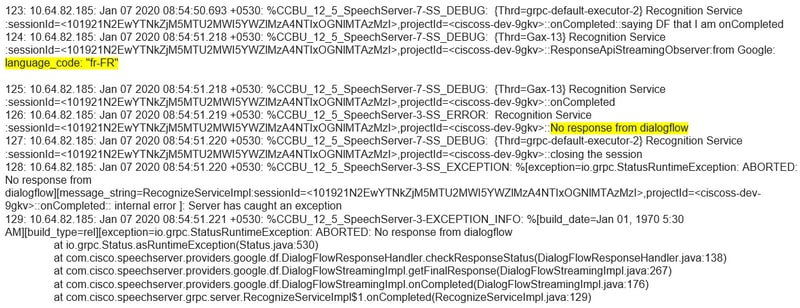
Wrong Language Set in CallStudio Application
In the Cisco VVB Speech Server logs you see:
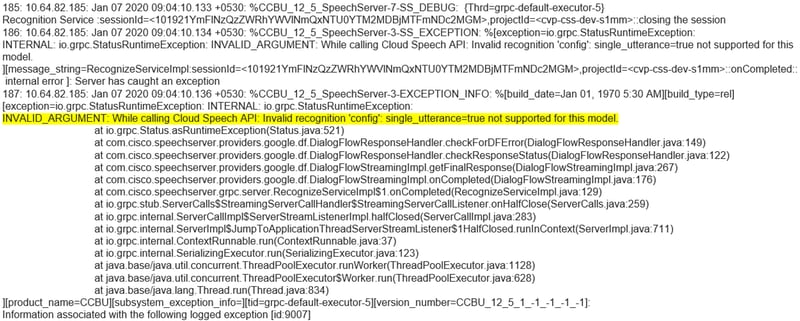
Single Utterance Issue with DF Project
In the Cisco VVB Speech Server logs you see:
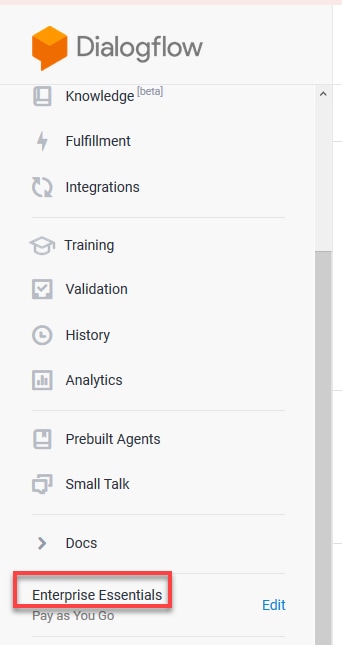
To solve the issue related to single utterance, you either have Enterprise Essentials plan, as shown in the picture or modify the call studio application properties and set single utterance to false.
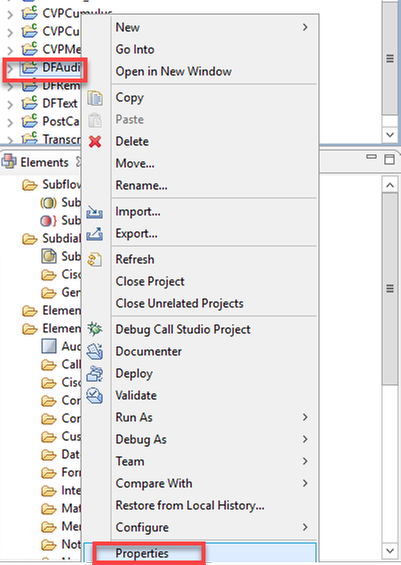
In order to change the single utterance settings in the Call Studio application follow these steps:
Step 1. On the Call Studio application, right-click and select properties.
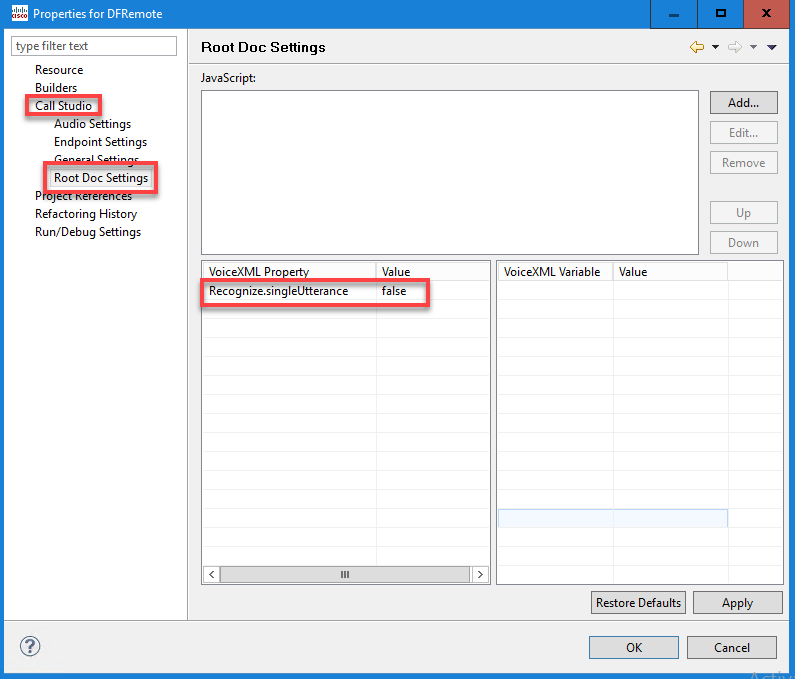
Step 2. On the properties window, navigate to Call Studio > Root Doc Settings and on the VoiceXML Property window add Recognize.singleUtterance and set it to false.
Step 3. Click Ok to save it and then validate and deploy the application to the VXML Server.
NTP Sync Issue
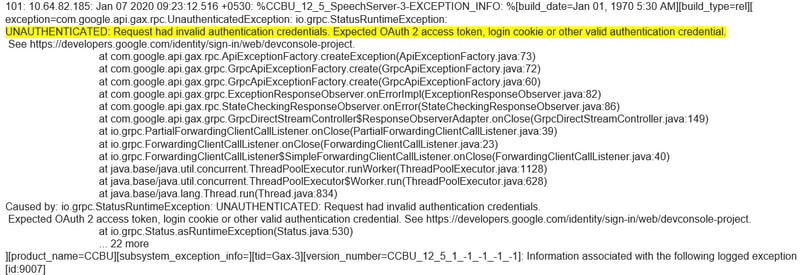
In the Cisco VVB Speech Server logs you see:
Related Information
Cisco Documentation
- Sample Code Sample CVA Applications
- CVA Design Callflows and Architecture.
- Configure CVA Services in UCCE using OAMP.
- Configure CVA Services in PCCE using PCCE Admin.
- Dialogflow Call Studio Element Specification
- DialogflowIntent Call Studio Element Specification
- DialogflowParam Call Studio Element Specification
- Transcribe Call Studio Element Specification
Google Documentation
- Enable Dialogflow API
- Enable Cloud Speech-to-Text API (Optional)
- Enable Cloud Text-to-Speech API (Optional)
- Enable Dialogflow Billing
- Upgrade to Enterprise Edition for advanced Dialogflow features.
- Enable Enhanced Models for best speech recognition results.
- Create Dialogflow Authentication Key
- Create Speech-to-Text Key
- Create Text-to-Speech Key
- Dialogflow Basics
- Setting up Dialogflow Agent
- Creating a Dialogflow Agent
Technical Support & Documentation - Cisco Systems
Contributed by Cisco Engineers
- Ramiro AmayaCisco TAC Engineer
- Anuj BhatiaCisco TAC Engineer
- Adithya UdupaCisco Engineering
Contact Cisco
- Open a Support Case

- (Requires a Cisco Service Contract)
 Feedback