Introduction
This document describes the available WebRTC call data and statistics using built-in browser tools.
Prerequisites
Requirements
Cisco recommends that you have skills and knowledge of Webex Contact Center (WxCC) solution, Chrome, Edge, Firefox browsers and WebRTC project.
Components Used
This document is not restricted to specific software and hardware versions.
The information in this document was created from the devices in a specific lab environment. All of the devices used in this document started with a cleared (default) configuration. If your network is live, ensure that you understand the potential impact of any command.
Overview
Most web browsers that support WebRTC have built-in WebRTC tools that can be useful for troubleshooting WebRTC related issues.
Chrome
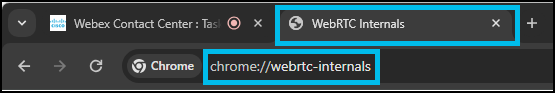
To access WebRTC call data and statistics a new tab in Google Chrome web browser should be opened while on active call and the following URL should be used:
chrome://webrtc-internals.
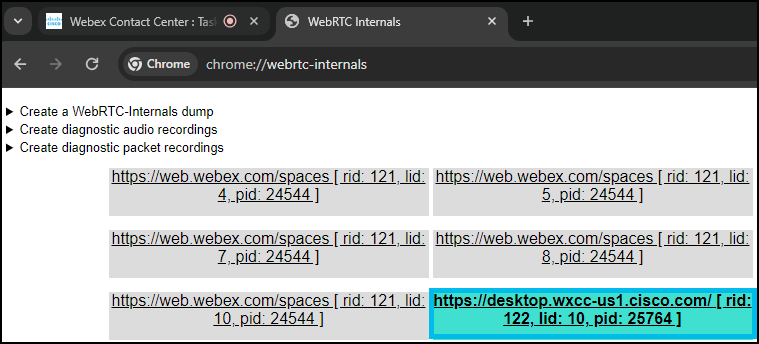
In the WebRTC-internals tab active WebRTC session should be selected (desktop.wxcc-us1.cisco.com in its name; URL will depend on the WxCC region).
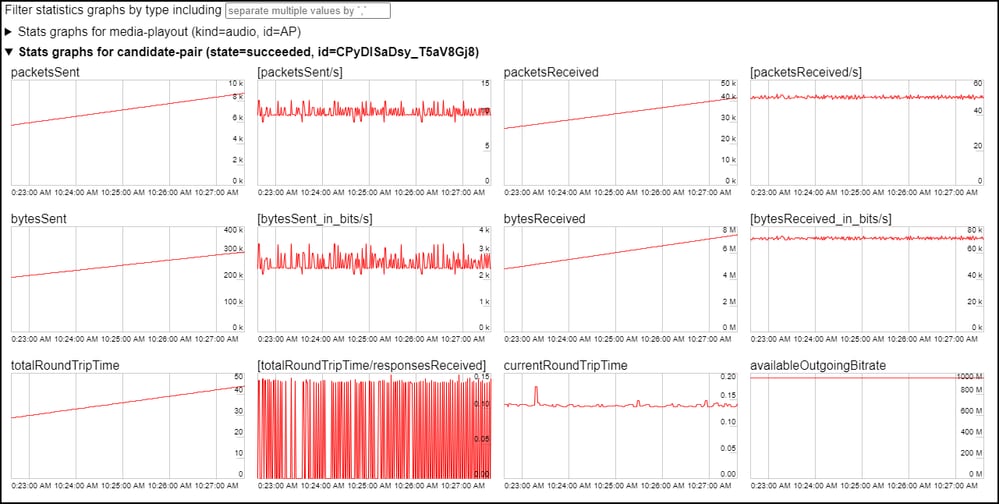
The following information can be seen:
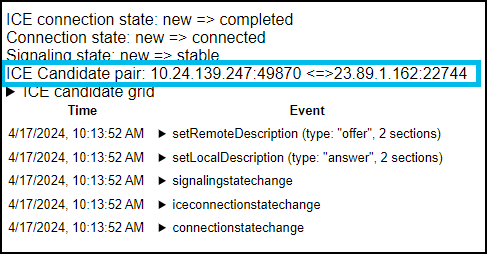
-On the left side (1), a record of the PeerConnection API activities is available. The RTCPeerConnection is the central interface in the WebRTC API. It represents the connection between the local and remote peer and provides all the functions and events necessary to establish the connection (more details can be found at https://webrtc.org/getting-started/overview). These traces (1) display interactions with the RTCPeerConnection object and parameters used.
-On the right side (2), the metrics collected via the getStats API about the current WebRTC connection are available.
-On the bottom (3), the graphs produced by utilizing the getStats API (2) about the current WebRTC connection are available.
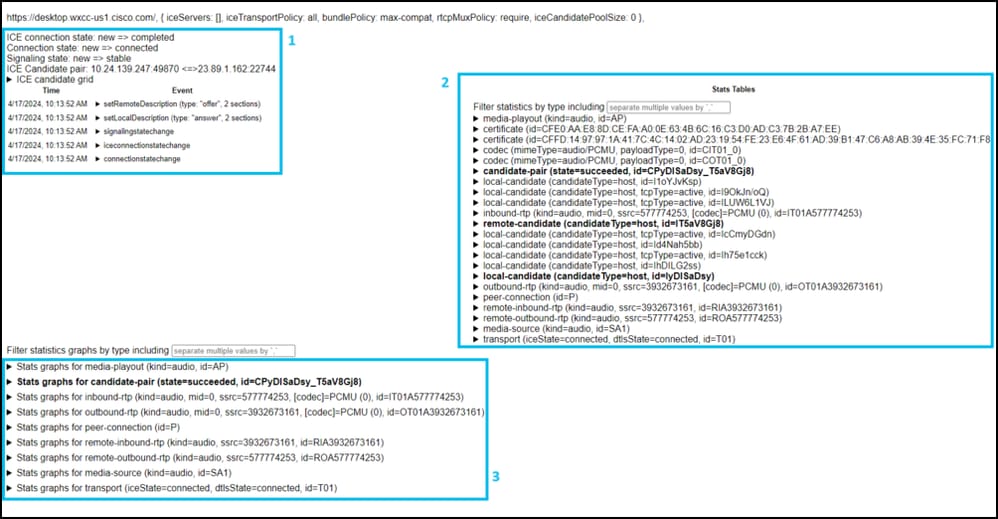
Local and remote IPs and ports in use for this particular WebRTC connection can be seen under traces of the PeerConnection API calls.
Various live call statistics (that is. sent packets, received packets, latency, dropped packets and so on.) related graphs can be seen at the bottom (bolded text).
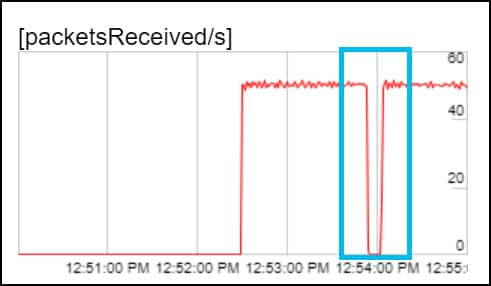
As an example - missing incoming packets would cause missing audio:
WebRTC log dump can be retrieved by clicking 'Create a WebRTC-Internals dump' and clicking 'Download the "webrtc-internals dump" option.
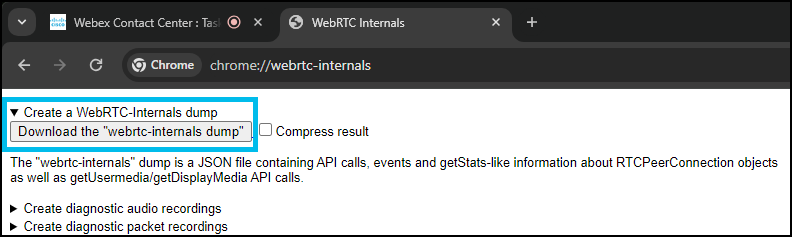
Note: WebRTC log dump file can be parsed and analyzed using specific tools, that is. https://fippo.github.io/webrtc-dump-importer/
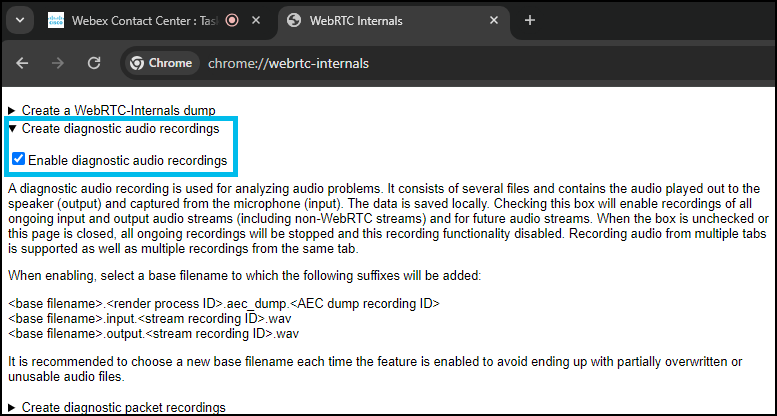
WebRTC audio can also be captured for diagnostic purposes.
 Feedback