UCCE Server/Client Tool Use to Troubleshoot the Network
Available Languages
Introduction
This document describes the Server/Client tool and provides clarification about the output generated and the usage parameters. The Server/Client tool is supplied with all Unified Contact Center Enterprise (UCCE) versions and is located in the c:\icm\bin folder. It can be useful in order to troubleshoot the network or to prove that the network has problems. Network issue identification is important in the UCCE environment, because the usual ping command does not provide a full picture of the network.
Setup
Here are the steps for quick setup:
- On Router B (PGB), open a command prompt window and input:
server ServerHighIPAddress 50001 /rptintvl 10000
- On the Router A (PGA), open a command prompt window and input:
client ServerHighIPAddress 50001 /localaddr ClientHighIPAddress

 /htbt 1 /msgintvl 100 /burst 30 /msgsize 1000

 /rptintvl 10000 /bucketsize 50
This generates approximately 2.4Mbps of high priority traffic bidirectionally. The tool prints a report after every 10,000 packets (rptintvl value in number of packets).
- Manually stop the tool with Ctrl-c after the test is complete. The .exe files are located in the C:\icm\bin, which should be in the path already.
Example Setup
C:\Program Files\Cisco\Desktop\bin>client /?
11:08:35 Trace: EMT Creating Mutex Global\IMTConnect_DisconnectLock
Version: Release 8.5.2.0 , Build 28588
Usage: client ServerIPAddress ServerPortNumber [/localaddr ClientIPAddress]
 [/htbt HeartBeatInterval] [/msgintvl MessageInterval]
 [/burst BurstCount] [/msgsize MessageSize]
 [/rptintvl ReportInterval] [/buckets BucketCount]
 [/bucketsize BucketSize] [/help] [/?]

C:\Program Files\Cisco\Desktop\bin>client 10.0.1.49 50001 /localaddr 10.0.1.48
/htbt 1 /msgintvl 100 /burst 30 /msgsize 1000 /rptintvl 10000 /bucketsize 50
11:08:46 Trace: EMT Creating Mutex Global\IMTConnect_DisconnectLock
Hearbeat interval = 100; Message interval = 100; Message size = 1000
11:08:46 Trace: EMT : Initialized with QoS-enabled service provider
11:08:46 Trace: EMT I/O completion ports: max threads=2, concurent threads=0
11:08:46 Trace: EMT App does not support eQOS
11:08:46 Trace: EMT 0: Server selected version: pre-QoS version
11:08:46 Trace: EMT 0: First heartbeat received.
11:08:46 Trace: EMT 0: Connected to TCP addr [10.0.1.49]/[50001] hb [10.0.1.49]/
[39501] with hb interval=100 [ms].
11:08:46 Trace: EMT 0: Connection established using pre-QoS version.
11:08:46 Trace: EMT 0: Total=109 [ms], Handshake=109 [ms], TCP connect=0 [ms].

11:09:21 After 10000: min rtt = 0ms, max rtt = 172ms, avg rtt = 2ms
 0- 49:9897 50- 99:50 100- 149:43 150- 199:10
 200- 249:0 250- 299:0 300- 349:0 350- 399:0
 400- 449:0 450- 499:0 500- 549:0 550- 599:0
 600- 649:0 650- 699:0 700- 749:0 750- 799:0
 800- 849:0 850- 899:0 900- 949:0 950- 999:0
 >= 1000:0

11:09:55 After 20000: min rtt = 0ms, max rtt = 93ms, avg rtt = 1ms
 0- 49:9969 50- 99:31 100- 149:0 150- 199:0
 200- 249:0 250- 299:0 300- 349:0 350- 399:0
 400- 449:0 450- 499:0 500- 549:0 550- 599:0
 600- 649:0 650- 699:0 700- 749:0 750- 799:0
 800- 849:0 850- 899:0 900- 949:0 950- 999:0
 >= 1000:0

11:10:28 After 30000: min rtt = 0ms, max rtt = 94ms, avg rtt = 1ms
 0- 49:9978 50- 99:22 100- 149:0 150- 199:0
 200- 249:0 250- 299:0 300- 349:0 350- 399:0
 400- 449:0 450- 499:0 500- 549:0 550- 599:0
 600- 649:0 650- 699:0 700- 749:0 750- 799:0
 800- 849:0 850- 899:0 900- 949:0 950- 999:0
 >= 1000:0
Usage Parameters
This section provides clarification about the usage parameters.
/bucketsize - The size of the bucket into which the report classifies packets with a certain range of Round Trip Time (RTT) delay. For example, this output shows a bucket size of 50ms:
11:10:28 After 30000: min rtt = 0ms, max rtt = 94ms, avg rtt = 1ms

0- 49:9978 -> 9978 packets with RTT between 0 and 49 - first bucket

50- 99:22 -> 22 packets with RTT between 50 and 99 - second bucket

100- 149:0 -> 0 packets with RTT between 100 and 149 - third bucket
/rptintvl - The report interval in number of packets. The report is printed whenever the number of packets specified here is reached.
/msgsize - The size of the message sent in bytes. This value together with the /msgintvl value determines the amount of bandwidth consumed with the test.
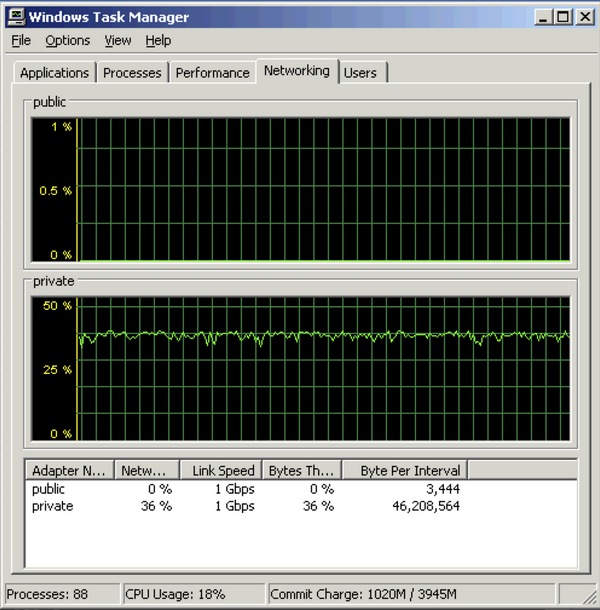
In order to check bandwidth consumption during the test, access the Task Manager > Network tab:

Revision History
| Revision | Publish Date | Comments |
|---|---|---|
1.0 |
27-May-2014 |
Initial Release |
Contact Cisco
- Open a Support Case

- (Requires a Cisco Service Contract)
 Feedback