Introduction
This document describes how to create a custom Data Collector Set in Windows Performance Monitor to collect process data for UCCE and PCCE solutions.
Prerequisites
Requirements
Cisco recommends that you have knowledge of these topics:
Components Used
The information in this document is based on these software and hardware versions:
- Unified Contact Center Enterprise (UCCE) versions 9.0.(x), 10.x, 11.x
- Packaged Contact Center Enterprise versions (PCCE) 9.0.(x), 10.x, 11.x
- Microsoft Windows Server 2008, 2012
The information in this document was created from the devices in a specific lab environment. All of the devices used in this document started with a cleared (default) configuration. If your network is live, ensure that you understand the potential impact of any command.
Background Information
Certain issues require an in-depth analysis of the Windows platform. These issues require that you collect a comprehensive Performance Monitor Data Set in order to properly troubleshoot them.
Create a new Data Collector Set
Step 1. Open Start and type Performance Monitor (or perfmon) in the search box and press Enter.
Step 2. Navigate to Data Collector Sets > User Defined.
Step 3. Right-click on User Defined and select New > Data Collector Set.
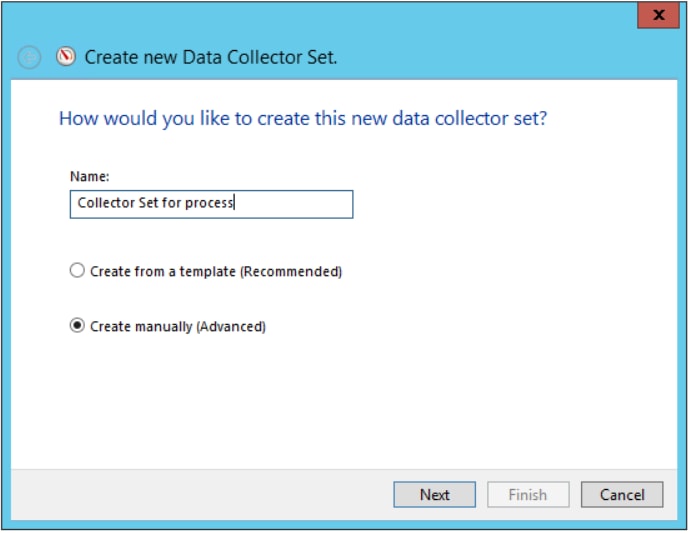
Step 4. In the new open window type the name of the Data Collector Set, select Create manually (Advanced) and then select Next.
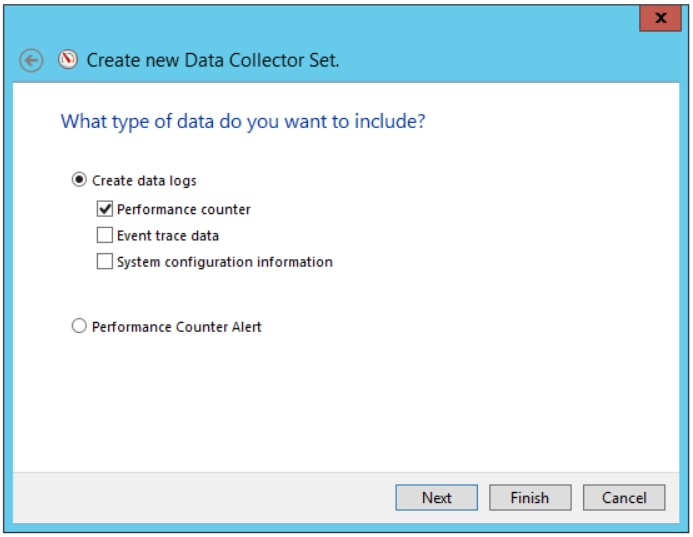
Step 5. In the next window select Create data logs, ensure that you activate the Performance counter box and select Next.
Step 6. In the next window select Add... .
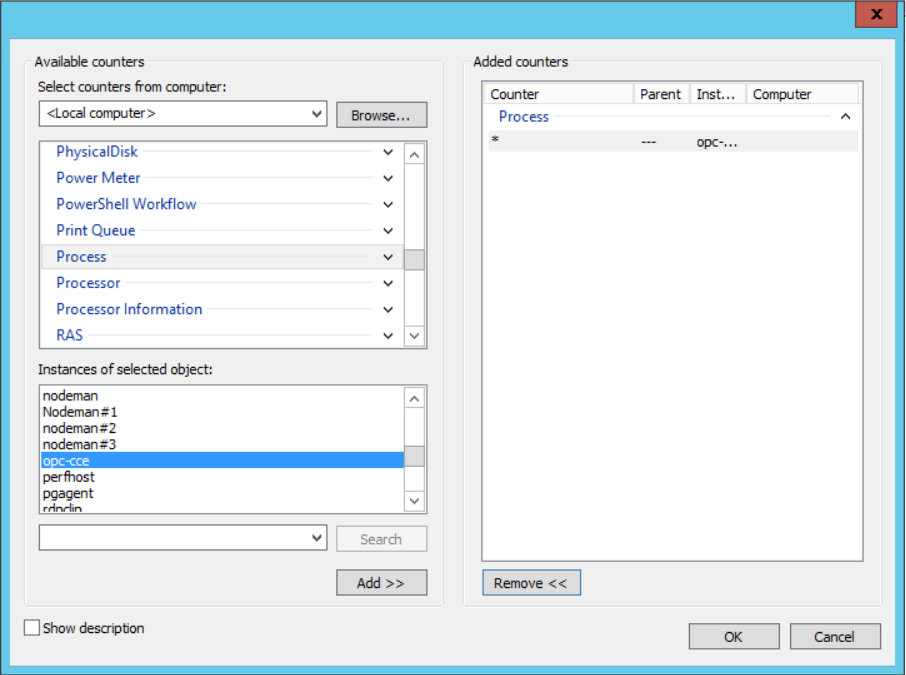
Step 7. A new window pops-up. In Select counters from computer, select Process. Then under Instances of selected object select the process that you want to monitor. Select Add>> to insert the counter on the list of Added counters
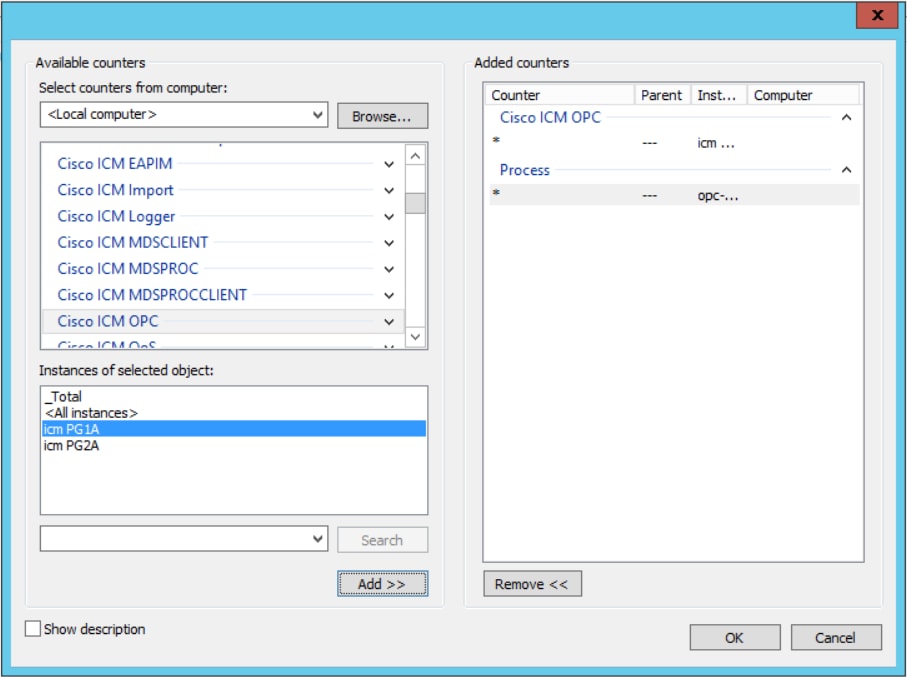
Step 8. In Select counters from computer, select the process Cisco ICM process_name, select the instance of the computer that you are connected from Instances of selected object and select Add >> .
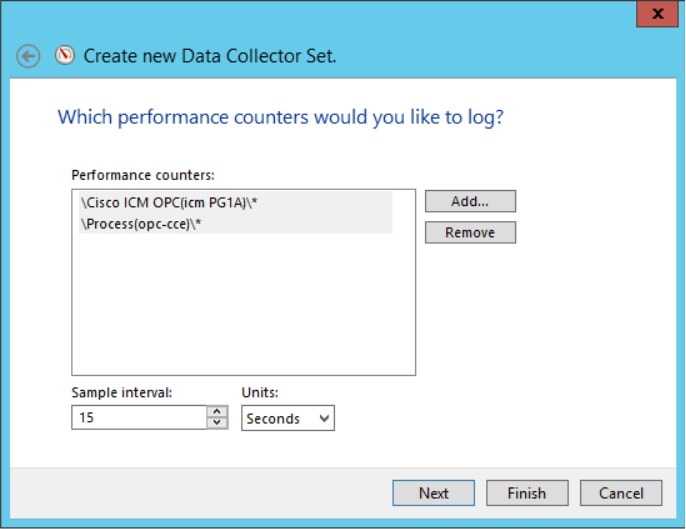
Step 9. After you finish with the required counters, select OK. The added counters are available in the Performance counters list. Enter the value of Sample interval, select the Unit and select Next.
Note: The recommended value for the Interval is 15 seconds. If you have performance issues you must stop the data collector set and change this value for a bigger interval.
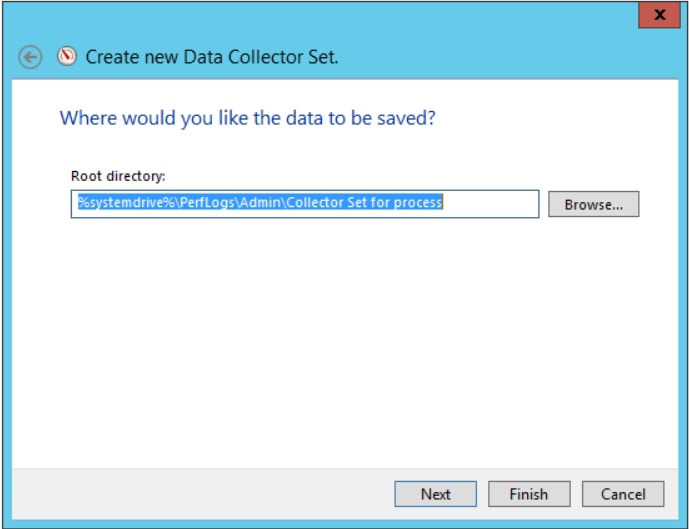
Step 10. Insert the Root directory where you want this data collector set to be saved and select Next.
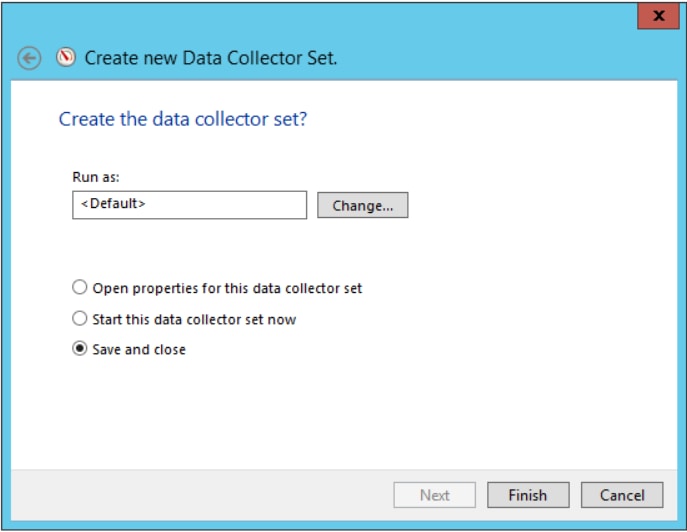
Step 11. Select Save and close and select Finish.
Step 12. The Data Collector Set is available from the User Defined menu. Select the data collector set and select Start the Data Collector Set.
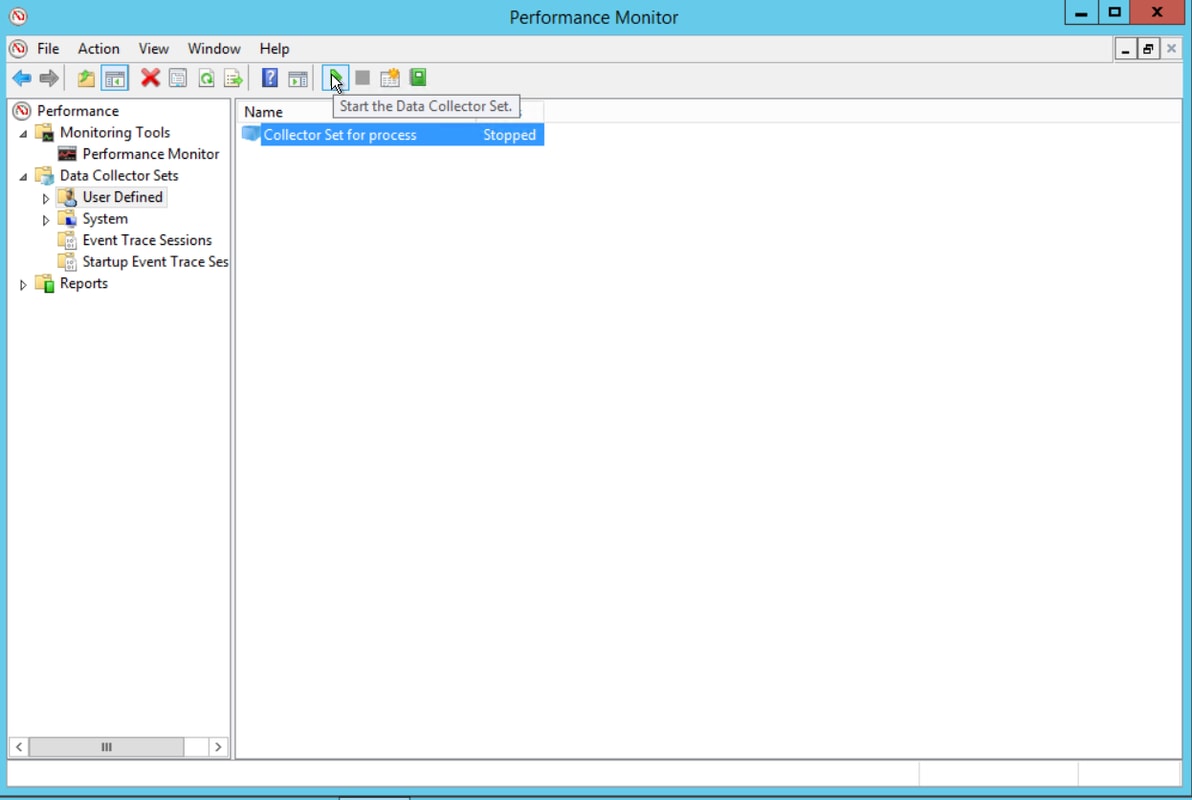
Step 13. Select Stop the Data Collector Set in order to stop it.
Step 14. The new data collector set is located in the directory that you specified on Step 10.
Verify
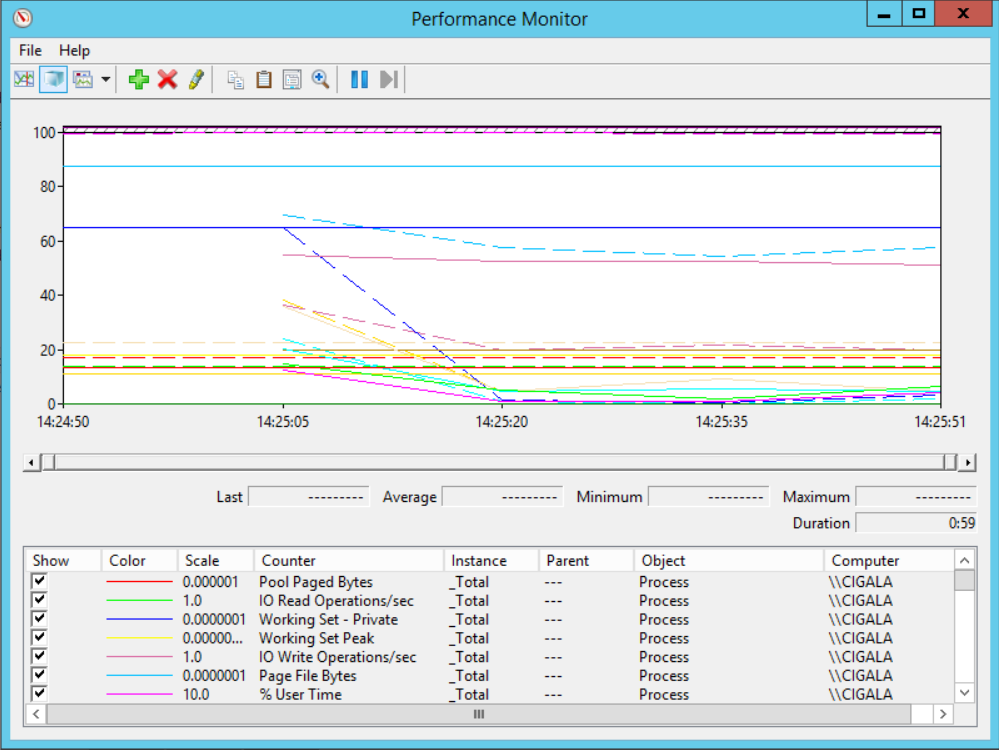
Navigate to the directory that the data collector set is saved and open it with Perfmon to verify that it includes all the needed data.
This is a screenshot of data collector set window displayed in Perfmon:
Troubleshoot
There is currently no specific troubleshooting information available for this configuration.
Related Information


 Feedback