Introduction
This document describes how to use Java Console (jconsole) tool to troubleshoot Cisco Unified Customer Voice Portal (CVP) memory leak issues.
Prerequisites
Requirements
Cisco recommends that you have knowledge of these topics:
- Cisco Unified Customer Voice Portal (CVP)
- Java Console utility
Components Used
The information in this document is based on CVP version 12.5.
The information in this document was created from the devices in a specific lab environment. All of the devices used in this document started with a cleared (default) configuration. If your network is live, ensure that you understand the potential impact of any command.
Jconsole Utility
To troubleshoot Call Server, VXML server memory leak or performance related issues often it is necessary to turn up java heap dump trace in jconsole utility. This is usually done after you have narrowed down a resource problem to a specific service or services in the server via Windows Event Viewer, Task Manager, and/or perfmon logs tools. The utilities dump heap is a low level trace file and is recommended to be turned up on top of CVP troubleshoot trace level.
Jconsole by default is located in the path C:\Cisco\CVP\jre\bin of the CVP Server. The port details are already configured by default in jmx_callserver.conf, jmx_vxml.conf, jmx_oamp.conf and jmx_wsm.conf configuration files located at C:\Cisco\CVP\conf for each respective CVP Server.
- Call Server JMX port 2098
- VXML Server JMX port 9696
- OAMP Server JMX port 10001
- WSM JMX port 2099
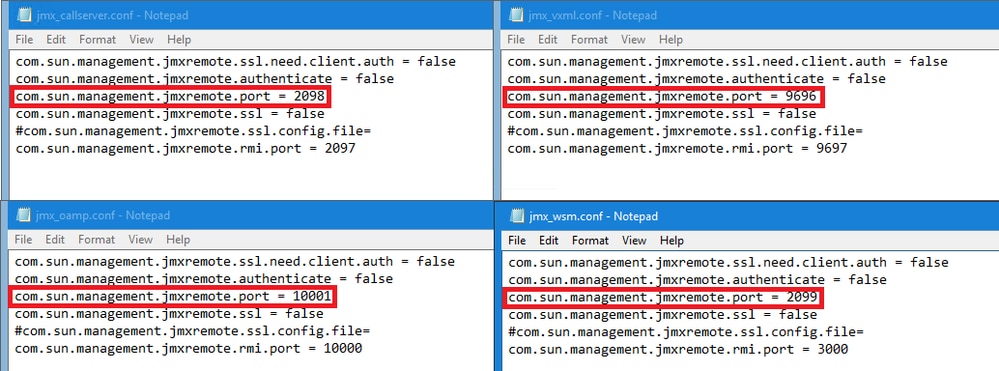
You can run the Jconsole utility as explained in these steps:
Step 1. Navigate to %CVP_HOME%/CVP/jre/bin/jconsole.exe and double click jconsole.exe.

Step 2. Connect to localhost, and specify the port number for the CVP component you want to connect to, for example for CVP VXML Server we use JMX port 9696. Leave the Username and Password filed blank. Click Connect.

Step 3. Click Insecure connection.
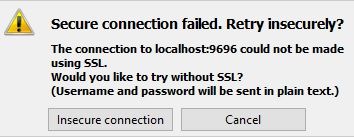
Step 4. Select MBeans tab.
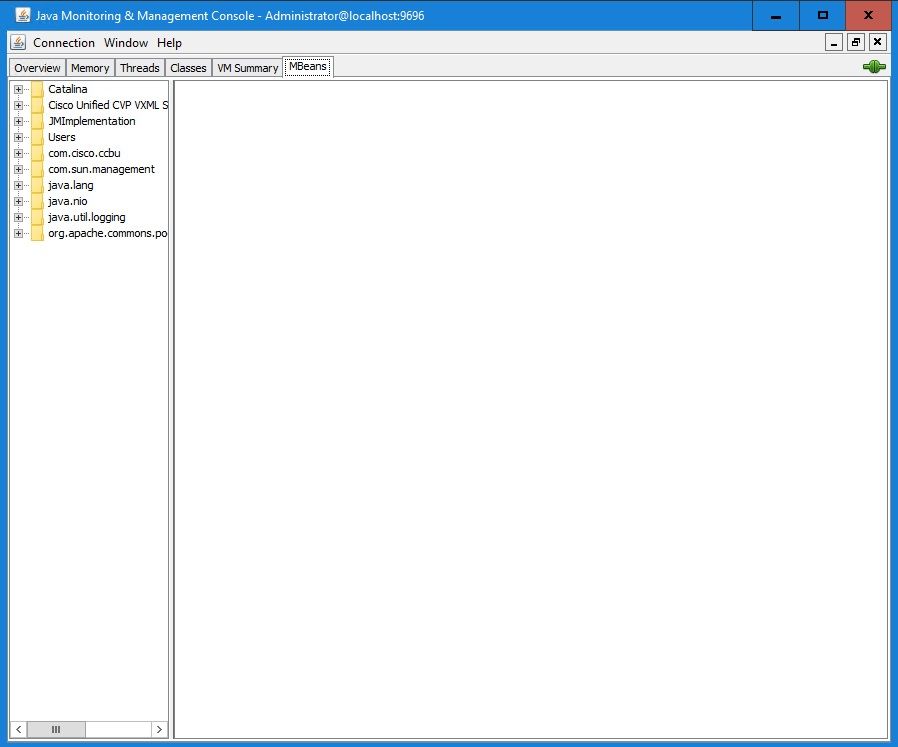
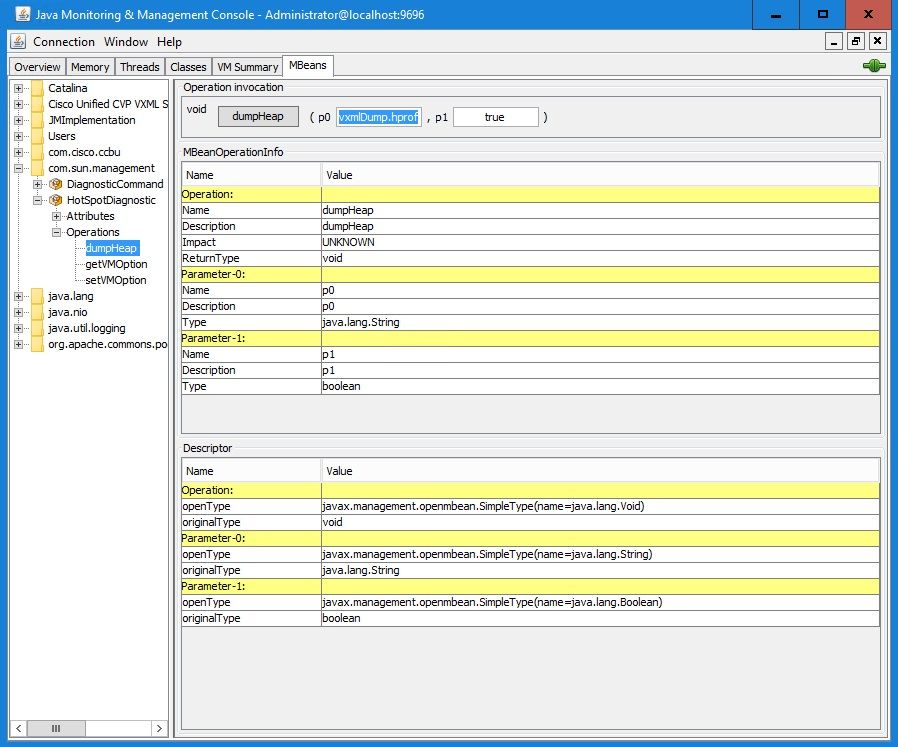
Step 5. Expand com.sun.management > HotSpotDiagnostic > Operations and click dumpHead.
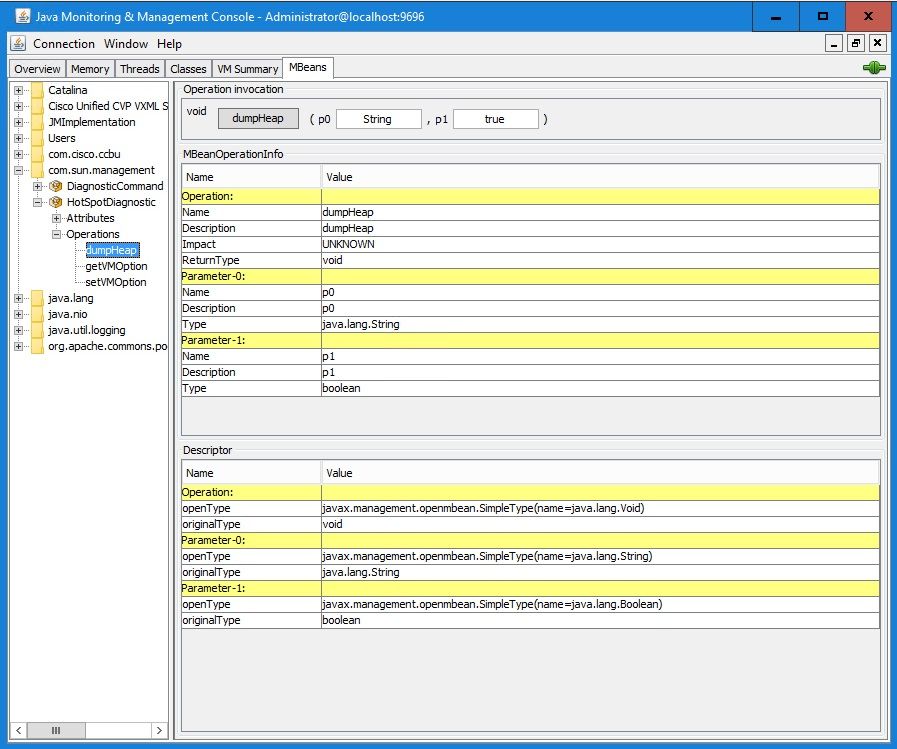
Step 6. In p0 enter the file name for the dump with .hprof extension, for example vxmlDump.hprof. Leave p1 as true.
Note: Cisco does not recommend dumping the heap during business hours as it can cause VXML Server service to freeze for a brief moment during the process. Cisco recommends to perform this activity during non-business hours.
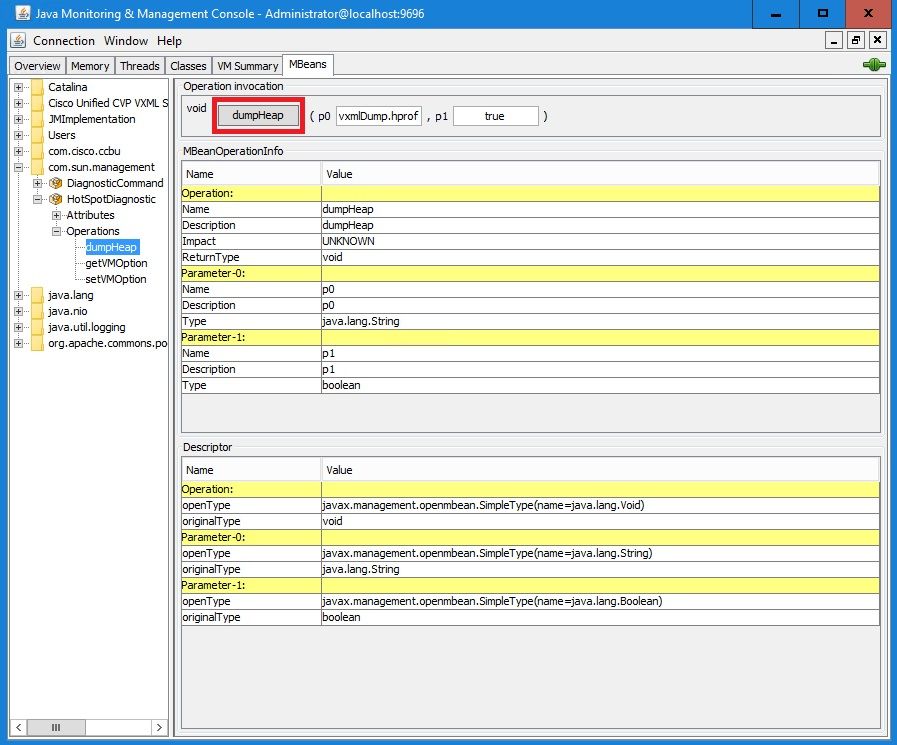
Step 7. Click dumpHeap.
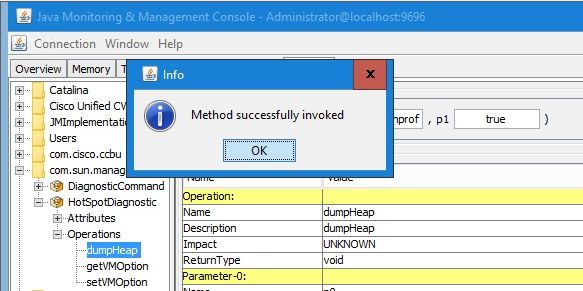
Step 8. You must see the message Method successfully invoked. Click OK.
Step 9. Collect the dump file generated. The default path for VXML Server dump is C:\Cisco\CVP\VXMLServer\Tomcat\bin.

Note: This tool is intended to troubleshoot VXML server memory leak issues. Once the application which causes the leak is identified, this tool must be enabled, desired information must be gathered and after the problem is recreated, it must be disabled. Jconsole is not designed as a monitor tool and must not be enabled indefinitely.


 Feedback