Introduction
This document describes the process in order to collect HTTP ARchive format (HAR) logs to narrow down and troubleshoot GUI related issues from the Client side. It also talks about why they are useful and how to collect the file from different browsers.
HTTP ARchive Format
Why HAR?
When you reach out or use Software as Service (SaaS) over the Internet, various issues can crop up when you access services. In order to narrow down and isolate the issue, you need to understand the client-side and the server/service side interaction. HAR logs give the interaction from the Client side. HAR logs are a unique set of captures that log and keep track of a browser's interaction with a site. This set of logs gives us a good understanding of what is happening at the client-side and this, in turn, speeds up the process of troubleshooting.
Let's look for HAR logs in a few typical scenarios
- Troubleshooting web page rendering issues (like a part of the web page not loading, formatting of the page is incorrect or part of the web page is missing)
- Troubleshooting performance issues (like a page taking a long time to load or timeout when an event is triggered)
What is in HAR and how is it useful?
HAR files store information in the JSON format; this makes it easier for us to view data with visual aids. HAR files contain timing information of several components. Based on Google's Understanding Resource Timing here are a few timers that are present in the log.
Stalled/Blocking: Time the request spent waiting before it could be sent. It can be waiting for any of the reasons described for Queueing. Additionally, this time is inclusive of any time spent in proxy negotiation.
Proxy Negotiation: Time spent negotiating with a proxy server connection.
DNS Lookup: Time spent performing the DNS lookup. Every new domain on a page requires a full roundtrip to do the DNS lookup.
Initial Connection /Connecting: Time it took to establish a connection, including TCP handshakes/retries and negotiating a SSL.
SSL: Time spent completing an SSL handshake.
Request Sent /Sending: Time spent issuing the network request. Typically a fraction of a millisecond.
Waiting (TTFB): Time spent waiting for the initial response, also known as the Time To First Byte. This time captures the latency of a round trip to the server in addition to the time spent waiting for the server to deliver the response.
Content Download /Downloading: Time spent receiving the response data.
Inference
This timing information from HAR logs can help narrow down which part of the network should you look at first.
- If you notice a delay on the network, you will know which aspect of the network should you target in order to troubleshoot.
- If this is a web page rendering issue, you can look at the Content Download/Downloading section in order to see the request and response that came back for each content and see if there any errors or issues present.
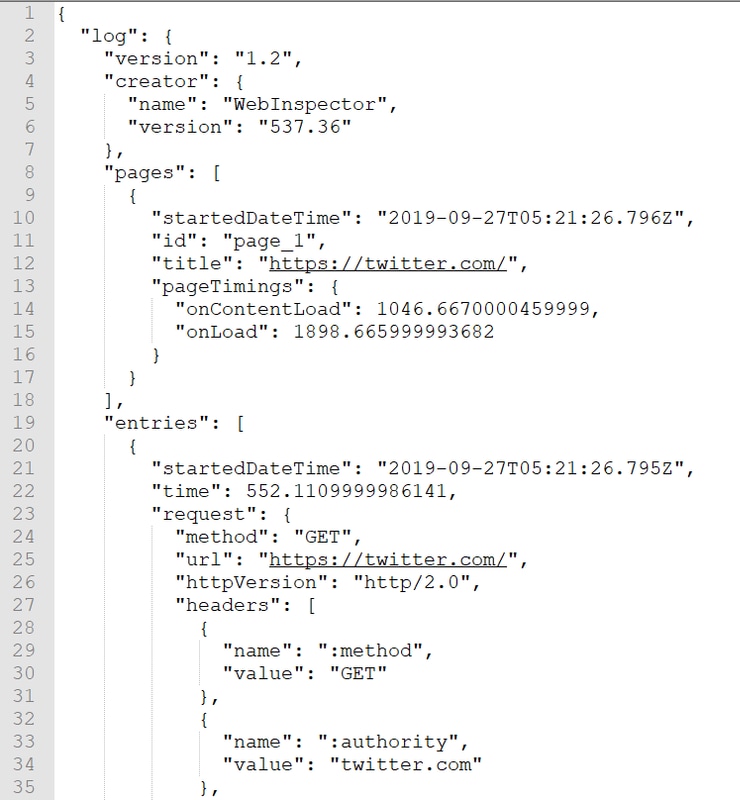
An HAR log file is openable in Notepad. Here is a small snippet of how it looks:
Here is a preview from a file loaded in the online tool softwareishard:
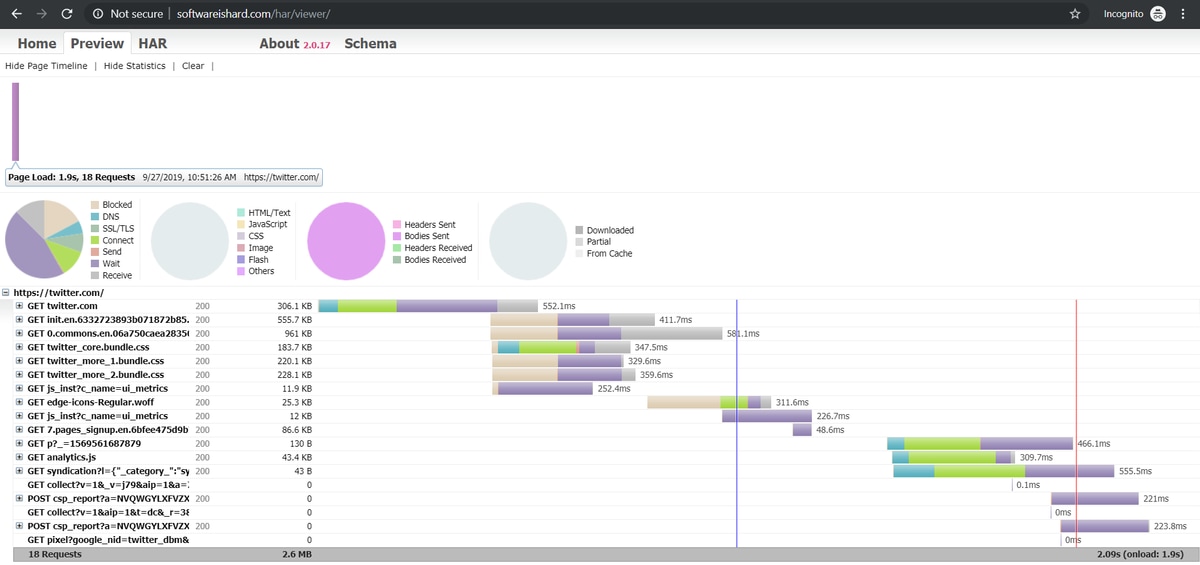
From this image, you can get a fair idea on where you spend a lot of time and which component takes the longest time.
Here is a preview from a file loaded on the online tool G-Suite:
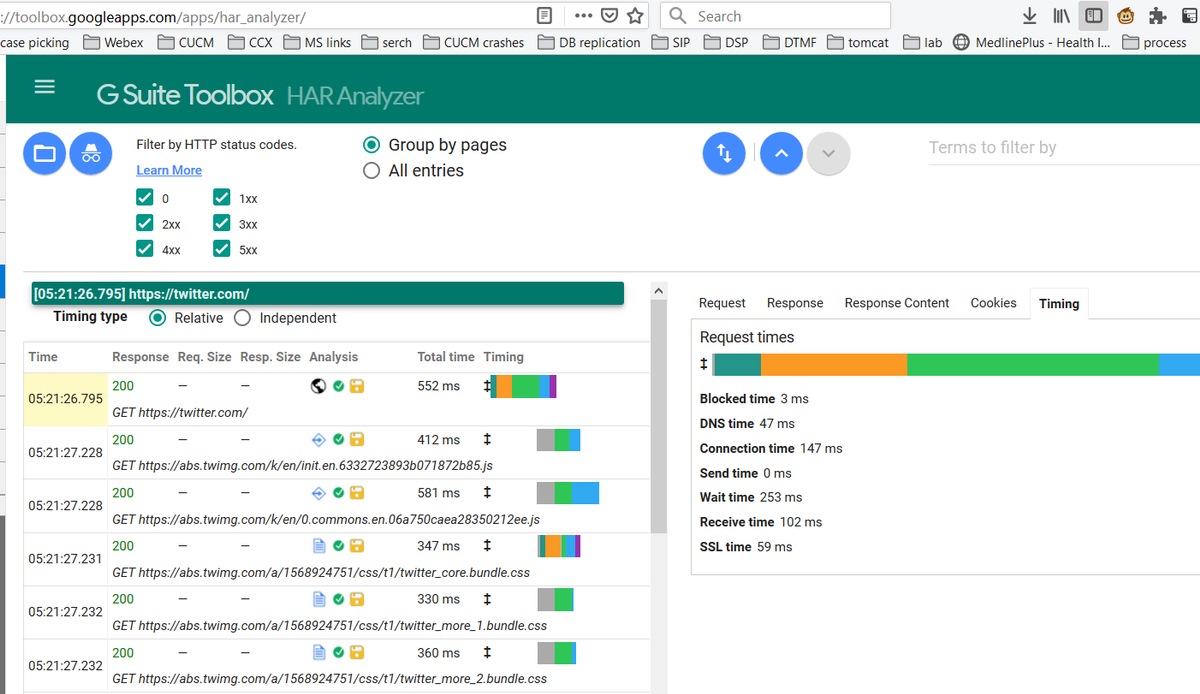
Here you can see the timer info on each of the requests.
Collect HAR Logs
It greatly helps in order to troubleshoot when you can collect a set of working and non-working HAR logs for comparison. For a non-working page, it is best if you can collect multiple HAR files so that you get an average time for all the components and can see if a similar component consistently has issues.
Before you collect a HAR, it is recommended you use a single private browsing session so that you force the browser to download all the information and not use any cached data already present.
The process for any browser is:
- Open developer option.
- Ensure that you are on-network options and ready to capture interactions.
- Recreate the issue with the web page.
- Save the capture.
- Send the saved file for further analysis.
Here is the process in order to collect HRA logs from these browsers:
Google Chrome
1. Hit F12 and the developer tab opens as shown in the image.
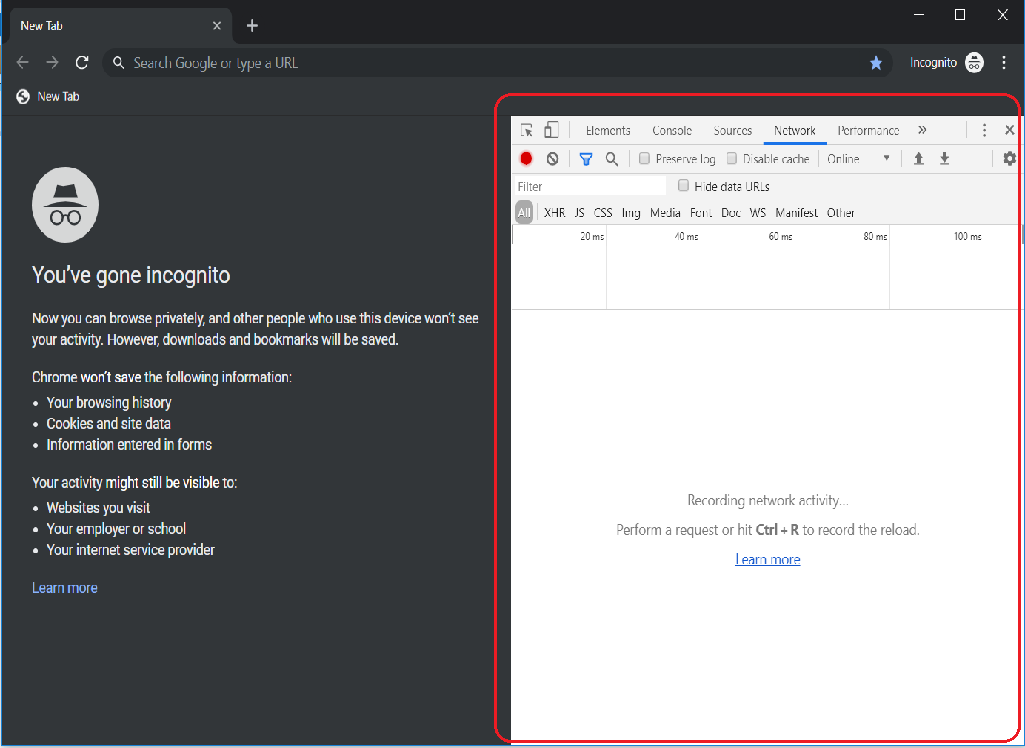
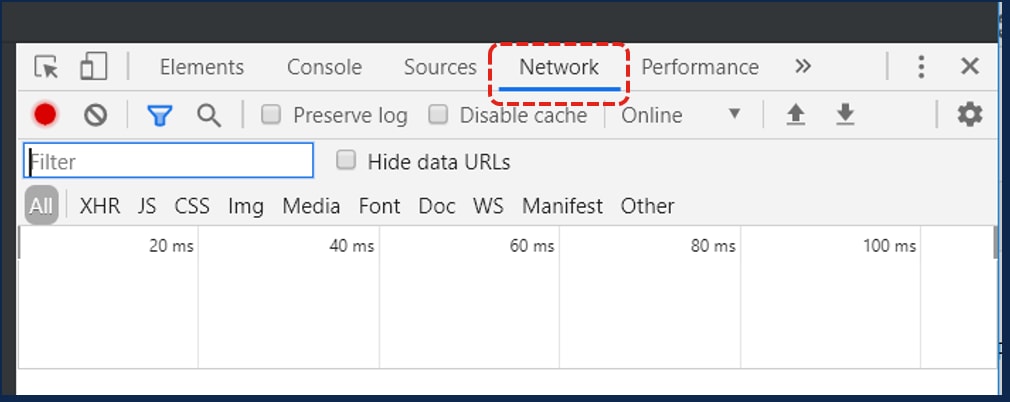
2. Click the Network tab as shown in the image.
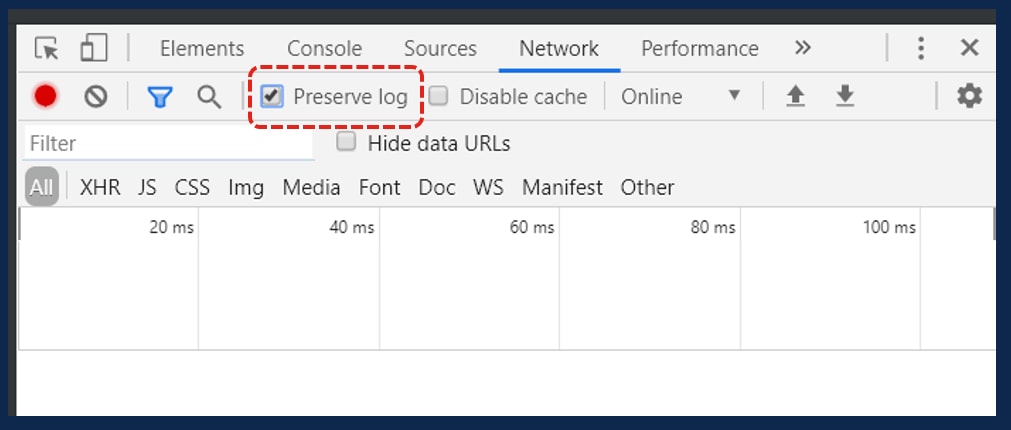
3. Select the Preserve log as shown in the image.
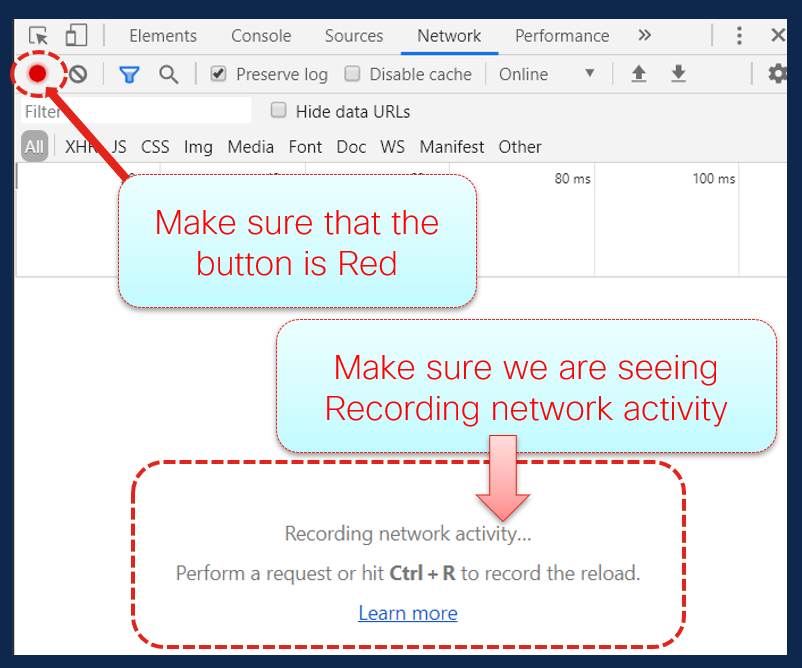
4. Notice the record button at the top left of the Network tab. If the color is red it means the capture has started. If the button is black, click the black circle to change color to red and start recording activity in your browser.
5. Recreate the issue while the capture is running as shown in the image.
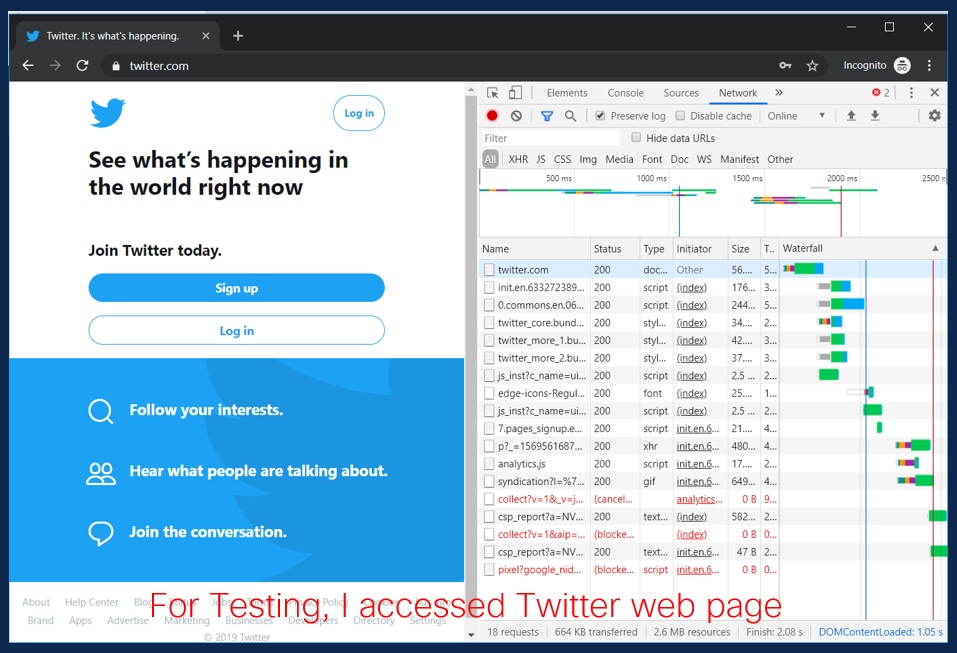
6. Once the issue is recreated, right-click on any row of the activity pane and select Save All as HAR with content as shown in the image.
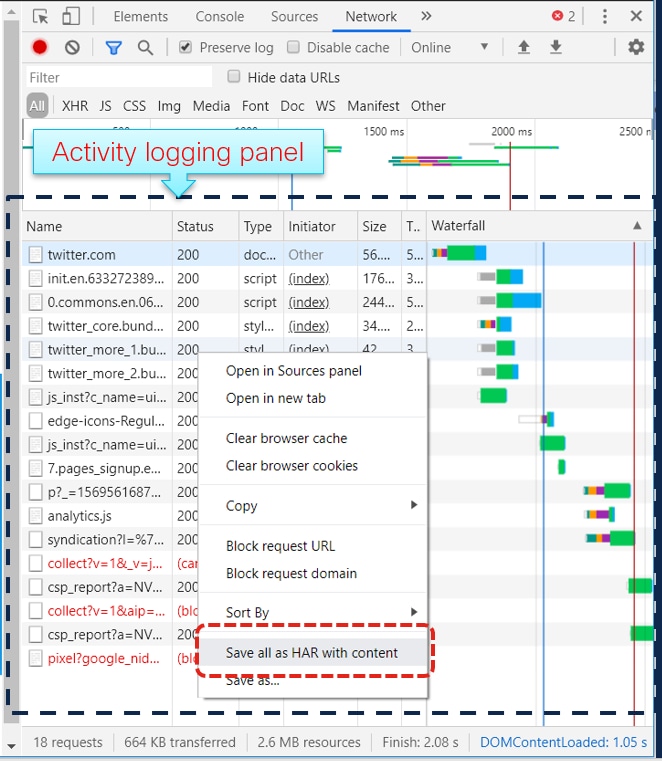
7. Save the file and send the file for analysis.
Firefox
1. Hit F12 and developer tab open. The Developer Tools window opens as a docked panel at the side or bottom of Firefox.
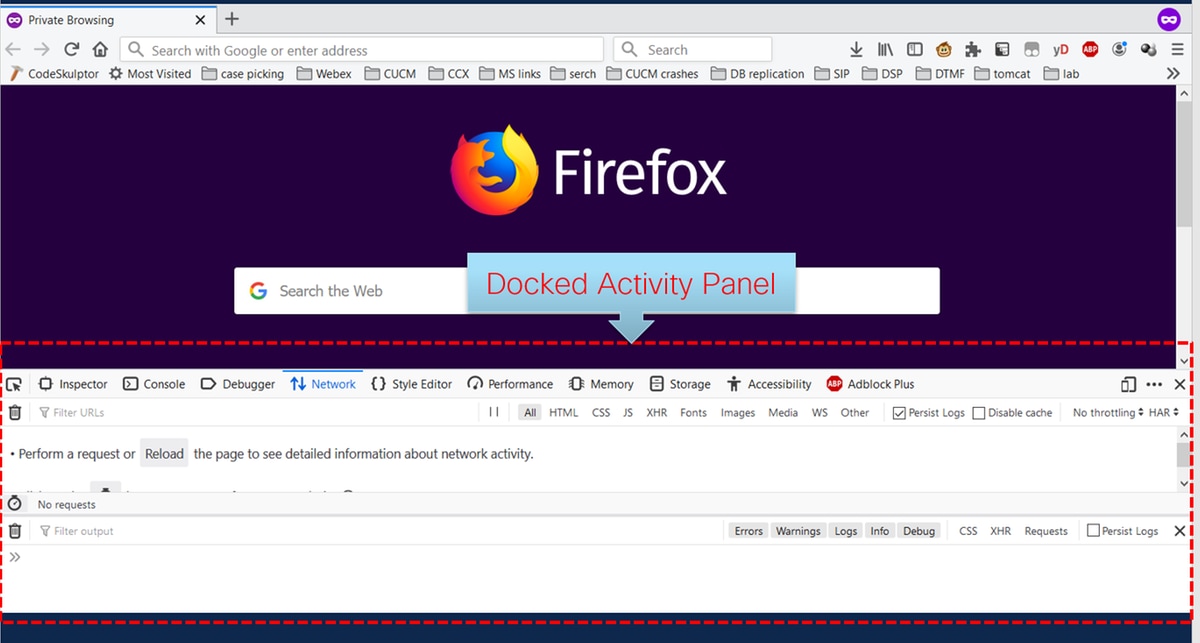
2. Click the Network tab as shown in the image.

3. Ensure Persist logs are checked.

4. Recreate the issue.
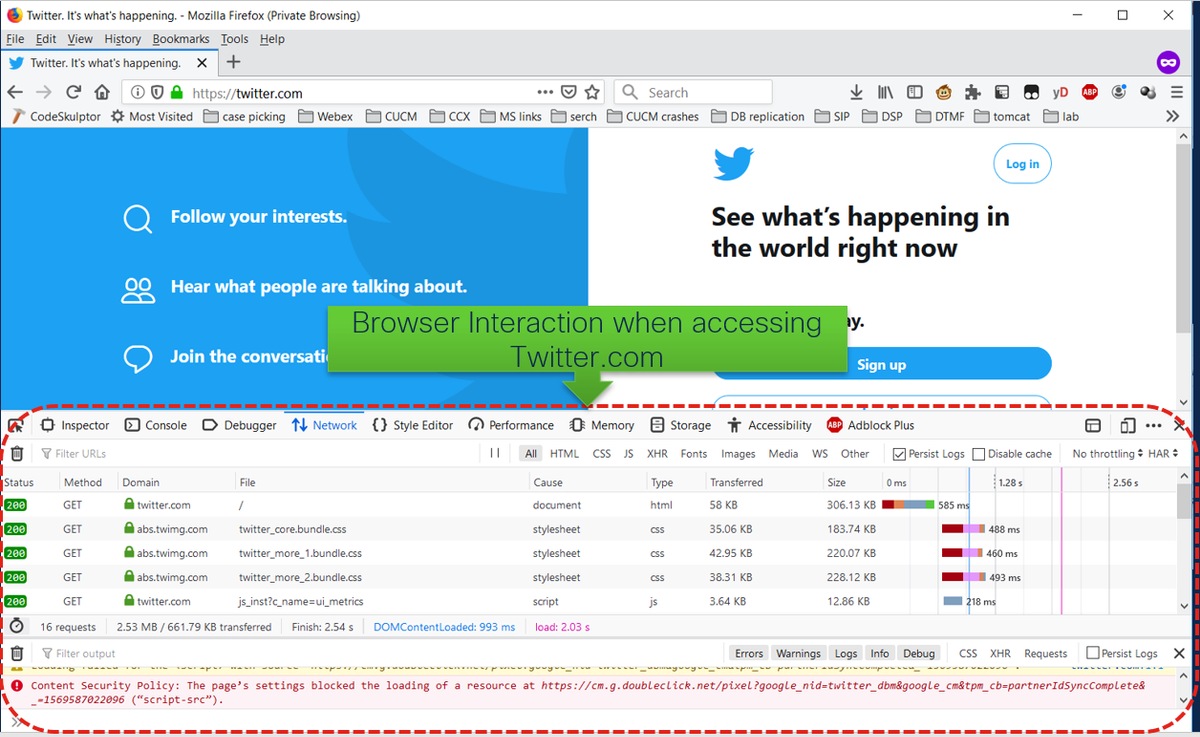
5. Once the issue has been recreated, right-click on the activity panel and select Save all as HAR as shown in the image.

6. Save the file and send it for analysis.
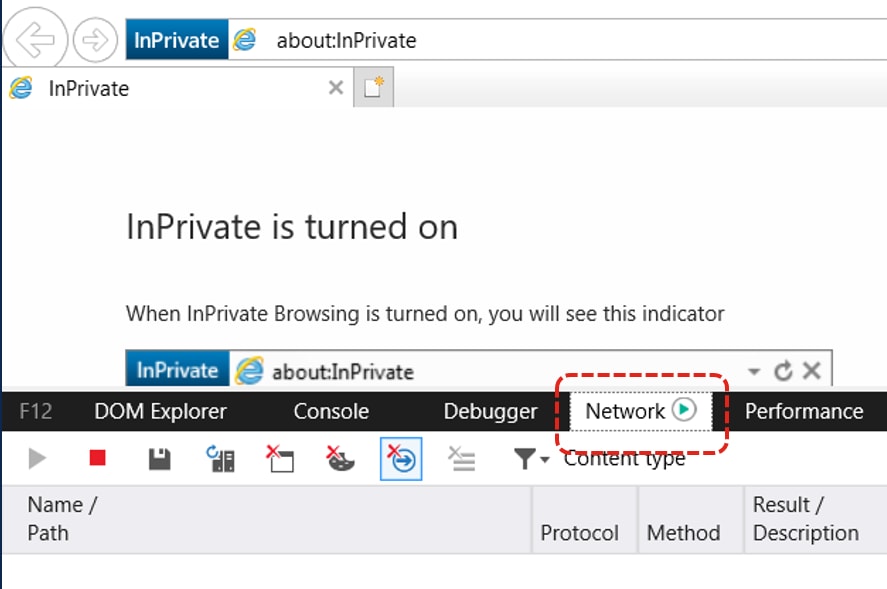
Internet Explorer
1. Hit F12.
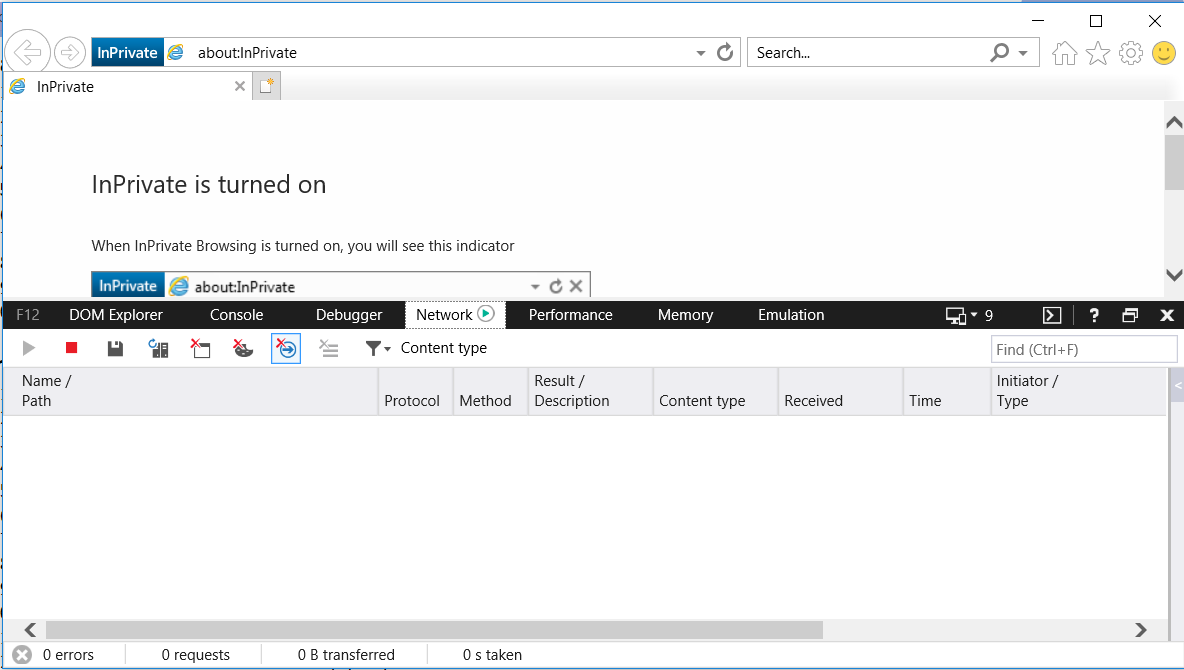
2. Ensure that you are on the network tab.
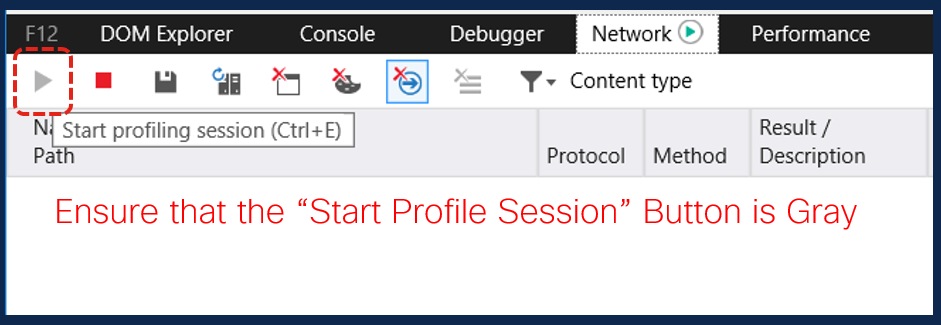
3. Ensure "Start Profile Session" is grayed out (this should the default state – it implies captures are running).
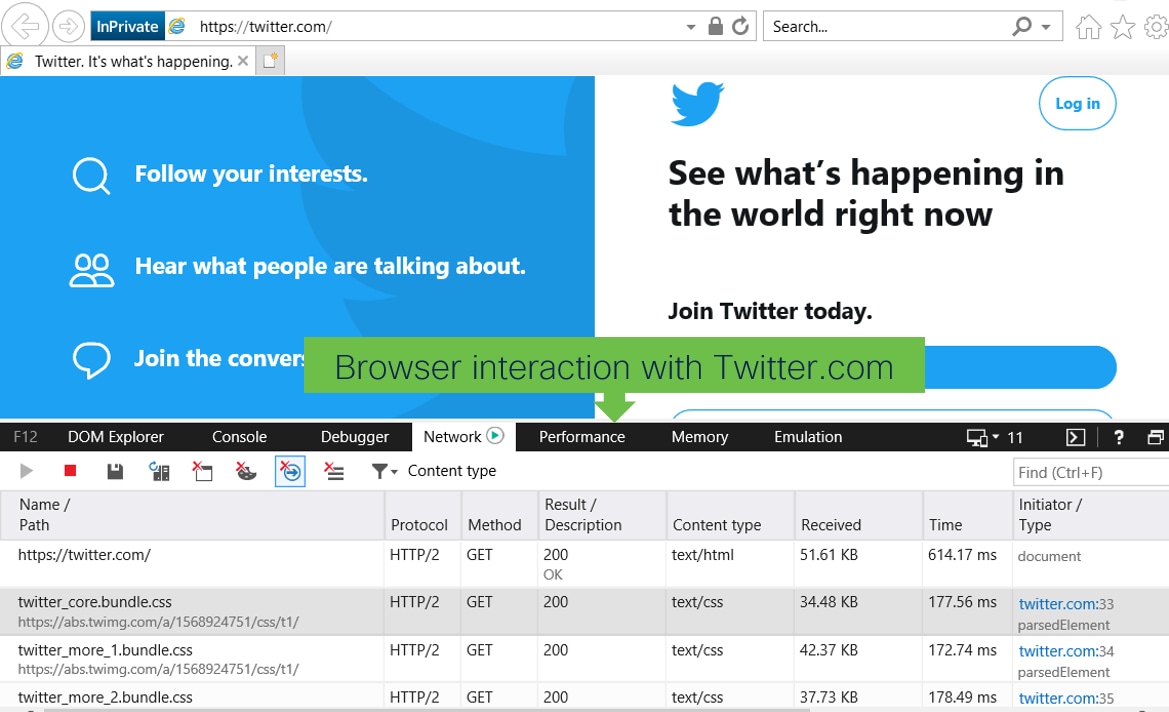
4. Recreate the issue.
5. Once the issue has been recreated, click the Save icon to save the logs.
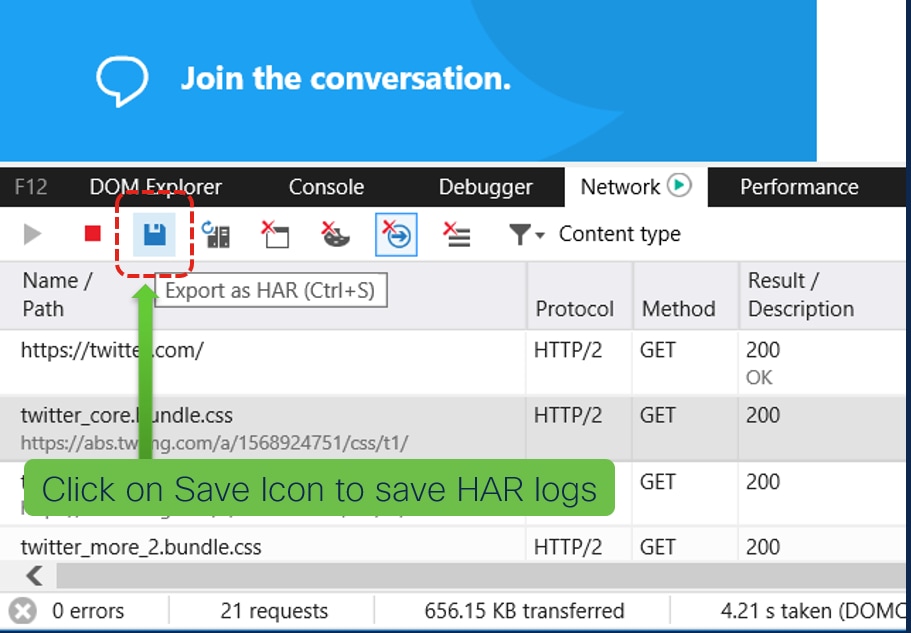
6. Save the file and send it for analysis.