Programmatic Approach To Optimize Remote Access VPN Setup through Data Analytics
Available Languages
Download Options
Bias-Free Language
The documentation set for this product strives to use bias-free language. For the purposes of this documentation set, bias-free is defined as language that does not imply discrimination based on age, disability, gender, racial identity, ethnic identity, sexual orientation, socioeconomic status, and intersectionality. Exceptions may be present in the documentation due to language that is hardcoded in the user interfaces of the product software, language used based on RFP documentation, or language that is used by a referenced third-party product. Learn more about how Cisco is using Inclusive Language.
Contents
Introduction
This document describes how to monitor and optimize the Remote Access VPN set up through some of the programming modules and open-source tools available today. A lot of data is generated today in even the smallest of networks that can be harnessed to obtain useful information. Applying analytics on this collected data helps make faster, more informed business decisions, backed up by facts.
Prerequisites
Requirements
Cisco recommends that you have knowledge of these topics:
- Remote Access VPN
- Basic Python Programming concepts
Components Used
This document is not restricted to specific Cisco ASA or FTD software and hardware versions.
Note: Pandas, Streamlit, CSV, and Matplotlib are a few Python libraries that are used.
The information in this document was created from the devices in a specific lab environment. All of the devices used in this document started with a cleared (default) configuration. If your network is live, ensure that you understand the potential impact of any command and python scripts.
Problem
With many companies adopting Work From Home model for a majority of their employees all over, the number of users relying on VPN to carry out their jobs has increased considerably. This has led to a sudden and considerable increase of load on the VPN concentrators leading the administrators to re-think and re-plan their VPN setups. Making informed decisions to reduce the load on the ASA concentrators requires collecting a wide array of information from the devices over a period of time and assessing that information, which is a complex task and would require a considerable amount of time if done manually.
Solution
With several Python modules and open-source tools available today for network programmability and data analytics, programming can prove to be very helpful in the collection & analysis of data, planning, and optimization of the VPN setup.
Initial Analysis Based on VPN Users and Concurrent Connections
To start the analysis obtain the number of users connecting, concurrent connections established, and their impact on bandwidth. The following Cisco ASA command outputs will provide these details:
- show vpn-sessiondb anyconnect
- show conn
Python module Netmiko can be used to ssh to the device, run the commands, and parse the outputs.
cisco_asa_device = {

        "host": host,

        "username": username,

        "password": password,

        "secret": secret,

        "device_type": "cisco_asa",

    }

    net_conn = ConnectHandler(**cisco_asa_device)

    command = "show vpn-sessiondb anyconnect"

    command_output = net_conn.send_command(command)
Collect the VPN user count and connections count at regular intervals (every 2 hours can be a good start) in a list and obtain the maximum daily count for a day.
#list1 is the list of user counts collected in a day
#list2 is the list of connection counts in a day
list1.sort()
max_vpn_user = list1[-1]

list2.sort()
max_conn = list2[-1]

df1.append([max_vpn_user,max_conn])
Pandas is an efficient data analysis and manipulation library and all the parsed data can be stored as a series or data frame in pandas making operations on the data easy.
import pandas as pd

df = pd.DataFrame(df1, columns=['Max Daily VPN Users Count','Max Daily Concurrent Connections'],index=<date range>)
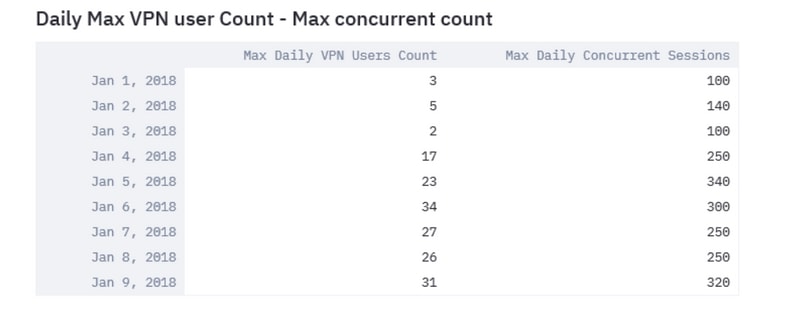
Analyze the daily maximum VPN users and maximum concurrent connections that can help determine the need to optimize the VPN settings.
Use the plot function in pandas and matplotlib library, as shown in the image here.
df.plot()

matplotlib.pyplot.show()
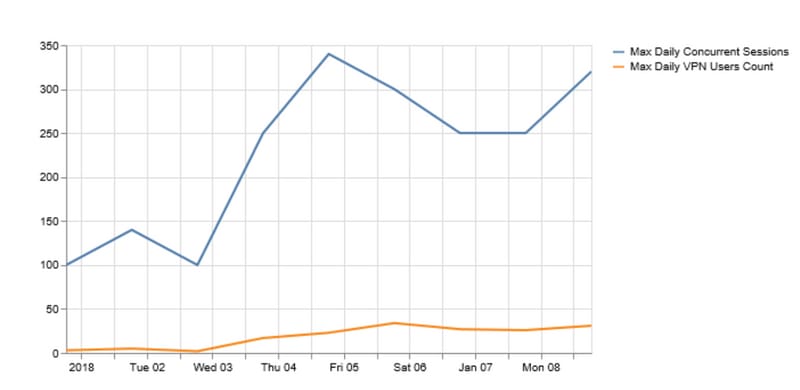
If the number of VPN users or concurrent connections are getting closer to the capacity of the VPN headend, then it may cause these issues:
- New VPN users being dropped.
- New data connections through the ASA being dropped and users not able to access the resources.
- High CPU and/or memory.
The trend over a period of time can help determine if the box is reaching its threshold.
Identify Traffic Trend is towards Internal Network or External Networks
Show conn output on Cisco ASA can provide additional details such as whether traffic is to internal or external networks and how much data in bytes per flow is passed through the firewall.
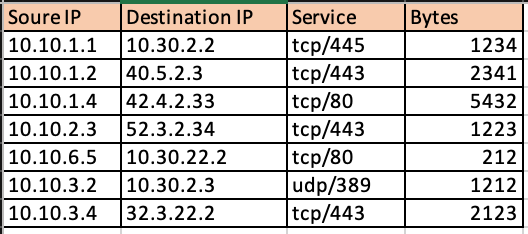
Usage of Netaddr python module makes it easy to split the obtained connection table into flows to external networks and to internal networks.
for f in df['Responder IP']:
    private.append(IPAddress(f).is_private())

df['private'] = private

df_ext = df[df['private'] == False]

df_int = df[df[‘private’] == True]
This is the image of Internal Traffic.

This is the image of External Traffic.

Thereby, providing an insight into what percentage of VPN traffic is destined to the internal networks and how much of it is going out to the internet. The collection of this information over a period of time and the analysis of its trend can help determine if the VPN traffic is predominantly external or internal.
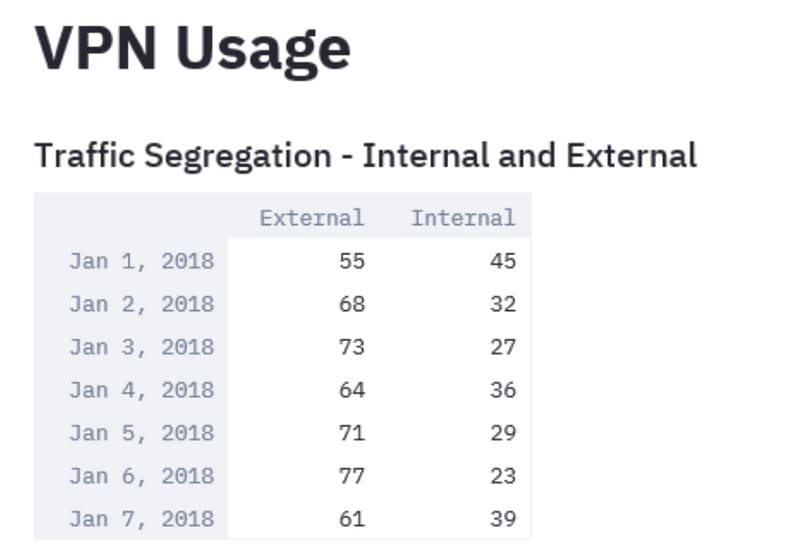
Modules like Streamlit make it possible to not just convert the tabular data into a graphical representation but also apply modifications to it in real-time to aid the analysis. It can modify the time window of the collected data or add additional data to the parameters being monitored.
import streamlit

#traffic_ptg being a 2D array containing the data collected as in the table above

d = st.slider('Days',1,30,(1,7))

idx = pd.date_range('2018-01-01', periods=7, freq='D')

df = pd.DataFrame(d<subset of the list traffic_ptg based on slider value>,columns=['External','Internal'],index=idx)

st.bar_chart(df)
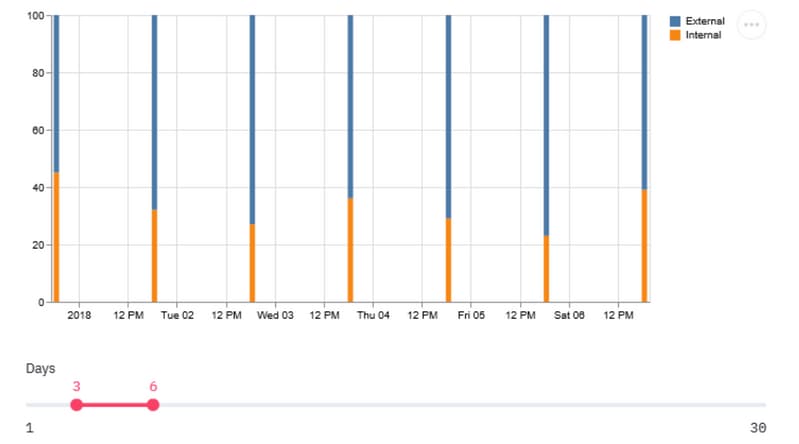
A trend that leans toward higher internal traffic could mean that majority of the VPN users access internal resources. Hence, to cater to this, increase in load, it is important to plan upgrades to bigger boxes or share the load with concepts like VPN load-balancing.
In some cases, the VPN capacity might be still under threshold but an increase in the number of VPN users can exhaust the current configured VPN Pool. In such cases, increase the VPN IP Pool.
However, if the trend shows that the majority of the VPN traffic is external, then you can use split tunneling.
Utilize Split-Tunneling Feature
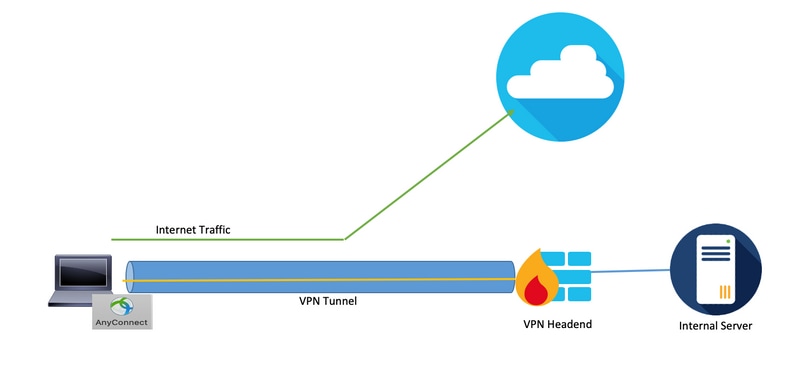
It is a feature that forwards only a specific set of traffic through the tunnel from the user system and the rest of the traffic is forwarded to the default gateway without VPN encryption. Hence, to reduce the load on the VPN concentrator, only the traffic destined to the internal network could be routed through the tunnel, and internet traffic could be forwarded through the user’s local ISP. This is an effective method and widely adopted but it has some risks attached to it.
An employee access some social media sites over unprotected networks for a quick break can infect their laptop with malware that spreads across the company due to a lack of the defense-in-depth security layers that are set up in the workplace. Once infected, the compromised device could become a pivot point from the internet into the trusted segment, with bypassed the perimeter defenses.
One way to reduce the risk while utilizing this feature would be to use split tunneling only for cloud services that pass stringent security criteria, including good data hygiene and compatibility with Duo Security. Adopting this will help if a good amount of the external traffic observed earlier, is destined for these secure cloud services. This brings up the need to analyze web applications being accessed by VPN users.
Most of the next-generation firewalls like Cisco Firepower Threat Defense (FTD) contain application information associated with the event in logs. Parsing and cleaning this log data with python csv libraries and pandas data manipulation features can provide a similar dataset as above with an addition of the applications being accessed mapped to it.
#connections.csv contains the connection events from ASA and events_with_app.csv contains connection events with Application details fromFTD

df1 = pd.read_csv(‘connections.csv’)
df2 = pd.read_csv(‘events_with_app.csv')

df_merged = pd.merge(df1,df2,on=['Source IP','Destination IP','Service'])
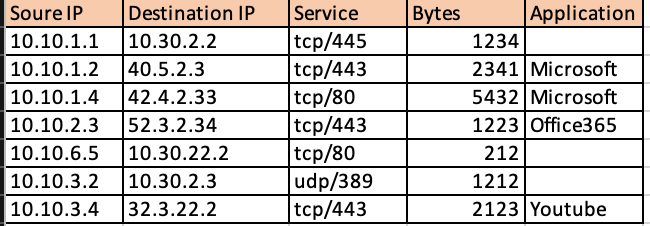
Once a data frame as above is obtained, you can categorize the total external traffic based on the application through pandas.
df2 = df.groupby('Application')

df3 = df2['Bytes'].sum()
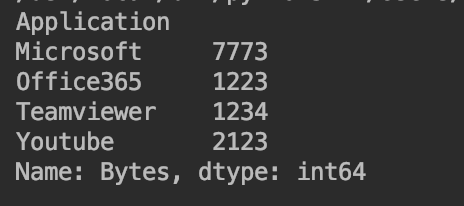
Usage of Streamlit again obtains a graphical representation of the share of each application in total traffic. It allows the flexibility to change the time window for data to be included as well as filter out applications on the user interface itself without the need for any changes in the code, which makes the analysis easy and accurate.
import matplotlib.pyplot as plt

apps = ['Office365', 'Microsoft', 'Teamviewer', 'Youtube']
app_select = st.sidebar.multiselect('Select Apps',activities)

# app_bytes - list containing the applications and bytes

plt.pie(app_bytes, labels=apps)
plt.title('Application Usage')

st.pyplot()
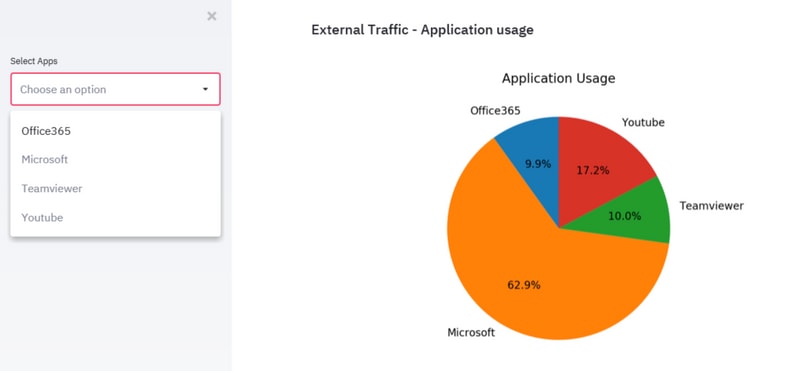
This can simplify the process of identification of the top web applications being used by VPN users over a period of time and if these applications are to secure cloud services or not.
If the most voluminous applications are destined to identify secure cloud services, they can be used with a split tunnel, thus reduces the load on a VPN concentrator. However, if the top applications are to services that are less secure or may pose a risk, it is more secure to pass them through the VPN tunnel. Reason being that other network security devices can process the traffic before they allow such traffic to pass. You can then utilize access policies on the firewalls to limit access to external networks.
Identity Individual Non-Compliant VPN Users
In some cases, the surge could be associated with only a few users with them that do not comply with certain policies. The modules and datasets used above can be used again to identify the top VPN users and the web applications they access. This can aid in the isolation of such users and observe their effect on the device load.
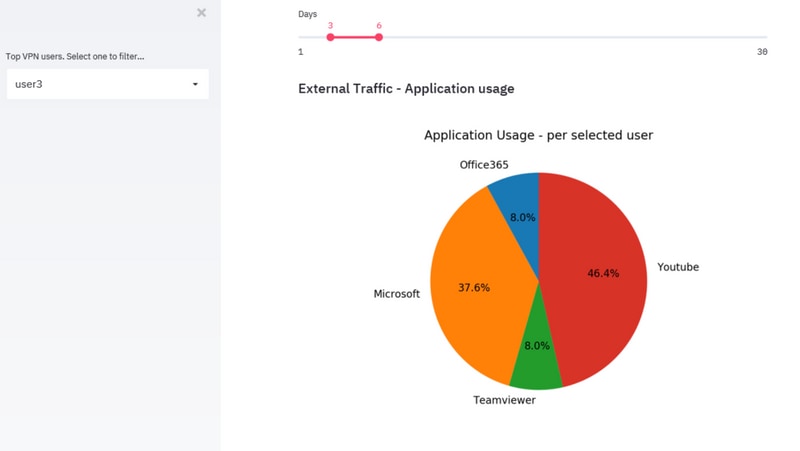
In scenarios, where none of the methods fit, admins should look at endpoint security solutions such as AMP for Endpoints solution and Cisco Umbrella solution to protect the endpoints in unprotected networks.
Contributed by Cisco Engineers
- Sameer SinghCisco Advanced Services
Contact Cisco
- Open a Support Case

- (Requires a Cisco Service Contract)
 Feedback