How to Handle Microbursts in ASR 920, Differences Between Bytes and Percent with Queue-Limit
Available Languages
Download Options
Bias-Free Language
The documentation set for this product strives to use bias-free language. For the purposes of this documentation set, bias-free is defined as language that does not imply discrimination based on age, disability, gender, racial identity, ethnic identity, sexual orientation, socioeconomic status, and intersectionality. Exceptions may be present in the documentation due to language that is hardcoded in the user interfaces of the product software, language used based on RFP documentation, or language that is used by a referenced third-party product. Learn more about how Cisco is using Inclusive Language.
Contents
Introduction
This document describes how to handle microbursts in ASR 920 routers, that are often the cause of interface output packet drops. In detail it is shown the difference between the usage of bytes and percent with the queue-limit command.
Prerequisites
Requirements
Cisco recommends that you have knowledge of these topics:
ASR 920 series routers
QoS policies
Components Used
The information in this document is based on a ASR 920 router that runs software version Cisco IOS-XE 16.9.6.
IXIA is used as a traffic generator of the lab test.
The information in this document was created from the devices in a specific lab environment. All of the devices used in this document started with a cleared (default) configuration. If your network is live, ensure that you understand the potential impact of any command.
Background Information
Microbursts are referred to as small spikes in network traffic. In Service Provider Access networks, for example, this commonly occurs in speed mismatch scenarios where a traffic flow enters the router from a high speed interface, like 10 Gigabit Ethernet (GE), and egresses out through a low speed interface, like 1 GE.
The most common problem that microbutsts cause in ASR 920 routers is interface packet drops in output direction. This happens when there are bursts on the incoming interface that are higher than the rate of the outgoing interface, for a very short period of time (order of milliseconds). During this time, the packets need to be buffered.
On ASR 920 / RSP2 platforms, the default buffer allocated for queues on each 1 GE interface is 48 KB, while for the queues on each 10 GE interface is 120 KB.
On top of that, there is a shared buffer available of 11.75 MB. When the default interface buffer is not enough to accomodate a burst of packets, the shared buffer can be used.
In order to enable the use of the shared buffer for an interface, it is needed to configure a QoS policy under that interface, that defines the queue-limit parameter.
Configure Queue-Limit
This is a configuration example of queue-limit for interface GE 0/0/1:
class-map match-all DUMMY
 match qos-group 99  <--- it can be any unused group

policy-map QUEUE-LIMIT
 class DUMMY
 class class-default
  queue-limit percent 5

interface GigabitEthernet 0/0/1
 service-policy output QUEUE-LIMIT
This policy does not match any traffic, therefore it does not impact it either. All this policy does is to increase the queue buffer of interface GE 0/0/1.
The command match qos-group 99 is needed because it is not supported to configure queue-limit in a non-leaf class, so you need to use a fictitious class-map as a parent class in order to configure the queue-limit command under the leaf class-default:
ASR-920-1(config)#policy-map QUEUE-LIMIT
ASR-920-1(config-pmap)#class class-default
ASR-920-1(config-pmap-c)# queue-limit percent 5
QOS: queue-limit command not supported in non-leaf classes
queue-limit: platform params check fail
The queue-limit can be set in different ways:
(config-pmap-c)#queue-limit ?
  <1-2097152> in bytes, <1-1677721> in us, <1-8192000> in packets by default
  percent % of threshol
The paremeter and value must be selected in accordance with your network requirements.
In order to understand those parameters and how a change in the values affect the buffer usage, you can refer to the lab test presented in the next section.
Note: it is not supported to configure a QoS policy under port-channel interfaces, only under the physical interfaces part of the port-channel
ASR-920-1(config)#interface port-channel 2
ASR-920-1(config-if)#service-policy output qos-tac
QoS: Configuration failed. Policy-map with Queueing actions not supported on EC main-interface/EFP
QoS: Configuration errors for policymap qos-tac
Differences with RSP3 and NCS 520
Cisco RSP3 Module QoS Capabilities:
- RSP3 module has 4 GB external packet buffers per NPU
- RSP3 module supports 48000 queues
- By default, RSP3 module supports upto 1 MB queue-limit per queue
- Queue limit percentage is considered out of 1 GB of the total buffers
For routers with RSP3 supervisors and NCS 520, the number of qos-groups that can be configured is limited to 0-7:
ASR-903-1(config)#class-map match-all qos-tac
ASR-903-1(config-cmap)#match qos-group ?
<0-7> Qos Group value
In the NCS 520 there is a queue buffer of 2 MB shared between all the interfaces by default, an external 2 GB buffer is accessible when a policy-map with queue-limit is configured. There is also a difference in the bytes and us parameters for the queue-limit:
ASR-520-1(config-pmap-c)# queue-limit ?
<1-8192000> in bytes, <1-40000> in us, <1-8192000> in packets by default
percent % of threshold
Queue-Limit (QL) Lab Test, Differences Between Bytes and Percent
Test Scope and Parameters
As observed previously, the maximum value configurable for queue-limit in bytes is 2097152, which is approximately 18% of the shared buffer on ASR 920 platforms (11.75 MB ~ 45898 * 256 bytes).
If you configure queue-limit in percent though, you can go up to 100%. Therefore, in order to compare percent and bytes with equivalent values, the test takes bytes values from 117498 to 2097152 bytes and queue-limit percent values from 1% to 18%:
queue-limit percent 1 <=> queue-limit 117498 bytes
queue-limit percent 2 <=> queue-limit 234996 bytes
queue-limit percent 3 <=> queue-limit 352494 bytes
queue-limit percent 4 <=> queue-limit 469992 bytes
queue-limit percent 5 <=> queue-limit 587490 bytes
queue-limit percent 6 <=> queue-limit 704988 bytes
queue-limit percent 7 <=> queue-limit 822486 bytes
queue-limit percent 8 <=> queue-limit 939984 bytes
queue-limit percent 9 <=> queue-limit 1057482 bytes
queue-limit percent 10 <=> queue-limit 1174980 bytes
queue-limit percent 11 <=> queue-limit 1292478 bytes
queue-limit percent 12 <=> queue-limit 1409976 bytes
queue-limit percent 13 <=> queue-limit 1527474 bytes
queue-limit percent 14 <=> queue-limit 1644972 bytes
queue-limit percent 15 <=> queue-limit 1762470 bytes
queue-limit percent 16 <=> queue-limit 1879968 bytes
queue-limit percent 17 <=> queue-limit 1997466 bytes
queue-limit percent 18 <=> queue-limit 2097152 bytes
36 policy-maps are configured: 18 with queue-limit values that range from 1% to 18% and the other 18 with queue-limit values that range from 117498 to 2097152 bytes.
policy-map QUEUE-LIMIT-PERCENT-X
class DUMMY
class class-default
  queue-limit percent X

policy-map QUEUE-LIMIT-BYTES-X
class DUMMY
class class-default
  queue-limit Y bytes

=> X values range from 1 to 18
=> Y values range from 117498 to 2097152
Each policy is tested against the same microburst traffic, which is generated with IXIA. This traffic arrives on a 10 GE port of the ASR 920 and exits on a 1 GE port of the same router.
The bursts consist of 20000 packets at 4Gbps at intervals of 5 seconds. This is the burst duration given a specific packet size:
1280000 bytes at 64 packet size, Burst duration: 0.00256 second
4000000 bytes at 200 packet size, Burst duration: 0.008 second
6000000 bytes at 300 packet size, Burst duration: 0.012 second
10360000 bytes at 518 packet size, Burst duration: 0.02072 second
16000000 bytes at 800 packet size, Burst duration: 0.032 second
20480000 bytes at 1024 packet size, Burst duration: 0.04096 second
28000000 bytes at 1400 packet size, Burst duration: 0.056 second
Test Procedure
Step 1. Apply the policy-map QUEUE-LIMIT-BYTES-X (X=1) with bytes Y=117498 under the outbound interface.
Step 2. Run microburst traffic for 1 minute.
Step 3. Measure the total number of packets in output and how many packets were dropped.
Step 4. Calculate the ratio between packets dropped and total output packets.
Step 5. Repeat once from step 1, this time use policy-map QUEUE-LIMIT-PERCENT-X with queue-limit percent X, where X=1.
Step 6. Repeat from step 1 with X=X+1 for policy-map name and percent value, Y=Y+117498 bytes. Repeat until X=18 and Y=2097152.
Example
Measurement with QUEUE-LIMIT-BYTES-1 policy-map:
ASR-920-1#show int Gi0/0/1
GigabitEthernet0/0/1 is up, line protocol is up
  Hardware is 24xGE-4x10GE-FIXED-S, address is 70df.2f2f.ed01 (bia 70df.2f2f.ed01)
  Internet address is 10.12.10.47/31
  MTU 8900 bytes, BW 1000000 Kbit/sec, DLY 10 usec,
     reliability 255/255, txload 4/255, rxload 4/255
  Encapsulation ARPA, loopback not set
  Keepalive set (10 sec)
  Full Duplex, 1000Mbps, link type is auto, media type is T
  output flow-control is unsupported, input flow-control is on
  Carrier delay is 0 msec
  ARP type: ARPA, ARP Timeout 04:00:00
  Last input 00:00:01, output 00:00:02, output hang never
  Last clearing of "show interface" counters never
  Input queue: 0/375/0/0 (size/max/drops/flushes); Total output drops: 684263427
  Queueing strategy: Class-based queueing
  Output queue: 0/40 (size/max)
  30 second input rate 19475000 bits/sec, 19533 packets/sec
  30 second output rate 19157000 bits/sec, 13356 packets/sec
     5064106237 packets input, 4333296255278 bytes, 0 no buffer
     Received 29 broadcasts (0 IP multicasts)
     0 runts, 0 giants, 0 throttles
     0 input errors, 0 CRC, 0 frame, 0 overrun, 0 ignored
     0 watchdog, 726180 multicast, 0 pause input
     7829367523 packets output, 4217074973677 bytes, 0 underruns
     0 output errors, 0 collisions, 3 interface resets
     0 unknown protocol drops
     0 babbles, 0 late collision, 0 deferred
     0 lost carrier, 0 no carrier, 0 pause output
     0 output buffer failures, 0 output buffers swapped out

ASR-920-1#show policy-map int Gi0/0/1 output
GigabitEthernet0/0/1


  Service-policy output: QUEUE-LIMIT-BYTES-1


    Class-map: DUMMY (match-all)
      0 packets, 0 bytes
      30 second offered rate 0000 bps
      Match: qos-group 99


    Class-map: class-default (match-any)
      1044078 packets, 73085460 bytes
      30 second offered rate 9759000 bps, drop rate 0000 bps
      Match: any


      queue limit 117498 bytes
      (queue depth/total drops/no-buffer drops) 0/0/0
      (pkts output/bytes output) 0/0
Measurement after 1 minute of microburst traffic:
ASR-920-1#show int Gi0/0/1
GigabitEthernet0/0/1 is up, line protocol is up
  Hardware is 24xGE-4x10GE-FIXED-S, address is 70df.2f2f.ed01 (bia 70df.2f2f.ed01)
  Internet address is 10.12.10.47/31
  MTU 8900 bytes, BW 1000000 Kbit/sec, DLY 10 usec,
     reliability 255/255, txload 2/255, rxload 3/255
  Encapsulation ARPA, loopback not set
  Keepalive set (10 sec)
  Full Duplex, 1000Mbps, link type is auto, media type is T
  output flow-control is unsupported, input flow-control is on
  Carrier delay is 0 msec
  ARP type: ARPA, ARP Timeout 04:00:00
  Last input 00:00:01, output 00:00:01, output hang never
  Last clearing of "show interface" counters never
  Input queue: 0/375/0/0 (size/max/drops/flushes); Total output drops: 684561562
  Queueing strategy: Class-based queueing
  Output queue: 0/40 (size/max)
  30 second input rate 13981000 bits/sec, 19643 packets/sec
  30 second output rate 11256000 bits/sec, 12784 packets/sec
     5064715137 packets input, 4333338878716 bytes, 0 no buffer
     Received 29 broadcasts (0 IP multicasts)
     0 runts, 0 giants, 0 throttles
     0 input errors, 0 CRC, 0 frame, 0 overrun, 0 ignored
     0 watchdog, 726190 multicast, 0 pause input
     7829753878 packets output, 4217102018968 bytes, 0 underruns
     0 output errors, 0 collisions, 3 interface resets
     0 unknown protocol drops
     0 babbles, 0 late collision, 0 deferred
     0 lost carrier, 0 no carrier, 0 pause output
     0 output buffer failures, 0 output buffers swapped out

ASR-920-1#show policy-map int Gi0/0/1 output
GigabitEthernet0/0/1


  Service-policy output: QUEUE-LIMIT-BYTES-1


    Class-map: DUMMY (match-all)
      0 packets, 0 bytes
      30 second offered rate 0000 bps
      Match: qos-group 99


    Class-map: class-default (match-any)
      1847215 packets, 129305050 bytes
      30 second offered rate 10804000 bps, drop rate 0000 bps
      Match: any


      queue limit 117498 bytes
      (queue depth/total drops/no-buffer drops) 0/387570/0
      (pkts output/bytes output) 656508/45955560
Packet drops delta: 684561562 – 684263427 = 298135
Total packets output delta: 7829753878 – 7829367523 = 386355
Ratio between packet drops and packets out: 298135 / 386355 = 77%
Lab Test Results
As explained, 36 policy-maps are tested: 18 configured with queue-limit values that range from 1% to 18% are tested against the other 18 policies configured with queue-limit values that range from 117498 to 2097152 bytes. Each policy-map is tested against the same microburst traffic, generated with IXIA.
In this section are exposed the results of this test, repeated 7 times in order to check the results with different packet sizes, in bytes: 64, 200, 300, 518, 800, 1024, 1400.
In order to facilitate the reading, for each packet size the results are exposed into a table and then graphed.
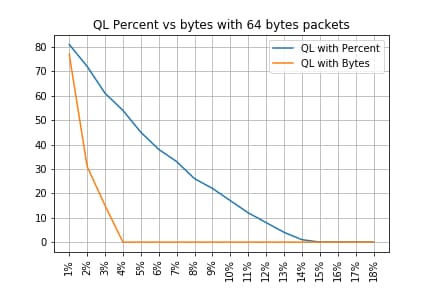
QL Percent vs Bytes with 64 Bytes Packets
-------------------------------------------------------------------
Policy-map          |      Drop rate with PC | Drop rate with Bytes
-------------------------------------------------------------------
QL Bytes/Percent  1 |                   81% |                   77%
QL Bytes/Percent  2 |                   72% |                   31%
QL Bytes/Percent  3 |                   61% |                   15%
QL Bytes/Percent  4 |                   54% |                    0%
QL Bytes/Percent  5 |                   45% |                    0%
QL Bytes/Percent  6 |                   38% |                    0%
QL Bytes/Percent  7 |                   33% |                    0%
QL Bytes/Percent  8 |                   26% |                    0%
QL Bytes/Percent  9 |                   22% |                    0%
QL Bytes/Percent 10 |                   17% |                    0%
QL Bytes/Percent 11 |                   12% |                    0%
QL Bytes/Percent 12 |                    8% |                    0%
QL Bytes/Percent 13 |                    4% |                    0%
QL Bytes/Percent 14 |                    1% |                    0%
QL Bytes/Percent 15 |                    0% |                    0%
QL Bytes/Percent 16 |                    0% |                    0%
QL Bytes/Percent 17 |                    0% |                    0%
QL Bytes/Percent 18 |                    0% |                    0%
-------------------------------------------------------------------
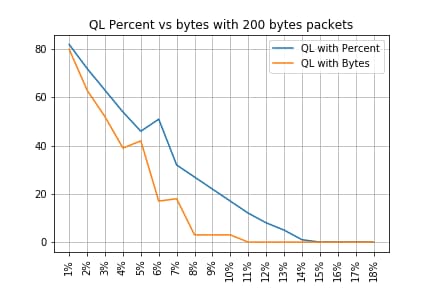
QL Percent vs Bytes with 200 Bytes Packets
-------------------------------------------------------------------
Policy-map          |      Drop rate with PC | Drop rate with Bytes
-------------------------------------------------------------------
QL Bytes/Percent  1 |                   82% |                   80%
QL Bytes/Percent  2 |                   72% |                   63%
QL Bytes/Percent  3 |                   63% |                   52%
QL Bytes/Percent  4 |                   54% |                   39%
QL Bytes/Percent  5 |                   46% |                   42%
QL Bytes/Percent  6 |                   51% |                   17%
QL Bytes/Percent  7 |                   32% |                   18%
QL Bytes/Percent  8 |                   27% |                    3%
QL Bytes/Percent  9 |                   22% |                    3%
QL Bytes/Percent 10 |                   17% |                    3%
QL Bytes/Percent 11 |                   12% |                    0%
QL Bytes/Percent 12 |                    8% |                    0%
QL Bytes/Percent 13 |                    5% |                    0%
QL Bytes/Percent 14 |                    1% |                    0%
QL Bytes/Percent 15 |                    0% |                    0%
QL Bytes/Percent 16 |                    0% |                    0%
QL Bytes/Percent 17 |                    0% |                    0%
QL Bytes/Percent 18 |                    0% |                    0%
-------------------------------------------------------------------
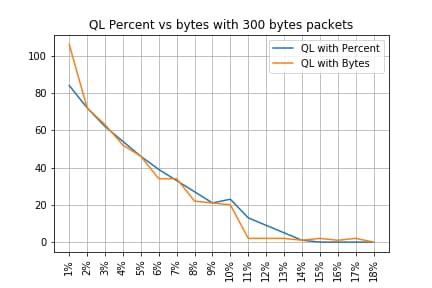
QL Percent vs Bytes with 300 Bytes Packets
-------------------------------------------------------------------
Policy-map          |      Drop rate with PC | Drop rate with Bytes
-------------------------------------------------------------------
QL Bytes/Percent  1 |                   84% |                  106%
QL Bytes/Percent  2 |                   72% |                   72%
QL Bytes/Percent  3 |                   62% |                   63%
QL Bytes/Percent  4 |                   54% |                   52%
QL Bytes/Percent  5 |                   46% |                   46%
QL Bytes/Percent  6 |                   39% |                   34%
QL Bytes/Percent  7 |                   33% |                   34%
QL Bytes/Percent  8 |                   27% |                   22%
QL Bytes/Percent  9 |                   21% |                   21%
QL Bytes/Percent 10 |                   23% |                   20%
QL Bytes/Percent 11 |                   13% |                    2%
QL Bytes/Percent 12 |                    9% |                    2%
QL Bytes/Percent 13 |                    5% |                    2%
QL Bytes/Percent 14 |                    1% |                    1%
QL Bytes/Percent 15 |                    0% |                    2%
QL Bytes/Percent 16 |                    0% |                    1%
QL Bytes/Percent 17 |                    0% |                    2%
QL Bytes/Percent 18 |                    0% |                    0%
-------------------------------------------------------------------
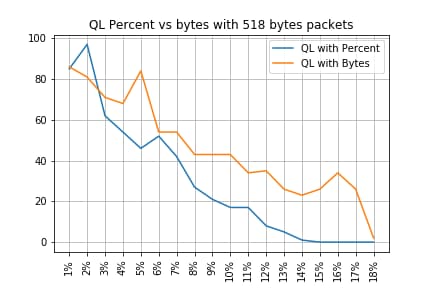
QL Percent vs Bytes with 518 Bytes Packets
-------------------------------------------------------------------
Policy-map          |      Drop rate with PC | Drop rate with Bytes
-------------------------------------------------------------------
QL Bytes/Percent  1 |                   85% |                   86%
QL Bytes/Percent  2 |                   97% |                   81%
QL Bytes/Percent  3 |                   62% |                   71%
QL Bytes/Percent  4 |                   54% |                   68%
QL Bytes/Percent  5 |                   46% |                   84%
QL Bytes/Percent  6 |                   52% |                   54%
QL Bytes/Percent  7 |                   42% |                   54%
QL Bytes/Percent  8 |                   27% |                   43%
QL Bytes/Percent  9 |                   21% |                   43%
QL Bytes/Percent 10 |                   17% |                   43%
QL Bytes/Percent 11 |                   17% |                   34%
QL Bytes/Percent 12 |                    8% |                   35%
QL Bytes/Percent 13 |                    5% |                   26%
QL Bytes/Percent 14 |                    1% |                   23%
QL Bytes/Percent 15 |                    0% |                   26%
QL Bytes/Percent 16 |                    0% |                   34%
QL Bytes/Percent 17 |                    0% |                   26%
QL Bytes/Percent 18 |                    0% |                    2%
-------------------------------------------------------------------
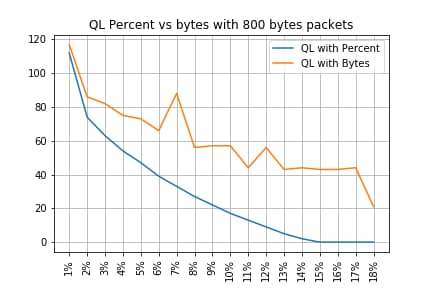
QL Percent vs Bytes with 800 Bytes Packets
-------------------------------------------------------------------
Policy-map          |      Drop rate with PC | Drop rate with Bytes
-------------------------------------------------------------------
QL Bytes/Percent  1 |                  112% |                  117%
QL Bytes/Percent  2 |                   74% |                   86%
QL Bytes/Percent  3 |                   63% |                   82%
QL Bytes/Percent  4 |                   54% |                   75%
QL Bytes/Percent  5 |                   47% |                   73%
QL Bytes/Percent  6 |                   39% |                   66%
QL Bytes/Percent  7 |                   33% |                   88%
QL Bytes/Percent  8 |                   27% |                   56%
QL Bytes/Percent  9 |                   22% |                   57%
QL Bytes/Percent 10 |                   17% |                   57%
QL Bytes/Percent 11 |                   13% |                   44%
QL Bytes/Percent 12 |                    9% |                   56%
QL Bytes/Percent 13 |                    5% |                   43%
QL Bytes/Percent 14 |                    2% |                   44%
QL Bytes/Percent 15 |                    0% |                   43%
QL Bytes/Percent 16 |                    0% |                   43%
QL Bytes/Percent 17 |                    0% |                   44%
QL Bytes/Percent 18 |                    0% |                   21%
-------------------------------------------------------------------
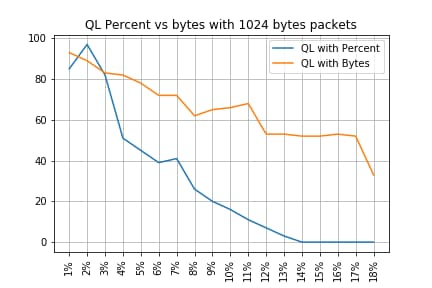
QL Percent vs Bytes with 1024 Bytes Packets
-------------------------------------------------------------------
Policy-map          |      Drop rate with PC | Drop rate with Bytes
-------------------------------------------------------------------
QL Bytes/Percent  1 |                   85% |                   93%
QL Bytes/Percent  2 |                   97% |                   89%
QL Bytes/Percent  3 |                   82% |                   83%
QL Bytes/Percent  4 |                   51% |                   82%
QL Bytes/Percent  5 |                   45% |                   78%
QL Bytes/Percent  6 |                   39% |                   72%
QL Bytes/Percent  7 |                   41% |                   72%
QL Bytes/Percent  8 |                   26% |                   62%
QL Bytes/Percent  9 |                   20% |                   65%
QL Bytes/Percent 10 |                   16% |                   66%
QL Bytes/Percent 11 |                   11% |                   68%
QL Bytes/Percent 12 |                    7% |                   53%
QL Bytes/Percent 13 |                    3% |                   53%
QL Bytes/Percent 14 |                    0% |                   52%
QL Bytes/Percent 15 |                    0% |                   52%
QL Bytes/Percent 16 |                    0% |                   53%
QL Bytes/Percent 17 |                    0% |                   52%
QL Bytes/Percent 18 |                    0% |                   33%
-------------------------------------------------------------------
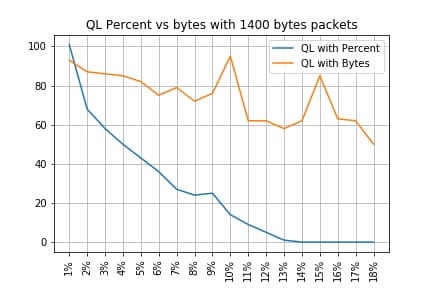
QL Percent vs Bytes with 1400 Bytes Packets
-------------------------------------------------------------------
Policy-map          |      Drop rate with PC | Drop rate with Bytes
-------------------------------------------------------------------
QL Bytes/Percent  1 |                  101% |                   93%
QL Bytes/Percent  2 |                   68% |                   87%
QL Bytes/Percent  3 |                   58% |                   86%
QL Bytes/Percent  4 |                   50% |                   85%
QL Bytes/Percent  5 |                   43% |                   82%
QL Bytes/Percent  6 |                   36% |                   75%
QL Bytes/Percent  7 |                   27% |                   79%
QL Bytes/Percent  8 |                   24% |                   72%
QL Bytes/Percent  9 |                   25% |                   76%
QL Bytes/Percent 10 |                   14% |                   95%
QL Bytes/Percent 11 |                    9% |                   62%
QL Bytes/Percent 12 |                    5% |                   62%
QL Bytes/Percent 13 |                    1% |                   58%
QL Bytes/Percent 14 |                    0% |                   62%
QL Bytes/Percent 15 |                    0% |                   85%
QL Bytes/Percent 16 |                    0% |                   63%
QL Bytes/Percent 17 |                    0% |                   62%
QL Bytes/Percent 18 |                    0% |                   50%
-------------------------------------------------------------------
Relation Between Drops and Packet Size
As mentioned, the ASR 920 has an internal packet buffer of 11.75 MB which is divided in 45898 Qnodes of 256 bytes each.
- For a packet with size < 256 bytes, exactly 1 Qnode is used
- For a packet with size 1024 bytes, 4 Qnodes are used
- For a packet with size 257 bytes, 2 Qnodes are used and the unused 255 bytes are lost
Hence, you can store a smaller amount of large packets than what you can store with small packets. The relation between drop rate and packet size at equivalent queue-limit sizes is expected.
Difference Between Equivalent Bytes and Percent Values
As explained, there are 45898 Qnodes in the 11.75 MB shared buffer, rounded to 45900 for ease of calculation.
The queue-limit percent calculation does not calculate the percentage of the 11.75 MB but that of the 45900 Qnodes. So, queue-limit percent 10 means 10% of 45900 which gives 4590 Qnodes.
Furthermore, the percentage of Qnodes allocated is considered as the number of packets that can be stored in the queue, independently from its size. Back to the previous example, this means that:
queue-limit percent 10 = 4590 Qnodes = 4590 packets.
Since this calculation is independent of the packet size, for packets sized 256 bytes or less, only one Qnode is actually used and the equivalence between Qnodes and packets is maintained:
queue-limit percent 10 = 4590 Qnodes = 4590 packets of 256 bytes = 4590*256 bytes = 1.175 MB = 10% of the buffer
With larger packets however, a more generous portion of the buffer is allocated. For example, this is the calculation for 1024 bytes packets, where each packet consumes 4 Qnodes:
queue-limit percent 10 = 4590 Qnodes = 4590 packets of 1024 bytes = 4590*4*256 bytes = 4.7 MB = 40% of the buffer
Caution: it is not recommended to configure high values of queue-limit percent.
If you configure high values of queue-limit percent, a single interface could temporarily occupy all the shared buffer of 11.75 MB.
Conclusions
- You can clearly see that the efficency of queue-limit bytes is better with small packets – queue-limit bytes <x> works better than queue-limit <x> for up to 300 bytes
- At 300 bytes packet, queue-limit bytes and queue-limit percent efficiency is the same
- Over 300 bytes packet size, queue-limit percent is more efficient. Since internet traffic is average of 518bytes, this means that real life scenarios benefit more from queue-limit percent, as reported by the customers
- The efficiency of queue-limit percent linearly improves related to the packet size (the bigger the packets the more efficient queue-limit percent is vs queue-limit bytes)
- Queue-limit percent is implemented to be more generous in the buffer space allocation for packets over 256 MB size
How to Approximate the Percent Values in Real Traffic Scenarios
In the case where you have packets with size of 256 bytes and queue-limit of 10%, you already know that this equivalence is valid:
minimum queue-limit = 4590 Qnodes = 4590*256 bytes = 1.175 MB = 10% of the buffer
With 512 bytes packets only the usage is the double, with 1024 bytes only packets it is four times as much, and so on.
This means that the actual queue-limit is at minimum 10% of the buffer and, if you assume a maximum MTU of 1500 bytes, you need 6 Qnodes to store a single packet, which gives a maximum queue-limit of:
maximum queue-limit = 4590*6 Qnodes = 4590*256*6 bytes = 7.05 MB = 60% of the buffer
In this way you can define the lower and upper bounds of the buffer usage with queue-limit percent 10, so more in general the average max buffer usage is approximately:
ceil(avg_pkt_size/256)*((qlimit_percent/45900)*100)
Example from a lab equipment:
GigabitEthernet0/0/1 is up, line protocol is up
  Hardware is 24xGE-4x10GE-FIXED-S, address is 70df.2f2f.ed01 (bia 70df.2f2f.ed01)
  Internet address is 10.12.10.47/31
  MTU 8900 bytes, BW 1000000 Kbit/sec, DLY 10 usec,
     reliability 255/255, txload 25/255, rxload 30/255
  Encapsulation ARPA, loopback not set
  Keepalive set (10 sec)
  Full Duplex, 1000Mbps, link type is auto, media type is T
  output flow-control is unsupported, input flow-control is on
  Carrier delay is 0 msec
  ARP type: ARPA, ARP Timeout 04:00:00
  Last input 00:00:00, output 00:00:01, output hang never
  Last clearing of "show interface" counters 00:11:43
  Input queue: 0/375/0/0 (size/max/drops/flushes); Total output drops: 2036062
  Queueing strategy: Class-based queueing
  Output queue: 0/40 (size/max)
  30 second input rate 118520000 bits/sec, 18902 packets/sec
  30 second output rate 101646000 bits/sec, 16124 packets/sec
     13185272 packets input, 10328798549 bytes, 0 no buffer
     Received 0 broadcasts (0 IP multicasts)
     0 runts, 0 giants, 0 throttles
     0 input errors, 0 CRC, 0 frame, 0 overrun, 0 ignored
     0 watchdog, 235 multicast, 0 pause input
     11247114 packets output, 8870166880 bytes, 0 underruns  <<<  avg_pkt_size = 8870166880/11247114 = 788.66 bytes
     0 output errors, 0 collisions, 0 interface resets
     0 unknown protocol drops
     0 babbles, 0 late collision, 0 deferred
     0 lost carrier, 0 no carrier, 0 pause output
     0 output buffer failures, 0 output buffers swapped out
You can calculate the avg_pkt_size as 8870166880/11247114 ~ 788 bytes.
With a queue-limit percent 10, you have an average max buffer usage of:
ceil(avg_pkt_size/256)*((45900/100)*qlimit_percent)

Calculation example with Python:
>>> import math
>>> math.ceil(788/256)*((45900/100)*10)
18360.0

=> 18360 Qnodes = 18360 * 256 bytes = 4.7 MB = 40% of the buffer
How to Verify Microburst Buffer Usage
In Cisco IOS-XE releases prior to 16.9.3, the interfaces' shared buffer was used for both data and control packets (such as BFD, routing protocols, ARP, LDP, punt keepalives). In order to verify the instant buffer usage you can use this command:
ASR-920-1#request platform software sdcli "nile bm reg buffertablefreelistcount show 0 0 0"
After 16.9.3 some changes have been introduced to improve the buffer usage and it has been split in 2: 1024 entries (256KB) have been reserved for control traffic and the rest is reserved for data traffic.
The buffer usage in this case can be monitored with these commands:
ASR-920-1#request platform software sdcli "nile bm reg supervisorresourcereservedcounttableaccess sh 0 0 0"
reservedUsedCount = 48 (0x30)
reservedFreeCount = 976 (0x3d0)

ASR-920-1#request platform software sdcli "nile bm reg supervisorresourcereservedcounttableaccess sh 0 2 0"
reservedUsedCount = 8114 (0x1fb2)
reservedFreeCount = 37784 (0x9398)
Note that, given the fact the buffer handles microbursts, you have to repeat the command many times to see the reservedUsedCount value different from 0.
The buffer usage can simply be calculated with reservedUsedCount/reservedFreeCount, for example 8114/37784 = 21,5% used. Once the burst is over, the buffer must quickly fall back to 0 or close to.
From Cisco IOS-XE release 17.6.1, it is possible to choose to use the whole buffer for both data and control traffic (preferrable if your network has high rate of control traffic) or split the buffer in 2 as described earlier. The choice is made with the configuration of this instruction (disabled by default):
ACDC-920-1(config)#platform qos-buffer enhance enable
ACDC-920-1(config)#no platform qos-buffer enhance enable
From Cisco IOS-XE release 17.7.1, it is also possible to choose the size to allocate to the control traffic:
ACDC-920-1(config)#platform qos-buffer enhance [1-4]
Where:
- 1 indicates control buffer of 256 KB
- 2 indicates 500 KB
- 3 indicates 756 KB
- 4 indicates 1 MB
Revision History
| Revision | Publish Date | Comments |
|---|---|---|
1.0 |
10-Oct-2022 |
Initial Release |
Contributed by Cisco Engineers
- Tristan Van EgrooTAC
- Francesco Di CiccioTAC
Contact Cisco
- Open a Support Case

- (Requires a Cisco Service Contract)
 Feedback