Configure SD-WAN Advanced Malware Protection (AMP) Integration and Troubleshoot
Available Languages
Download Options
Bias-Free Language
The documentation set for this product strives to use bias-free language. For the purposes of this documentation set, bias-free is defined as language that does not imply discrimination based on age, disability, gender, racial identity, ethnic identity, sexual orientation, socioeconomic status, and intersectionality. Exceptions may be present in the documentation due to language that is hardcoded in the user interfaces of the product software, language used based on RFP documentation, or language that is used by a referenced third-party product. Learn more about how Cisco is using Inclusive Language.
Contents
Introduction
This document describes how to configure and troubleshoot the Cisco SD-WAN Advanced Malware Protection (AMP) integration on a Cisco IOS® XE SD-WAN router.
Prerequisites
Requirements
Cisco recommends that you have knowledge of these topics:
- Advanced Malware Protection (AMP)
- Cisco Software-Defined Wide Area Network (SD-WAN)
Components Used
The information in this document was created from the devices in a specific lab environment. All of the devices used in this document started with a cleared (default) configuration. If your network is live, ensure that you understand the potential impact of any command.
Solution Overview
Components
The SD-WAN AMP integration is an integral part of the SD-WAN edge security solution that aims visibility and protection for users at a branch from Malware.
It consists of these product components:
- WAN Edge Router at a branch. This is a Cisco IOS® XE router in controller mode with security features in a UTD container
- AMP Cloud. The AMP cloud infrastructure responds to file hash queries with a disposition
- ThreatGrid. The cloud infrastructure that can test a file for potential malware in a sandbox environment
These components work together to deliver these key feature capabilities for AMP:
- File reputation assessment
The process of SHA256 hash used to compare the file against the Advanced Malware Protection (AMP) cloud server and access its threat intelligence information. The response can be Clean, Unknown, or Malicious. If the response is Unknown, and if File Analysis is configured, the file is automatically submitted for further analysis.
- File Analysis
An unknown file is submitted to the ThreatGrid (TG) cloud for detonation in a sandbox environment. During detonation, the sandbox captures artifacts and observes behaviors of the file, then gives the file an overall score. Based on the observations and score, Threat Grid can change the threat response to Clean or Malicious. ThreatGrid’s findings are reported back to the AMP cloud so that all AMP users are protected against newly discovered malware.
- Retrospection
It maintains information about files even after they are downloaded, we can report on files that were determined to be malicious after they were downloaded. The disposition of the files could change based on the new threat intelligence gained by the AMP cloud. This re-classification generates automatic retrospective notifications.
Currently, SD-WAN with AMP integration supports file inspection for the protocols:
- HTTP
- SMTP
- IMAP
- POP3
- FTP
- SMB
Note: File Transfer over HTTPS is only supported with SSL/TLS Proxy .
Note: File analysis can only be performed on a complete file, and not file broken into partial content. For example, when an HTTP client requests partial content with the Range header and get back HTTP/1.1 206 Partial Content. In this case, because the partial file hash is significantly different from the complete file, Snort skips file inspection for the partial content.
Feature Flow
The image depicts the high-level flow for SD-WAN AMP integration when a file needs to be submitted to ThreatGrid for Analysis.
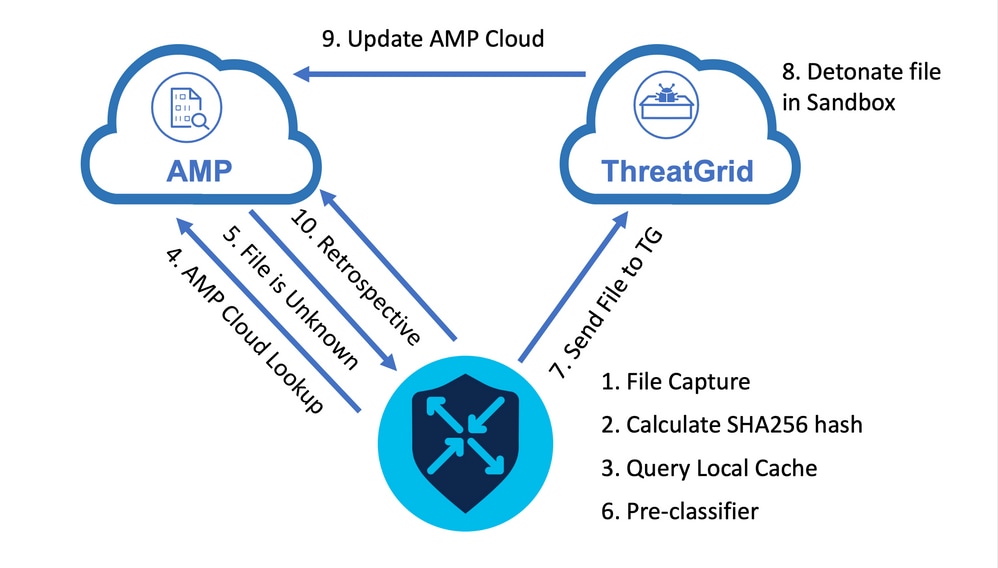
For the flow shown:
- File transfer for AMP-supported protocols is captured by the UTD container.
- The SHA256 hash for the file is calculated.
- The calculated SHA256 hash is queried against the local cache system in UTD to see if the disposition is already known and the cache TTL has not expired.
- If there is no match with the local cache, then the SHA256 hash is looked up against the AMP cloud for a disposition and return action.
- If the disposition is UNKNOWN and the response action is ACTION_SEND, the file runs through the pre-classification system in UTD.
- The pre-classifier determines the file type and also validates if the file contains active content.
- If both conditions are met, the file is submitted to ThreatGrid.
- ThreatGrid detonates the file in a sandbox and assigns the file a threat score.
- ThreatGrid updates the AMP cloud based on threat assessment.
- The edge device queries the AMP cloud for Retrospective based on the heartbeat interval of 30 minutes.
SD-WAN AMP Integration Configuration
Note: A security Virtual Image must be uploaded to vManage before the AMP feature configuration. For details, navigate to Security Virtual Image .
Note: Review this document for the network requirements for AMP/ThreatGrid connectivity to work correctly: AMP/TG Required IP Addresses/Hostnames
Configure Security Policy from vManage
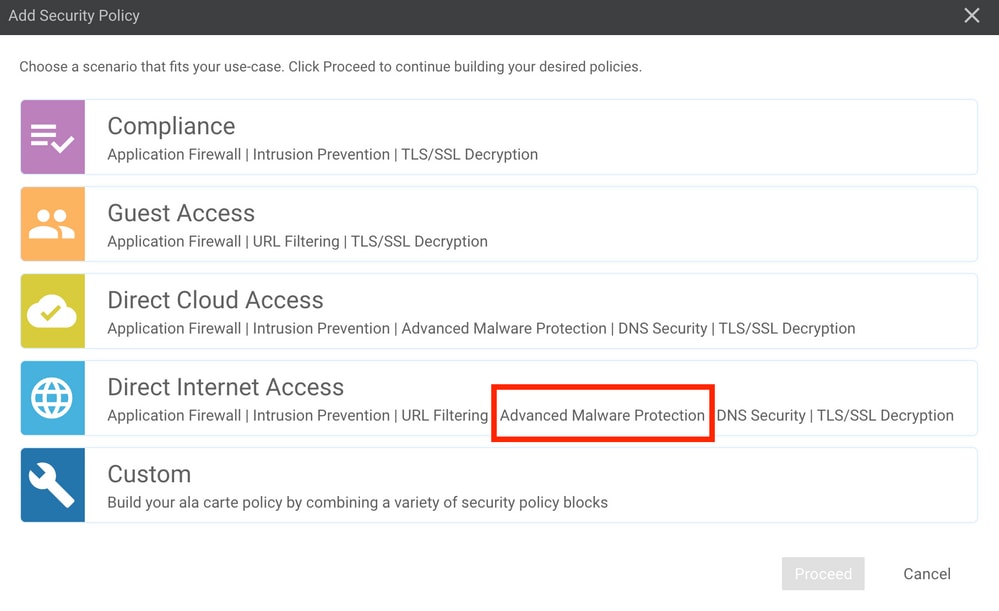
To enable AMP, navigate to Configuration -> Security -> Add Security Policy. Select Direct Internet Access and select Proceed as shown in the image.
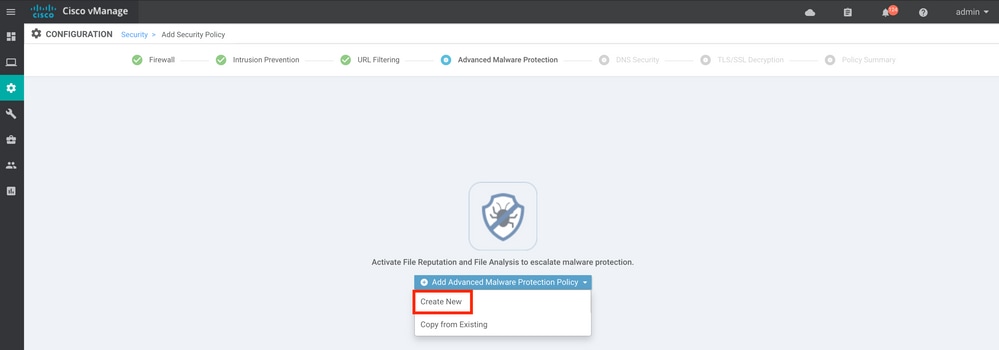
Configure the security features as desired till it gets to the Advanced Malware Protection feature. Add a new Advanced Malware Protection Policy.
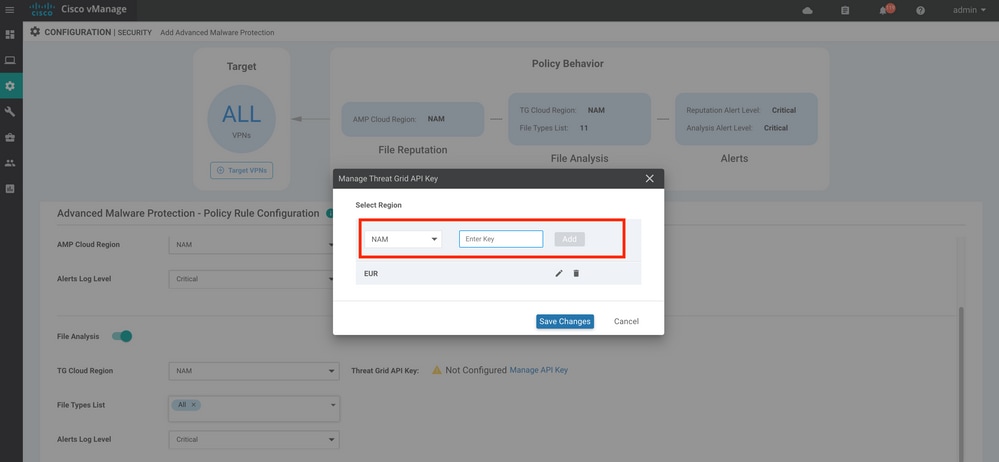
Provide a policy name. Select one of the global AMP cloud regions and enable File Analysis. For File Analysis with ThreatGrid used, choose one of the TG cloud regions, and enter the ThreatGrid API key, which can be obtained from the ThreatGrid portal under My ThreatGrid Account.
Once done, save the policy and add this security policy to the Device template under Additional Templates -> Security Policy as shown in the image.
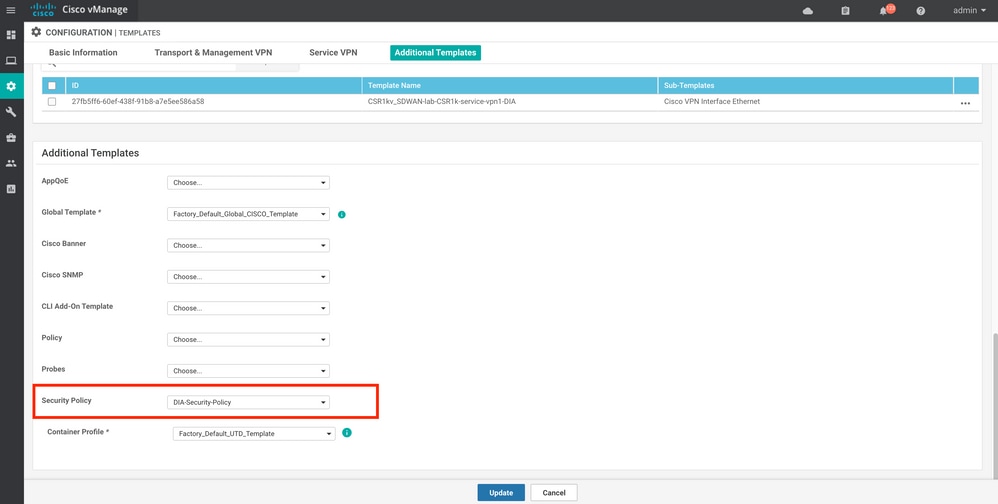
Configure the device with the updated device template.
Verify
Once the device template is successfully pushed to the edge device, the AMP configuration can be verified from the Edge Router CLI:
branch1-edge1#show sdwan running-config | section utd
app-hosting appid utd
app-resource package-profile cloud-low
app-vnic gateway0 virtualportgroup 0 guest-interface 0
guest-ipaddress 192.168.1.2 netmask 255.255.255.252
!
app-vnic gateway1 virtualportgroup 1 guest-interface 1
guest-ipaddress 192.0.2.2 netmask 255.255.255.252
!
start
utd multi-tenancy
utd engine standard multi-tenancy
threat-inspection profile IPS_Policy_copy
threat detection
policy balanced
logging level notice
!
utd global
file-reputation
cloud-server cloud-isr-asn.amp.cisco.com
est-server cloud-isr-est.amp.cisco.com
!
file-analysis
cloud-server isr.api.threatgrid.com
apikey 0 <redacted>
!
!
file-analysis profile AMP-Policy-fa-profile
file-types
ms-exe
new-office
rtf
mdb
mscab
msole2
wri
xlw
flv
swf
!
alert level critical
!
file-reputation profile AMP-Policy-fr-profile
alert level critical
!
file-inspection profile AMP-Policy-fi-profile
analysis profile AMP-Policy-fa-profile
reputation profile AMP-Policy-fr-profile
!
policy utd-policy-vrf-1
all-interfaces
file-inspection profile AMP-Policy-fi-profile
vrf 1
threat-inspection profile IPS_Policy_copy
exit
policy utd-policy-vrf-global
all-interfaces
file-inspection profile AMP-Policy-fi-profile
vrf global
exit
no shutdown
Troubleshoot
The SD-WAN AMP integration involves many components as described. So when it comes to troubleshoot, it is critical to be able to establish some key demarcation points to narrow the problem down to the components in the feature flow:
- vManage. Can the vManage successfully push the Security Policy with the AMP policy to the edge device?
- Edge. Once the security policy is successfully pushed to the edge, does the router capture the file subject to AMP inspection and send them to AMP/TG cloud?
- AMP/TG cloud. If the edge has sent the file to AMP or TG, does it get the response it needs to make a allow or drop decision?
This article is intended to focus on the edge device (2) with the various data plane tools available to help troubleshoot issues with AMP integration on the WAN Edge router.
General Troubleshooting Flow
Use this high-level workflow to quickly troubleshoot the various components involved with AMP integration with a key objective to establish the demarcation point of the problem between the edge device and the AMP/TG cloud.
- Is the AMP policy pushed correctly to the edge device?
- Check the general health of the UTD container.
- Check the file reputation and analyze client status on the edge.
- Check if the file transfer is diverted to the container. This can be done with the Cisco IOS® XE packet trace.
- Check to confirm the edge successfully communicates with the AMP/TG cloud. This can be done with tools like EPC or packet-trace.
- Ensure UTD creates a local cache based on the AMP response.
These troubleshooting steps are examined in detail in this document.
Policy Push Issues on vManage
As shown with the AMP policy configuration, the AMP policy is rather straightforward without a lot of configuration options. Here are some common things to consider:
- vManage must be able to resolve the DNS names for AMP and ThreatGrid cloud for API access. If the device configuration fails on vManage after the AMP policy is added, check the /var/log/nms/vmanage-server.log for errors.
- As noted in the configuration guide, the Alerts Log Level has left the default critical level, or Warning if warranted. Info-level logging must be avoided as it can have a negative performance impact.
To verify, access the neo4j DB and view the contents of the vmanagedbAPIKEYNODE table.
neo4j@neo4j> match (n:vmanagedbAPIKEYNODE) return n;
+------------------------------------------------------------------------------------------------------------------------------------------------------------------------------------------------------------------------------------------------------------------------------------+
| n                                                                                                                                                                                                                                                                                  |
+------------------------------------------------------------------------------------------------------------------------------------------------------------------------------------------------------------------------------------------------------------------------------------+
| (:vmanagedbAPIKEYNODE {_rid: "0:ApiKeyNode:1621022413389:153", keyServerHostName: "isr.api.threatgrid.com", feature: "Amp", apiKey: "$CRYPT_CLUSTER$IbGLEMGlYMNRy1s9P+WcfA==$dozo7tmRP1+HrvEnXQr4x1VxSViYkKwQ4HBAlhXWOtQ=", deviceID: "CSR-07B6865F-7FE7-BA0D-7240-1BDA16328455"}) |
+------------------------------------------------------------------------------------------------------------------------------------------------------------------------------------------------------------------------------------------------------------------------------------+ |
AMP Integration on Cisco Edge Router
Check UTD Container Health
Use the show utd commands to check the overall UTD container health:
show utd engine standard config
show utd engine standard status
show platform hardware qfp active feature utd config
show platform hardware qfp active feature utd stats
show app-hosting detail appid utd
show sdwan virtual-application utd
Check UTD AMP status
Make sure file inspection is enabled:
branch1-edge1#show sdwan utd dataplane config
 utd-dp config context 0
 context-flag 25427969
 engine Standard
 state enabled
 sn-redirect fail-open
 redirect-type divert
 threat-inspection not-enabled
 defense-mode not-enabled
 domain-filtering not-enabled
 url-filtering not-enabled
 all-interface enabled
 file-inspection enabled
utd-dp config context 1
 context-flag 25559041
 engine Standard
 state enabled
 sn-redirect fail-open
 redirect-type divert
 threat-inspection enabled
 defense-mode IDS
 domain-filtering not-enabled
 url-filtering not-enabled
 all-interface enabled
 file-inspection enabled
Verify connection to the AMP cloud is up:
branch1-edge1#show utd engine standard status file-reputation
File Reputation Status:
        Process: Running
        Last known status: 2021-06-17 16:14:20.357884-0400 [info] AMP module version 1.12.4.999
branch1-edge1#show sdwan utd file reputation
utd-oper-data utd-file-reputation-status version 1.12.4.999
utd-oper-data utd-file-reputation-status status utd-file-repu-stat-connected
utd-oper-data utd-file-reputation-status message "Connected to AMP Cloud!"
Verify connection to the ThreatGrid is up:
branch1-edge1#show utd engine standard status file-analysis
File Analysis Status:
        Process: Running
        Last Upload Status: No upload since process init
branch1-edge1#show sdwan utd file analysis
utd-oper-data utd-file-analysis-status status tg-client-stat-up
utd-oper-data utd-file-analysis-status backoff-interval 0
utd-oper-data utd-file-analysis-status message "TG Process Up"
If the ThreatGrid process does not show a status of Up, an API rekey helps. To trigger an API rekey, navigate to Maintenance -> Security:

Note: An API rekey triggers a template push to the device.
AMP Activity Monitoring on WAN Edge Router
vManage
From vManage, the AMP file activities can be monitored from either the security dashboard or from the Device View.
Security dashboard:
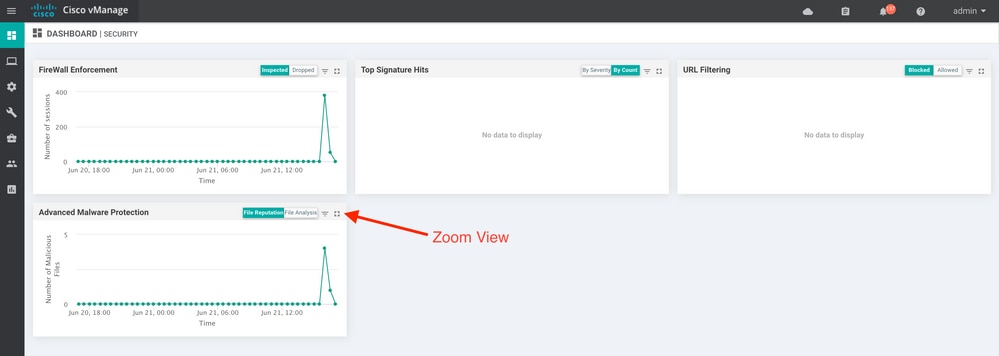
Device View:
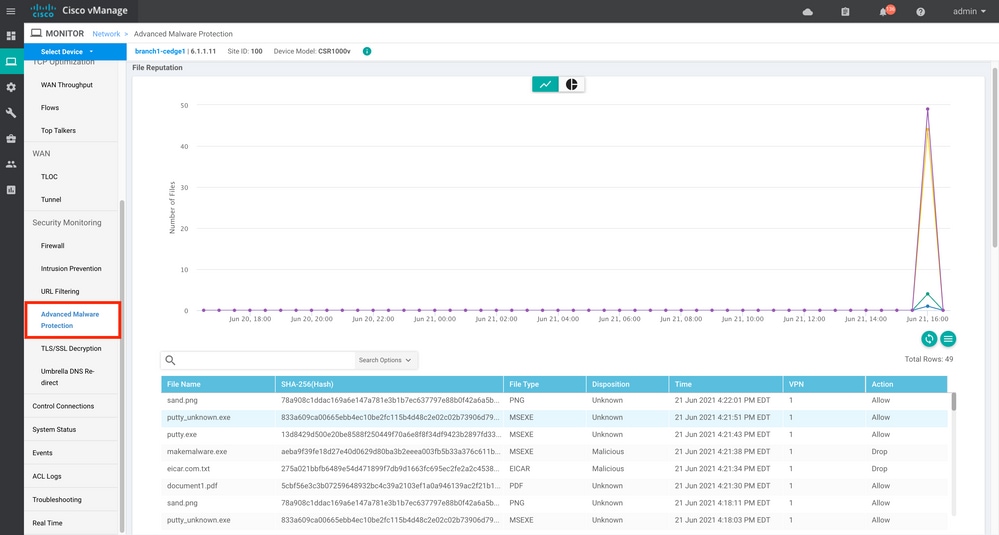
CLI
Check file reputation statistics:
branch1-edge1#show utd engine standard statistics file-reputation
File Reputation Statistics
--------------------------
File Reputation Clean Count:            1
File Reputation Malicious Count:        4
File Reputation Unknown Count:         44
File Reputation Requests Error:         0
File Reputation File Block:             4
File Reputation File Log:              45
Check file analysis statistics:
branch1-edge1#show utd engine standard statistics file-analysis
File Analysis Statistics
------------------------
File Analysis Request Received:         2
File Analysis Success Submissions:      2
File Analysis File Not Interesting:     0
File Analysis File Whitelisted:         0
File Analysis File Not Supported:       0
File Analysis Limit Exceeding:          0
File Analysis Failed Submissions:       0
File Analysis System Errors:            0
Note: additional internal statistics can be obtained with the command show utd engine standard statistics file-reputation vrf global internal.
Dataplane Behavior
Dataplane traffic subject to file inspection based on the configured AMP policy is diverted to the UTD container for processing. This can be confirmed with a packet trace used. If the traffic is not properly diverted to the container then none of the subsequent file inspection actions can happen.
AMP Local File Cache
The UTD container has a local cache of SHA256 hash, file type, disposition, and action based on prior AMP cloud lookup results. The container only requests a disposition from the AMP cloud if the file hash is not in the local cache. The local cache has a TTL of 2 hours before the cache is deleted.
branch1-edge1#show utd engine standard cache file-inspection
Total number of cache entries: 6
File Name|                      SHA256|             File Type|        Disposition|         action|
-----------------------------------------------------------------------------------------------------
sand.png              78A908C1DDAC169A                     69                   1               1
putty.exe             13D8429D500E20BE                     21                   1               2
makemalware.exe       AEBA9F39FE18D27E                     21                   3               2
putty_unknown.exe     833A609CA00665EB                     21                   1               2
document1.pdf         5CBF56E3C3B07259                    285                   1               1
eicar.com.txt         275A021BBFB6489E                    273                   3               2
AMP disposition code:
0 NONE
1 UNKNOWN
2 CLEAN
3 MALICIOUS
AMP action code:
0 UNKNOWN
1 ALLOW
2 DROP
In order to get the complete SHA256 hash for the files, which is very important in order to troublehsoot a specific file verdict issues, use the detail option of the command:
branch1-edge1#show utd engine standard cache file-inspection detail
SHA256: 78A908C1DDAC169A6E147A781E3B1B7EC637797E88B0F42A6A5B59810B8E7EE5
amp verdict: unknown
amp action: 1
amp disposition: 1
reputation score: 0
retrospective disposition: 0
amp malware name:
file verdict: 1
TG status: 0
file name: sand.png
filetype: 69
create_ts: 2021-06-21 16:58:1624309104
sig_state: 3
-----------------------------------------------------------------------------------------
SHA256: 13D8429D500E20BE8588F250449F70A6E8F8F34DF9423B2897FD33BBB8712C5F
amp verdict: unknown
amp action: 2
amp disposition: 1
reputation score: 0
retrospective disposition: 0
amp malware name:
file verdict: 1
TG status: 7
file name: putty.exe
filetype: 21
create_ts: 2021-06-21 16:58:1624309107
sig_state: 3
-----------------------------------------------------------------------------------------
SHA256: AEBA9F39FE18D27E40D0629D80BA3B2EEEA003FB5B33A376C611BB4D8FFD03A6
amp verdict: malicious
amp action: 2
amp disposition: 3
reputation score: 95
retrospective disposition: 0
amp malware name: W32.AEBA9F39FE-95.SBX.TG
file verdict: 1
TG status: 0
file name: makemalware.exe
filetype: 21
create_ts: 2021-06-21 16:58:1624309101
sig_state: 3
<SNIP>
In order to detele the UTD engine local cache entries, use the command:
clear utd engine standard cache file-inspection
Run UTD Debugs
The utd debugs can be enabled to troubleshoot AMP issues:
debug utd engine standard file-reputation level info
debug utd engine standard file-analysis level info
debug utd engine standard climgr level info
The debug output can be retrieved directly from the system shell at /tmp/rp/trace/vman_utd_R0-0.bin, or copy the trace file to the router file system with the steps:
branch1-edge1#app-hosting move appid utd log to bootflash:
Successfully moved tracelog to bootflash:/iox_utd_R0-0_R0-0.5113_0.20210622110241.bin.gz
branch1-edge1#
To view the UTD trace log:
branch1-edge1#more /compressed bootflash:/iox_utd_R0-0_R0-0.5113_0.20210622110241.bin.gz
<snip>
2021-06-22 10:35:04.265:(#1):SPP-FILE-INSPECTION File signature query: sig_state = 3
2021-06-22 10:35:04.266:(#1):SPP-FILE-INSPECTION start_time : 1624372489, current_time : 1624372504,Difference is : 15
2021-06-22 10:35:04.266:(#1):SPP-FILE-INSPECTION amp_cache_node_exists:: Entry
2021-06-22 10:35:04.266:(#1):SPP-FILE-INSPECTION Signature not found in cache
2021-06-22 10:35:04.266:(#1):SPP-FILE-INSPECTION file_type_id = 21
2021-06-22 10:35:04.266:(#1):SPP-FILE-INSPECTION Write to cbuffer
2021-06-22 10:35:04.266:(#1):SPP-FILE-INSPECTION Sent signature lookup query to Beaker
2021-06-22 10:35:04.266:(#1):SPP-FILE-INSPECTION File Name = /putty_unknown.exe, file_name = /putty_unknown.exe
2021-06-22 10:35:04.266:(#1):SPP-FILE-INSPECTION amp_extract_filename :: Extracted filename 'putty_unknown.exe' of length 17 from path: /putty_unknown.exe
2021-06-22 10:35:04.266:(#1):SPP-FILE-INSPECTION amp_cache_add:: Entry
2021-06-22 10:35:04.266:(#1):SPP-FILE-INSPECTION amp_cache_allocate:: Entry
2021-06-22 10:35:04.266:(#1):SPP-FILE-INSPECTION Return FILE_VERDICT_PENDING
<SNIP>
Note: In 20.6.1 and later, the way to retrieve and view the utd tracelogs is in line with the standard trace workflow with the show logging process vman module utd ... command.
Verify Communication from Edge to the Cloud
To verify the edge device comunicates with the AMP/TG cloud, EPC on the WAN Edge Router can be used to confirm there is bidirectional communication to/from the cloud services:
branch1-edge1#show monitor capture amp parameter
monitor capture amp interface GigabitEthernet1 BOTH
monitor capture amp access-list amp-cloud
monitor capture amp buffer size 10
monitor capture amp limit pps 1000
AMP and TG Cloud Related issues
Once it is confirmed the edge device correctly captures the file and sends it to AMP/TG for analysis, but the verdict is incorrect, it requires AMP troubleshooting or Threatgrid cloud, which is outside of the scope of this document. The information is important when integration issues are presented:
- ThreatGrid account Organization
- Timestamp
- Device Analysis ID (for example, CSR-07B6865F-7FE7-BA0D-7240-1BDA16328455), this is the Chassis Number for the WAN Edge Router.
- Complete SHA256 hash for the file in question
Related Information
Revision History
| Revision | Publish Date | Comments |
|---|---|---|
1.0 |
18-Jan-2022 |
Initial Release |
Contributed by Cisco Engineers
- Wen ZhangCisco TAC Engineer
- Vibhor AmrodiaCisco TAC Engineer
- Olivier PelerinCisco TAC Engineer
Contact Cisco
- Open a Support Case

- (Requires a Cisco Service Contract)
 Feedback