Introduction
This document describes how to determine the traffic handled by a specific Snort instance in a Cisco Firepower Threat Defense (FTD) environment.
Prerequisites
Requirements
Cisco recommends that you have knowledge of these products:
Components Used
The information in this document was created from the devices in a specific lab environment. All the devices used in this document started with a cleared (default) configuration. If your network is live, ensure that you understand the potential impact of any command.
1. Using CLI Commands
Using the Command Line Interface (CLI) on your FTD device, you can access detailed information about Snort instances and the traffic they handle.
- This command provides the details about the running Snort processes.
show snort instances
Here is an example for the command output.
> show snort instances
Total number of instances available - 1
+----------+----------+
| INSTANCE |   PID |
+----------+----------+
|    1     |      4765          |         <<< One instance available and its process ID
+----------+----------+
- For more detailed information on the traffic statistics handled by Snort instances, these commands can be used. This displays various statistics, including the number of packets processed, dropped, and the alerts generated by each Snort instance.
show snort statistics
Here is an example for the command output.
> show snort statistics

Packet Counters:
  Passed Packets                                                3791881977
  Blocked Packets                                               707722
  Injected Packets                                               87
  Packets bypassed (Snort Down)                       253403701                    <<<  Packets bypassed
  Packets bypassed (Snort Busy)                        0

Flow Counters:
Fast-Forwarded Flows                                       294816
Blacklisted Flows                                               227

Miscellaneous Counters:
Start-of-Flow events                                          0
End-of-Flow events                                           317032
Denied flow events                                            14230
Frames forwarded to Snort before drop             0
Inject packets dropped                                      0
TCP Ack bypass Packets                                   6412936
TCP Meta-Ack Packets                                     2729907
Portscan Events                                                0
Packet decode optimized                                  21608793
Packet decode legacy                                       6558642
show asp inspect-dp snort
Here is an example for the command output.
> show asp inspect-dp snort
SNORT Inspect Instance Status Info
Id Pid       Cpu-Usage    Conns      Segs/Pkts  Status   tot (usr | sys)
-- ----- ---------------- ---------- ---------- ----------
0  16450   8% (  7%|  0%)   2.2 K      0        READY
1  16453   9% (  8%|  0%)   2.2 K      0        READY
2  16451   6% (  5%|  1%)   2.3 K      0        READY
3  16454   5% (  5%|  0%)   2.2 K      1        READY
4  16456   6% (  6%|  0%)   2.3 K      0        READY
5  16457   6% (  6%|  0%)   2.3 K      0        READY
6  16458   6% (  5%|  0%)   2.2 K      1        READY
7  16459   4% (  4%|  0%)   2.3 K      0        READY
8  16452   9% (  8%|  1%)   2.2 K      0        READY
9  16455 100% (100%|  0%)   2.2 K      5        READY                <<<< High CPU utilization
10 16460   7% (  6%|  0%)   2.2 K      0        READY
-- ----- ---------------- ---------- ---------- ----------
Summary   15% ( 14%|  0%)  24.6 K      7
2. Using Firepower Management Center (FMC)
If you are managing your FTD devices through FMC, you can get detailed insights and reports about traffic and Snort instances through the web interface.
FMC Dashboard: Navigate to the dashboard where you can see an overview of the system status, including Snort instances.
Health Monitoring: In the health monitoring section, you can get detailed statistics about Snort processes, including traffic handled.
Analysis: Navigate to Analysis > Connection Events.
Filters: Use filters to narrow down the data to the specific Snort instance or traffic you are interested in.
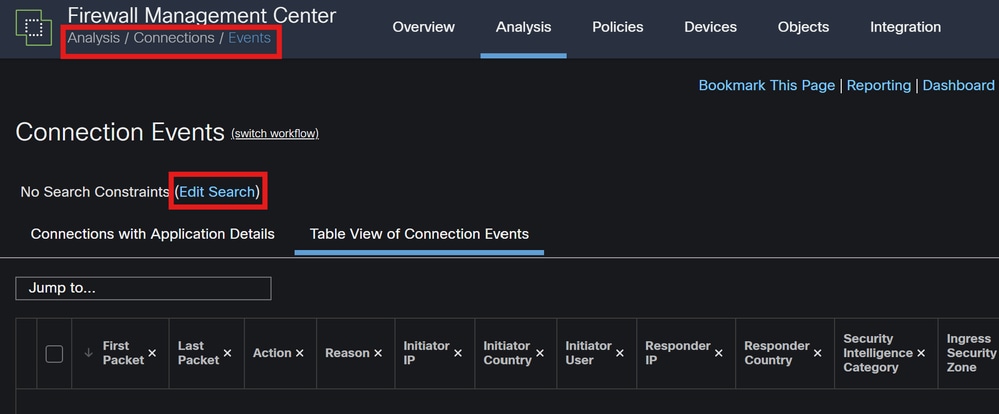
Connection Events
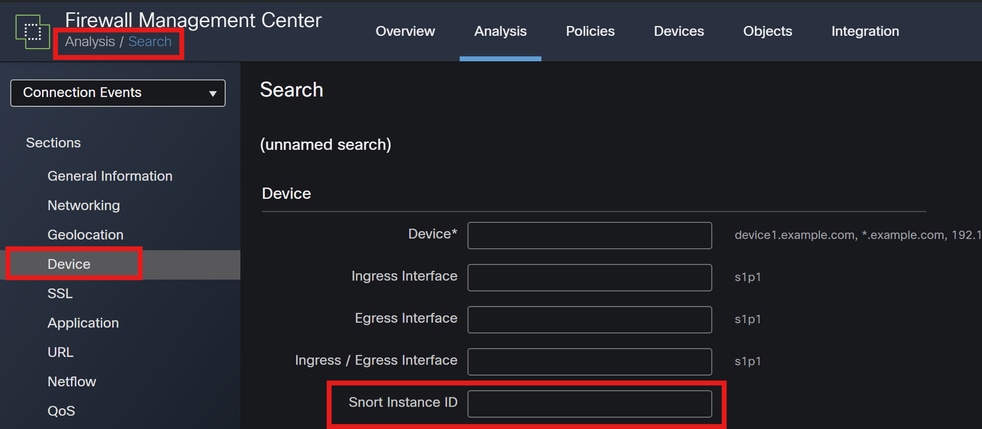
Snort Instance ID
3. Using Syslog and SNMP
You can configure your FTD to send syslog messages or SNMP traps to an external monitoring system where you can analyze the traffic data.
Devices: In FMC, navigate to Devices > Platform Settings.
Create or Edit a Policy: Choose the appropriate platform settings policy.
Syslog: Configure syslog settings to include Snort alerts and statistics.
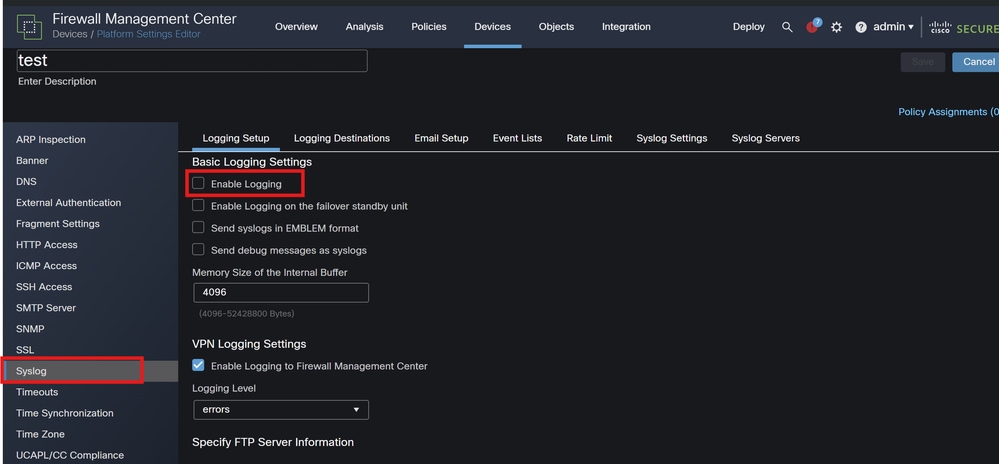
Syslog Configuration
SNMP Settings: Similar to syslog, configure SNMP settings under Devices > Platform Settings.
Traps: Ensure that the necessary SNMP traps are enabled for Snort instance statistics.
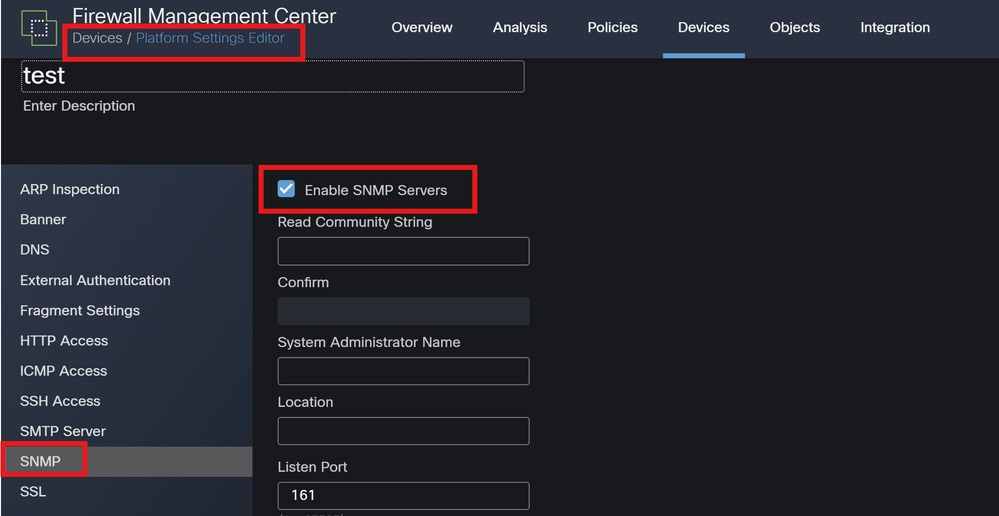
SNMP Configuration
4. Using the Custom Scripts
For advanced users, you can write custom scripts that use the FTD REST API to gather statistics about Snort instances. This approach requires familiarity with scripting and API usage.
API Access: Ensure that API access is enabled on your FMC.
API Calls: Use the appropriate API calls to fetch Snort statistics and traffic data.
This returns JSON data that you can parse and analyze to determine traffic handled by specific Snort instances.
By combining these methods, you can get a comprehensive understanding of the traffic handled by each Snort instance in your Cisco FTD deployment.


 Feedback