Introduction
This document describes the Talos Threat Hunting Telemetry feature in 7.6.
Prerequisites
Requirements
Minimum Software and Hardware Platforms

- Provides capability for Talos to gather intelligence and false-positive testing via special class of rules pushed to the Firepower Devices.
- These events are sent to the cloud via SSX connector, and they are consumed only by Talos.
- A new feature checkbox that includes the threat hunting rules as part of the global policy configuration.
- A new log file (threat_telemetry_snort-unified.log.*) inside the instance-* directory to log the intrusion events generate as part of the threat hunting rules.
- Dump IPS buffers for the threat hunting rules as a new record type in extra data.
- The EventHandler process uses a new consumer to send IPS/Packet/Extradata events to the cloud in fully qualified format, bundled and compressed.
- These events are not displayed in FMC UI
Components Used
This document is not restricted to specific software and hardware versions.
The information in this document was created from the devices in a specific lab environment. All of the devices used in this document started with a cleared (default) configuration. If your network is live, ensure that you understand the potential impact of any command.
Feature Details
FMC UI
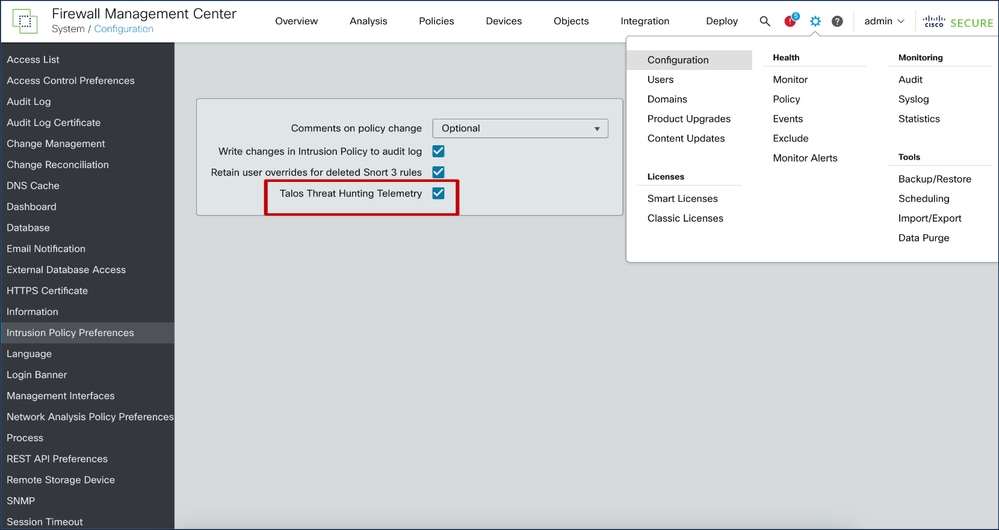
- New feature flag checkbox on System / Configuration / Intrusion Policy Preference page for Talos Threat Hunting Telemetry.
- The feature flag is ON by default, both for new installs on 7.6.0 and for existing customers upgrading to 7.6.0.
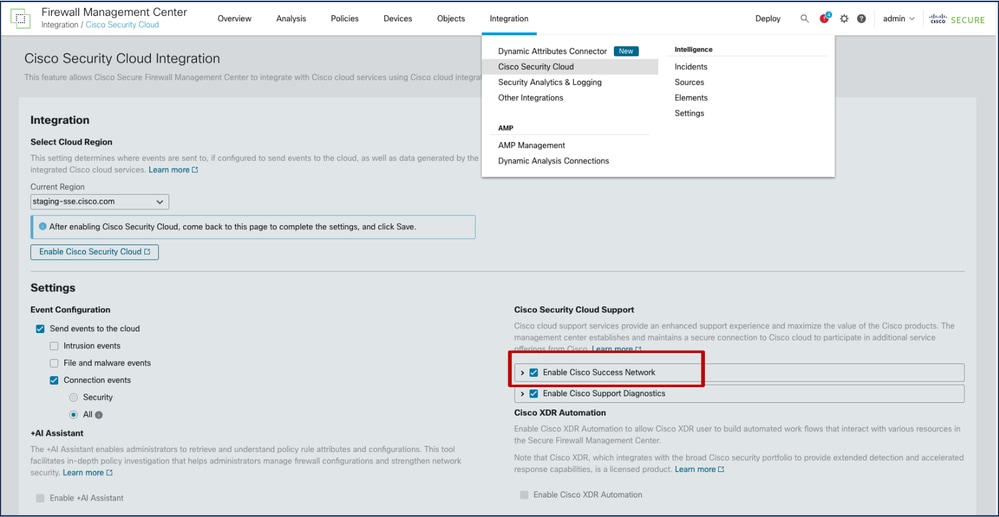
- Feature has dependency on "Enable Cisco Success Network". Both "Enable Cisco Success Network" and "Talos Threat Hunting Telemetry" options must be enabled.
- If both are not enabled, _SSE_ThreatHunting.json consumer does not turn on, and _SSE_ThreatHunting.json is needed to process and push the events to SSE Connector.
- The feature flag value syncs down to all managed devices with versions 7.6.0 or greater.
How it Works
- The feature flag is stored in - /etc/sf/threat_hunting.conf on FMC.
- This feature flag value is also saved as "threat_hunting" in /var/sf/tds/cloud-events.json, which then syncs down to managed devices at /ngfw/var/tmp/tds-cloud-events.json.
- Logs to check if the flag value does not sync down to FTDs:
- /var/log/sf/data_service.log on FMC.
- /ngfw/var/log/sf/data_service.log on FTD.
Snort 3
- Threat Hunting Telemetry (THT) rules are processed the same way as common IPS rules.
- FTD u2unified logger writes threat hunting telemetry IPS events only to threat_telemetry_snort-unified.log.*. Thus, these events are not visible to FTD user. The new file is located in same directory as snort-unified.log.*
- Additionally, threat hunting telemetry events contain a dump of IPS buffers used for rule evaluation.
- Being an IPS rule, threat hunting telemetry rule is a subject for event filtering on Snort side. However, the end user cannot configure event_filter for THT rules, since they are not listed in FMC.
Event Handler
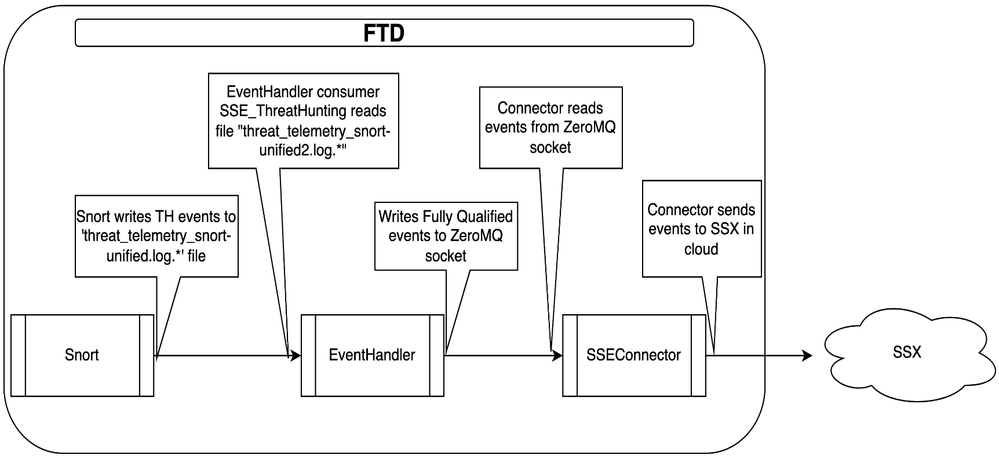
- Snort generates Intrusion, Packet and Extradataevents in the unified file prefix threat_telemetry_snort-unified.log.*.
- EventHandler on device processes these events and send them to cloud via SSX connector.
- New EventHandler consumer for these events:
- /etc/sf/EventHandler/Consumers/SSE_ThreatHunting
- Low priority thread – Only runs when extra CPU is available
How it Works
Troubleshooting
EventHandler Troubleshooting - Device
- Look in /ngfw/var/log/messages for EventHandler logs
Jan 11 21:26:01 firepower SF-IMS[39581]: [10055] EventHandler:EventHandler[INFO] Consumer SSE_ThreatHuntinginitialization complete
- Look in /ngfw/var/log/EventHandlerStats file for event processing details:
{"Time": "2024-01-11T21:26:01Z", "ConsumerStatus": "Start SSE_ThreatHunting", "TID": 10055}
{"Time": "2024-01-11T21:31:56Z", "Consumer": "SSE_ThreatHunting", "Events": 9, "PerSec": 0, "CPUSec": 0.070, "%CPU": 0.0}
{"Time": "2024-01-11T21:31:56Z", "ConsumerEvent": "SSE_ThreatHunting-IntrusionExtraData", "InTransforms": 3, "OutTransforms": 3}
{"Time": "2024-01-11T21:31:56Z", "ConsumerEvent": "SSE_ThreatHunting-IntrusionPacket", "InTransforms": 3, "OutTransforms": 3}
{"Time": "2024-01-11T21:31:56Z", "ConsumerEvent": "SSE_ThreatHunting-IntrusionEvent", "InTransforms": 3, "OutTransforms": 3}
- If EventHandlerStats shows no events, then check if Snort is generating threat hunting events:
ls -l /ngfw/var/sf/detection_engines/*/instance-1 | grep unified
- The events are in the files with the “threat_telemetry_snort-unified.log“ prefix
- Check the files for the desired events by inspecting this output:
u2dump output:u2dump/ngfw/var/sf/detection_engines/*/instance-1/threat_telemetry_snort-unified.log.1704976175 > dump
- If the files do not contain the desired events, then check:
- Whether or not Threat hunting configuration is enable
- Whether or not Snortprocess is running
Snort Configuration Troubleshooting - Device
- Check if Snort configuration enables threat hunting telemetry events:
/ngfw/var/sf/detection_engines/<UUID>/snort3 --plugin-path /ngfw/var/sf/detection_engines/<UUID>/plugins:/ngfw/var/sf/lsp/active-so_rules-c /ngfw/var/sf/detection_engines/<UUID>/snort3.lua --dump-config-text 2>/dev/null | grep "sfunified2_logger.threat_hunting_telemetry_gid"
- Check whether or not threat hunting telemetry rules are present and enabled:
/ngfw/var/sf/detection_engines/<UUID>/snort3 --plugin-path /ngfw/var/sf/detection_engines/<UUID>/plugins:/ngfw/var/sf/lsp/active-so_rules -c /ngfw/var/sf/detection_engines/<UUID>/snort3.lua –lua "process=nil" --dump-rule-state 2>/dev/null | grep "\"gid\": 6,"
- Threat hunting telemetry rules are included in Rule Profiling statistics. So, if the rules consume much CPU time, they are visible in Rule Profiling statistics on FMC page.


 Feedback