Understand Failover Status Messages for FTD
Available Languages
Download Options
Bias-Free Language
The documentation set for this product strives to use bias-free language. For the purposes of this documentation set, bias-free is defined as language that does not imply discrimination based on age, disability, gender, racial identity, ethnic identity, sexual orientation, socioeconomic status, and intersectionality. Exceptions may be present in the documentation due to language that is hardcoded in the user interfaces of the product software, language used based on RFP documentation, or language that is used by a referenced third-party product. Learn more about how Cisco is using Inclusive Language.
Contents
Introduction
This document describes how to comprehend Failover status messages on Secure Firewall Threat Defense (FTD).
Prerequisites
Requirements
Cisco recommends that you have knowledge of these topics:
- High Availability (HA) Setup for Cisco Secure FTD
- Basic Usability of the Cisco Firewall Management Center (FMC)
Components Used
The information in this document is based on these software and hardware versions:
- Cisco FMC v7.2.5
- Cisco Firepower 9300 Series v7.2.5
The information in this document was created from the devices in a specific lab environment. All of the devices used in this document started with a cleared (default) configuration. If your network is live, ensure that you understand the potential impact of any command.
Background Information
Failover Health Monitoring Overview:
The FTD device monitors each unit for overall health and for interface health. The FTD performs tests in order to determine the state of each unit based on Unit Health Monitoring and Interface Monitoring. When a test to determine the state of each unit in the HA pair fails, events of failover are triggered.
Failover Status Messages
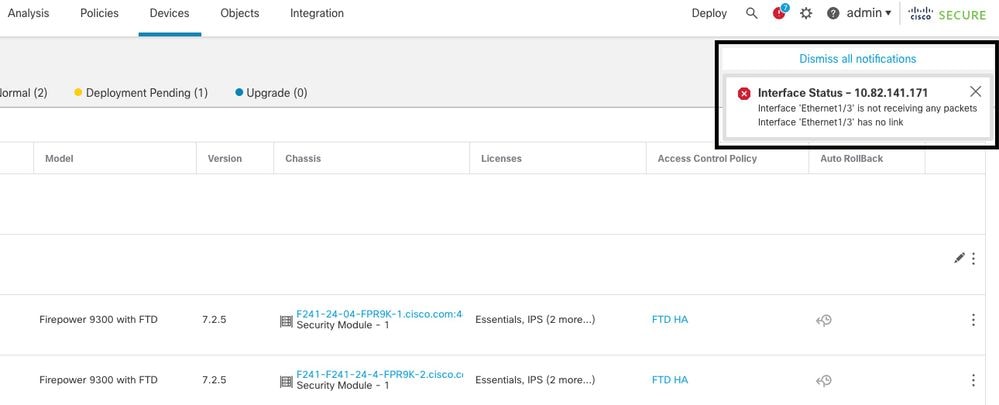
Use Case - Data Link Down with No Failover
When interface monitoring is not enabled on the FTD HA and in case of a data link failure, a failover event is not triggered as the health monitor tests for the interfaces are not performed.
This image describes the alerts of a data link failure but no failover alerts are triggered.
 link down alert
In order to verify the state and status of the data links, use this command:
show failover- Displays the information about the failover status of each unit and interface.
Monitored Interfaces 1 of 1291 maximum
...
This host: Primary - Active
Active time: 3998 (sec)
slot 0: UCSB-B200-M3-U hw/sw rev (0.0/9.18(3)53) status (Up Sys)
Interface DMZ (192.168.10.1): Normal (Waiting)
Interface INSIDE (172.16.10.1): No Link (Not-Monitored)
Interface OUTSIDE (192.168.20.1): Normal (Waiting)
Interface diagnostic (0.0.0.0): Normal (Not-Monitored)
...
Other host: Secondary - Standby Ready
Active time: 0 (sec)
slot 0: UCSB-B200-M3-U hw/sw rev (0.0/9.18(3)53) status (Up Sys)
Interface DMZ (192.168.10.2): Normal (Waiting)
Interface INSIDE (172.16.10.2): Normal (Waiting)
Interface OUTSIDE (192.168.20.2): Normal (Waiting)
Interface diagnostic (0.0.0.0): Normal (Not-Monitored)
When the state of the interface is 'Waiting', it means the interface is up, but has not yet received a hello packet from the corresponding interface on the peer unit.
On the other hand, the state 'No Link (Not-Monitored)' means the physical link for the interface is down but is not monitored by the failover process.
In order to avoid an outage, it is highly recommended to enable the Interface Health Monitor in all sensitive interfaces with their corresponding Standby IP Addresses.
In order to enable Interface Monitoring, navigate toDevice > Device Management > High Availability > Monitored Interfaces.
This image shows the Monitored Interfaces tab:
 monitored interfaces
In order to verify the status of the monitored interfaces and Standby IP addresses, run this command:
show failover- Displays the information about the failover status of each unit and interface.
Monitored Interfaces 3 of 1291 maximum
...
This host: Primary - Active
Active time: 3998 (sec)
slot 0: UCSB-B200-M3-U hw/sw rev (0.0/9.18(3)53) status (Up Sys)
Interface DMZ (192.168.10.1): Normal (Monitored)
Interface INSIDE (172.16.10.1): No Link (Monitored)
Interface OUTSIDE (192.168.20.1): Normal (Monitored)
Interface diagnostic (0.0.0.0): Normal (Waiting)
...
Other host: Secondary - Standby Ready
Active time: 0 (sec)
slot 0: UCSB-B200-M3-U hw/sw rev (0.0/9.18(3)53) status (Up Sys)
Interface DMZ (192.168.10.2): Normal (Monitored)
Interface INSIDE (172.16.10.2): Normal (Monitored)
Interface OUTSIDE (192.168.20.2): Normal (Monitored)
Interface diagnostic (0.0.0.0): Normal (Waiting)
Use Case - Interface Health Failure
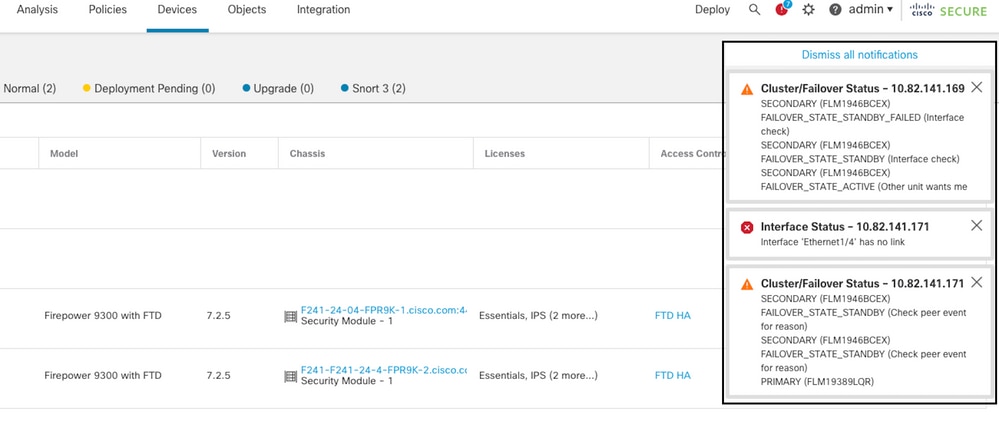
When a unit does not receive hello messages on a monitored interface for 15 seconds and if the interface test fails in one unit but works in the other unit, the interface is considered to have failed.
If the threshold you define for the number of failed interfaces is met and the active unit has more failed interfaces than the standby unit, then a failover occurs.
In order to modify the interface threshold, navigate to Devices > Device Management > High Availability > Failover Trigger Criteria.
This image describes the alerts generated on an interface failure:
 failover event with link down
In order to verify the reason for the failure, use these commands:
show failover state- This command displays the failover state of both units and the last reported reason for failover.
firepower# show failover state

This host - Primary
            Active        Ifc Failure          19:14:54 UTC Sep 26 2023
Other host - Secondary
             Failed       Ifc Failure          19:31:35 UTC Sep 26 2023
                          OUTSIDE: No Link
show failover history- Displays failover history. The failover history displays past failover state changes and the reason for state change.
firepower# show failover history
==========================================================================
From State                        To State             Reason
==========================================================================
19:31:35 UTC Sep 26 2023
Active                             Failed             Interface check
                                                      This host:1
                                                      single_vf: OUTSIDE
                                                      Other host:0
Use Case - High Disk Usage
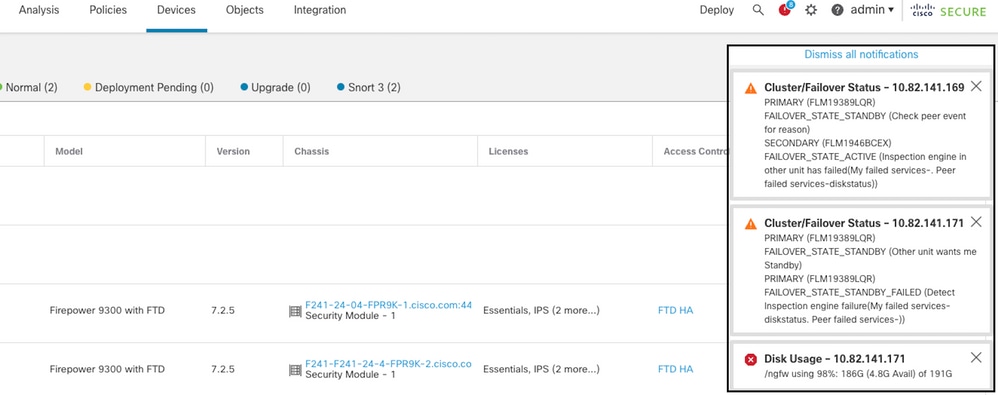
In case the disk space on the active unit is more than 90% full, a failover event is triggered.
This image describes the alerts generated when the disk is full:
 failover with disk usage
In order to verify the reason for the failure, use these commands:
show failover history- Displays failover history. The failover history displays past failover state changes and the reason for the state changes.
firepower# show failover history
==========================================================================
From State                            To State                        Reason
==========================================================================
20:17:11 UTC Sep 26 2023
Active                              Standby Ready                    Other unit wants me Standby
                                                                     Inspection engine in other unit has failed)

20:17:11 UTC Sep 26 2023.           Standby Ready                    Failed Detect Inspection engine failure
Active                                                               due to disk failure
show failover- Displays the information about the failover status of each unit.
firepower# show failover | include host|disk
      This host: Primary - Failed
              slot 2: diskstatus rev (1.0) status (down)
      Other host: Secondary - Active
               slot 2: diskstatus rev (1.0) status (up)
-
df -h- Displays the information about all the mounted file systems which includes total size, used space, usage percentage, and the mount point.
admin@firepower:/ngfw/Volume/home$ df -h /ngfw
Filesystem Size Used Avail Use% Mounted on
/dev/sda6  191G 186G 4.8G  98%  /ngfw
Use Case - Lina Traceback
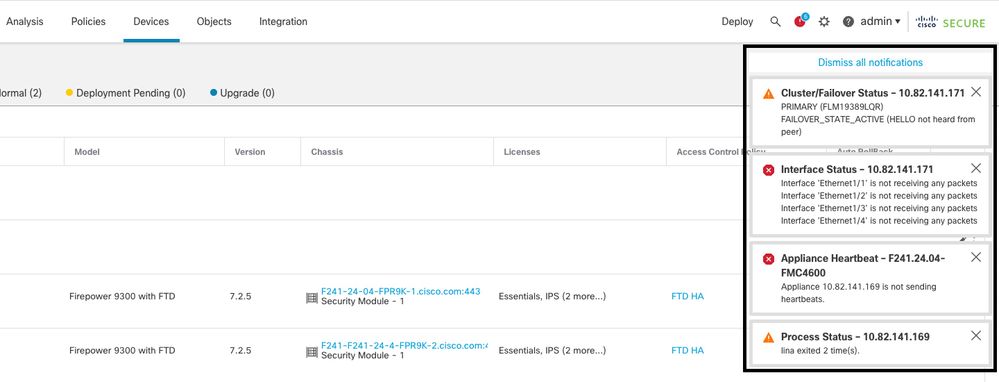
In the case of a lina traceback, a failover event can be triggered.
This image describes the alerts generated in the case of lina traceback:
 failover with lina traceback
In order to verify the reason for the failure, use these commands:
show failover history- Displays failover history. The failover history displays past failover state changes and the reason for the state change.
firepower# show failover history
==========================================================================
From State                      To State                        Reason
==========================================================================
8:36:02 UTC Sep 27 2023
Standby Ready                   Just Active                     HELLO not heard from peer
                                                                (failover link up, no response from peer)
18:36:02 UTC Sep 27 2023
Just Active                     Active Drain                    HELLO not heard from peer
                                                                (failover link up, no response from peer)

18:36:02 UTC Sep 27 2023
Active Drain                    Active Applying Config          HELLO not heard from peer
                                                                (failover link up, no response from peer)

18:36:02 UTC Sep 27 2023
Active Applying Config           Active Config Applied          HELLO not heard from peer
                                                                (failover link up, no response from peer)

18:36:02 UTC Sep 27 2023
Active Config Applied            Active                         HELLO not heard from peer
                                                                (failover link up, no response from peer)
In the case of lina traceback, use these commands to locate the core files:
root@firepower:/opt/cisco/csp/applications# cd /var/data/cores
root@firepower:/var/data/cores# ls -l
total 29016
-rw------- 1 root root 29656250 Sep 27 18:40 core.lina.11.13995.1695839747.gz
In the case of lina traceback, it is highly recommended to collect the troubleshooting files, export the Core files, and contact Cisco TAC.
Use Case - Snort Instance Down
In case more than 50% of the Snort instances on the active unit are down, a failover is triggered.
This image describes the alerts generated when snort fails:
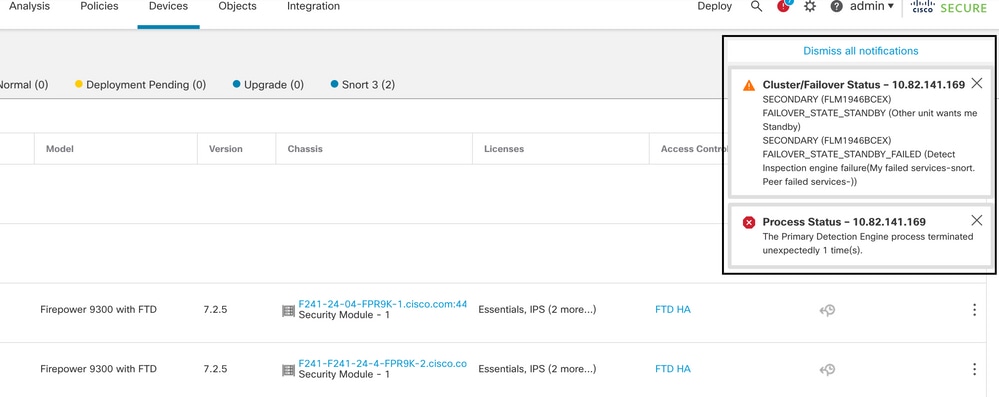 failover with snort traceback
In order to verify the reason for the failure, use these commands:
show failover history- Displays failover history. The failover history displays past failover state changes and the reason for the state change.
firepower# show failover history
==========================================================================
From State                            To State                        Reason
==========================================================================
21:22:03 UTC Sep 26 2023
Standby Ready                     Just Active             Inspection engine in other unit has failed
                                                          due to snort failure

21:22:03 UTC Sep 26 2023
                                  Just Active             Active Drain Inspection engine in other unit has failed
                                                          due to snort failure

21:22:03 UTC Sep 26 2023
                                  Active Drain            Active Applying Config Inspection engine in other unit has failed
                                                          due to snort failure

21:22:03 UTC Sep 26 2023
                                  Active                  Applying Config Active Config Applied Inspection engine in other unit has failed
                                                          due to snort failure
show failover- Displays the information about the failover status of the unit.
firepower# show failover | include host|snort
This host: Secondart - Active
slot 1: snort rev (1.0) status (up)
Other host: Primary - Failed
slot 1: snort rev (1.0) status (down)
Firepower-module1#
In the case of snort traceback, use these commands to locate the crashinfo or core files:
For snort3:
root@firepower# cd /ngfw/var/log/crashinfo/
root@firepower:/ngfw/var/log/crashinfo# ls -l
total 4
-rw-r--r-- 1 root root 1052 Sep 27 17:37 snort3-crashinfo.1695836265.851283

For snort2:
root@firepower# cd/var/data/cores
root@firepower:/var/data/cores# ls -al
total 256912
-rw-r--r-- 1 root root  46087443 Apr  9 13:04 core.snort.24638.1586437471.gz
In the case of snort traceback, it is highly recommended to collect the troubleshooting files, export the Core files, and contact Cisco TAC.
Use Case - Hardware or Power Failure
The FTD device determines the health of the other unit by monitoring the failover link with hello messages. When a unit does not receive three consecutive hello messages on the failover link, and the tests fail on the monitored interfaces, a failover event can be triggered.
This image describes the alerts generated when there is a power failure:
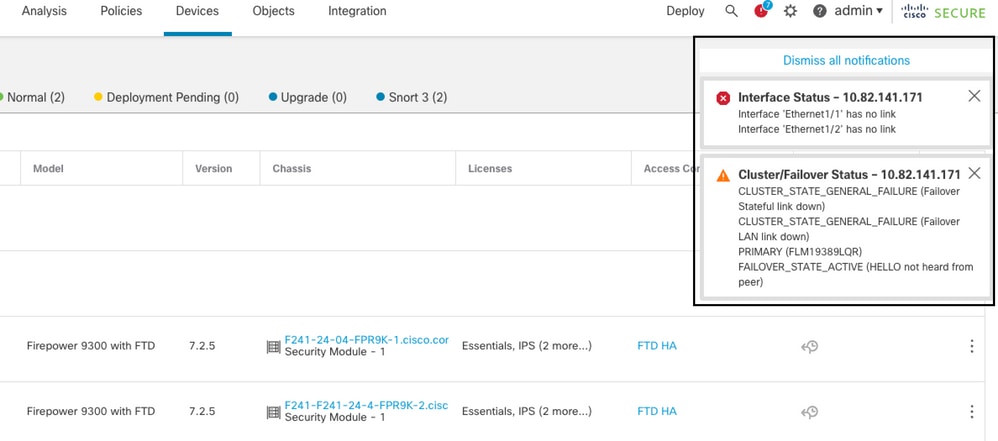 failover with power failure
In order to verify the reason for the failure, use these commands:
show failover history- Displays failover history. The failover history displays past failover state changes and the reason for the state change.
firepower# show failover history
==========================================================================
From State                        To State                  Reason
==========================================================================
22:14:42 UTC Sep 26 2023
Standby Ready                     Just Active                HELLO not heard from peer
                                                             (failover link down)
22:14:42 UTC Sep 26 2023
Just Active                       Active Drain               HELLO not heard from peer
                                                             (failover link down
22:14:42 UTC Sep 26 2023
Active Drain                      Active Applying Config     HELLO not heard from peer
                                                             (failover link down
22:14:42 UTC Sep 26 2023
Active Applying Config            Active Config Applied      HELLO not heard from peer
                                                             (failover link down)
22:14:42 UTC Sep 26 2023
Active Config Applied             Active                     HELLO not heard from peer
                                                             (failover link down)
show failover state- This command displays the failover state of both units and the last reported reason for failover.
firepower# show failover state

              State                 Last Failure Reason     Date/Time
This host  -   Primary
               Active               None
Other host -   Secondary
               Failed               Comm Failure            22:14:42 UTC Sep 26 2023
Use Case - MIO-Hearbeat Failure (Hardware Devices)
The application instance periodically sends hearbeats to the supervisor. When the hearbeat responses are not received, a failover event can be triggered.
In order to verify the reason for the failure, use these commands:
show failover history- Displays failover history. The failover history displays past failover state changes and the reason for the state change.
firepower# show failover history
==========================================================================
From State                        To State                Reason
==========================================================================
02:35:08 UTC Sep 26 2023
Active                            Failed                  MIO-blade heartbeat failure

02:35:12 UTC Sep 26 2023
Failed                            Negotiation             MIO-blade heartbeat recovered
.
.
.
02:37:02 UTC Sep 26 2023
Sync File                         System Bulk Sync        Detected an Active mate

02:37:14 UTC Sep 26 2023
Bulk Sync                         Standby Ready           Detected an Active mate
When MIO-hearbeat fails, it is highly recommended to collect the troubleshooting files, show tech logs from FXOS, and contact Cisco TAC.
For Firepower 4100/9300, collect the show tech-support chassis and show tech-support module.
For FPR1000/2100 and Secure Firewall 3100/4200, collect the show tech-support form.
Related Information
Revision History
| Revision | Publish Date | Comments |
|---|---|---|
1.0 |
10-Oct-2023 |
Initial Release |
Contributed by Cisco Engineers
- Oscar Montoya TorresCisco TAC Engineer
Contact Cisco
- Open a Support Case

- (Requires a Cisco Service Contract)
 Feedback