Introduction
This document describes how to configure the custom widget to depict the traffic rate on the interface of managed devices. The configuration shows a basic example of the traffic rate associated with each interface of all the managed devices.
Prerequisites
Requirements
Cisco recommends that you have knowledge of these topics:
- Knowledge of Firepower Technology
- Knowledge of basic navigation within the Firepower Management Center
Components Used
The information in this document is based on these software and hardware versions:
- Firepower Management Center version 6.1.x and above
- Applicable to managed Threat Defense/Firepower Sensors
The information in this document was created from the devices in a specific lab environment. All of the devices used in this document started with a cleared (default) configuration. If your network is live, make sure that you understand the potential impact of any command.
Configure
Configurations
Step 1. Login to the Firepower Management Center with administrator privileges.
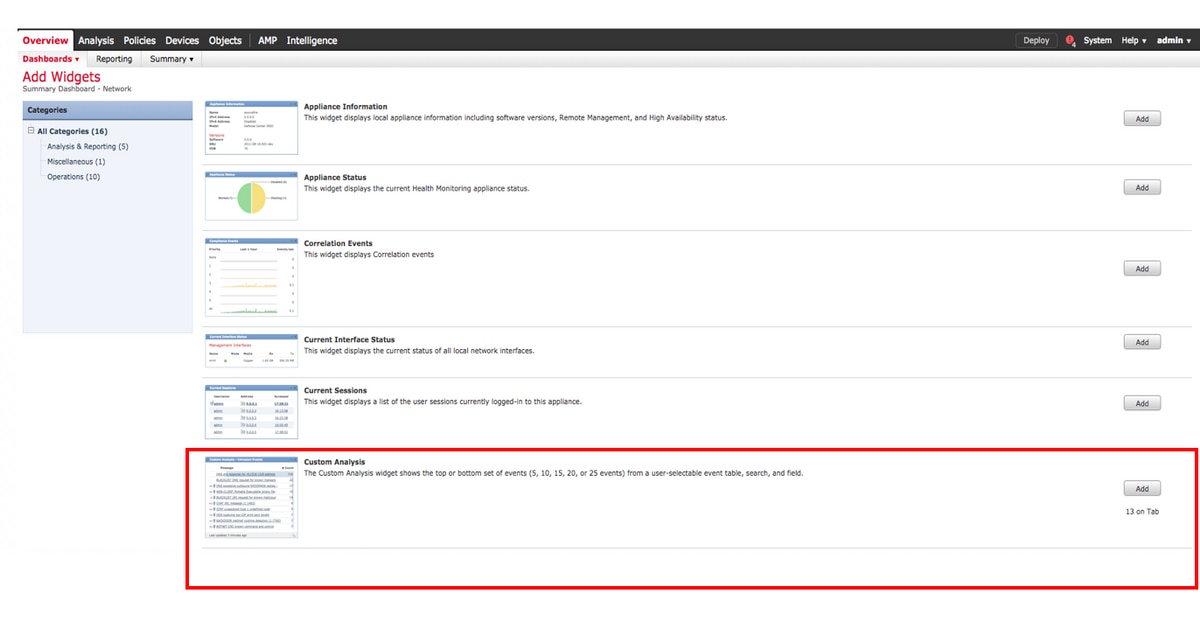
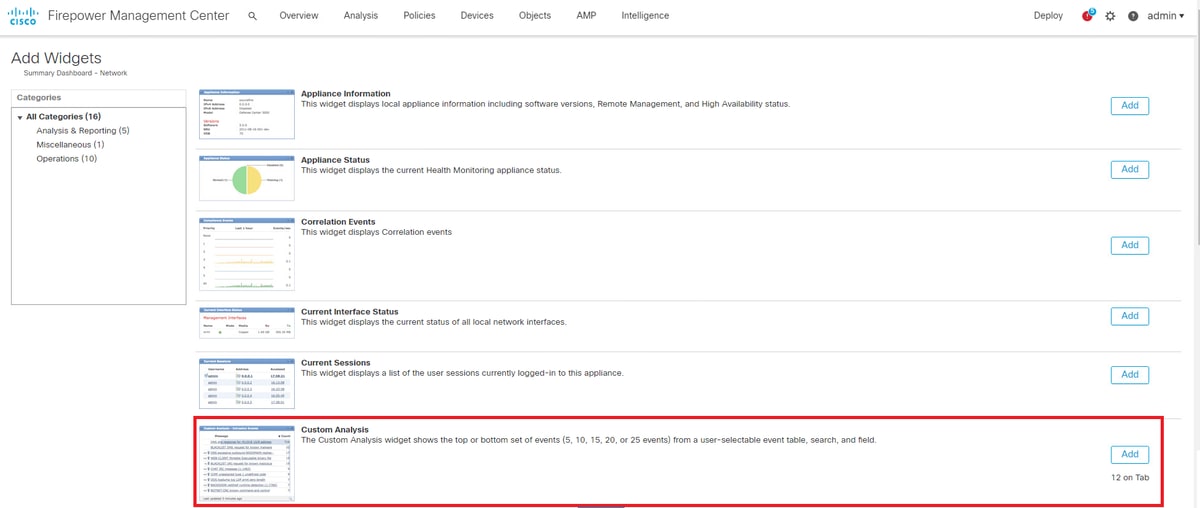
Once the login is successful, navigate to Overview> Dashboard > Add Widgets, as shown in the image
a) Classic view:

b) Light view:

Step 2. Click the Add Widgets and choose the Custom Analysis:
a) Classic view:

b) Light view:

Step 3. Navigate back to the dashboard and configure the widget as shown in the image:
a) Classic view:

b) Light view:

Verify
There is currently no verification procedure available for this configuration.
Troubleshoot
There is currently no specific troubleshooting information available for this configuration.
