Troubleshoot Firepower Threat Defense Policy Deployments
Available Languages
Download Options
Bias-Free Language
The documentation set for this product strives to use bias-free language. For the purposes of this documentation set, bias-free is defined as language that does not imply discrimination based on age, disability, gender, racial identity, ethnic identity, sexual orientation, socioeconomic status, and intersectionality. Exceptions may be present in the documentation due to language that is hardcoded in the user interfaces of the product software, language used based on RFP documentation, or language that is used by a referenced third-party product. Learn more about how Cisco is using Inclusive Language.
Introduction
This document describes a high-level overview of the Policy Deployment process on FTD and as well as basic troubleshooting techniques.
Prerequisites
Requirements
Cisco recommends that you have knowledge of these topics:
Firewall Management Center (FMC)Firepower Threat Defense (FTD)
Components Used
This document is not restricted to specific software and hardware versions.
The information in this document was created from the devices in a specific lab environment. All of the devices used in this document started with a cleared (default) configuration. If your network is live, ensure that you understand the potential impact of any command.
Background Information
With Cisco Firepower Threat Defense (FTD), traditional stateful firewall features offered by Adaptive Security Appliances (ASA) and Next-Gen firewall features (powered by Snort ) are now combined into one product.
Due to this change, Policy Deployment Infrastructure on FTD now handles configuration changes for both ASA code (also referred to as LINA), and Snort in one bundle.
Policy Deployment Overview
Cisco FTD utilizes Policy Deployments to manage and push out configurations for devices that are registered to the Firewall Management Center (FMC) itself.
Inside the deployment, there are a series of steps that are broken into "Phases".
The FMC phases can be summarized in this list.
| Phase 0 | Deployment Initialization |
| Phase 1 | Database Object Collection |
| Phase 2 | Policy and Object Collection |
| Phase 3 | NGFW Command Line Configuration Generation |
| Phase 4 | Device Deployment Package Generation |
| Phase 5 | Send and Receive the Deployment Package |
| Phase 6 | Pending Deployment, Deployment Actions, and Deployment Success Messages |
Knowledge of the phases and of the location of failures in the process can help troubleshoot the failures that a Firepower system faces.
In some situations, it be a conflict due to previous configurations or caused by an Advanced Flex Configuration which lacks a keyword which can cause failures that the device report does not address.
Example Overview
Step 1. Click Deployment, which specifies the device to be selected.
Step 2. When the deployment for a device is committed, the FMC begins to collect all the configurations relevant to the device.
Step 3. When the configurations are collected, the FMC creates the package and sends it to the sensor over its communication mechanism called SFTunnel.
Step 4. The FMC notifies the sensor to start the deployment process with the provided policy while it listens for the individual responses.
Step 5. The managed device unpacks the archive and starts to apply the individual configurations and packages.
A. The first half of the deployment is the Snort configuration where the Snort configuration is tested locally to ensure its validity.
When proved to be valid, the new configuration is moved to the production directory for Snort. If validation fails, the policy deployment fails at this step.
B. The second half of the deployment package load is for the LINA configuration where it is applied directly to the LINA process by the ngfwManager process.
If a failure occurs, the changes are rolled back and a policy deployment failure occurs.
Step 6. If both Snort and LINA packages are successful, the managed device signals Snort to restart or reload in order to load the new configuration and save all current configurations.
Step 7. If all messages are successful, the sensor sends a success message and waits for it to be acknowledged by the Management Center.
Step 8. Once received, the FMC marks the task as a success and allows the policy bundle to finish.
Troubleshooting
Problems encountered during Policy Deployment can be due to, but are not limited to:
- Misconfiguration
- Communication between FMC and FTD
- Database and System health
- Software defects and Caveats
- Other Unique situations
Some of these issues can be easily fixed, while others can require assistance from the Cisco Technical Assistance Center (TAC).
The goal of this section is to provide techniques to isolate the issue or determine the root cause.
FMC Graphical User Interface (GUI)
Cisco recommends each troubleshooting session for deployment failures to start on the FMC appliance.
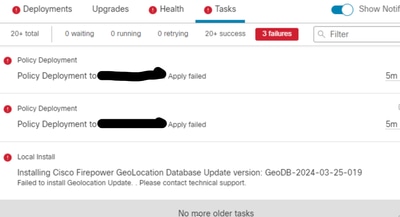
On the failure notification window, on all versions beyond 6.2.3, there are additional tools that can assist with other possible failures.
Utilize the Deployment Transcripts
Step 1. Pull up the Deployments list on the FMC Web UI.
Step 2. While the Deployments tab is selected, click Show History.
Step 3. Inside the Deployment History box, you can see all previous deployments from your FMC. Select the deployment in which you would like to see more data.
Step 4. Once a deployment element is selected, the Deployment Details selection displays a list of all devices inside the Transaction. These entries are broken down into these columns: Device Number, Device Name, Status,and Transcript.
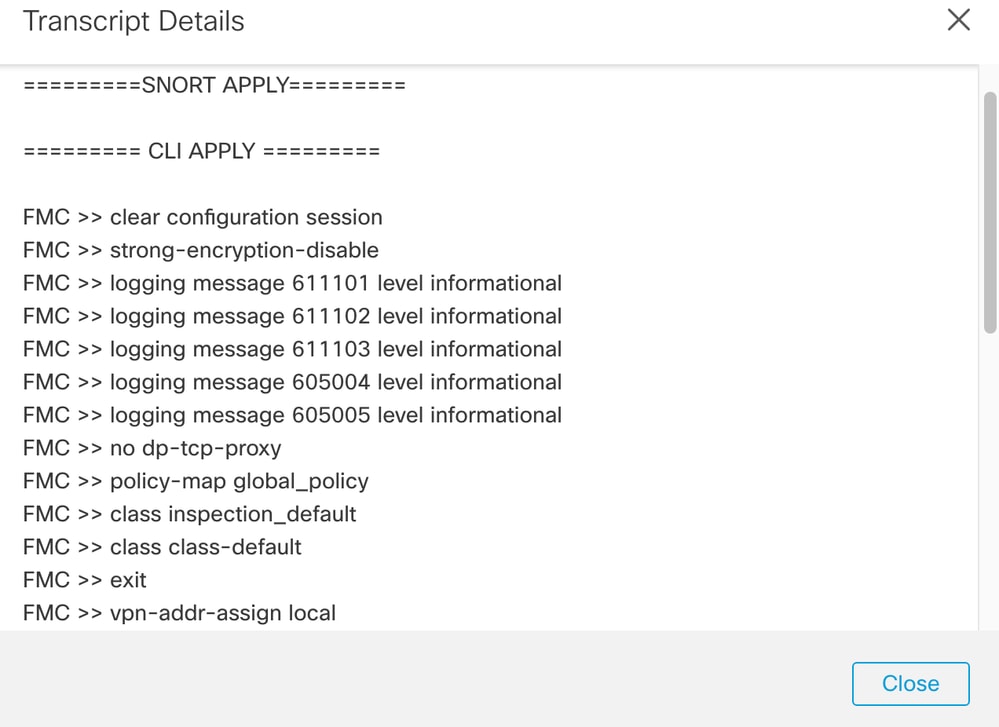
Step 5. Select the device in question and click on the transcript option to see the individual deployment transcript which can inform you of failures as well as configurations that are placed on the managed devices.

Step 6. This transcript can designate certain failure conditions as well as indicate a very important number for the next step: Transaction ID.
Step 7. In a Firepower Deployment, the Transaction ID is what can be used to track each individual section of a policy deployment. With this, on the Command-Line of the Device, you can obtain a more in-depth version of this data for remediation and analysis.
Tip: In the event that you are unable to locate the transaction ID or if you are on a version before this was printed, this log can still be of use to locate individual failure messages.
Troubleshoot with FMC Logs
Though it is appropriate to engage Cisco TAC to analyze the logs, a search through logs can help with initial problem isolation and expedite resolution. There are multiple log files on FMC that reveal the details about the policy deployment process.
The two most commonly referenced logs are policy_deployment.log and usmsharedsvcs.log.
All the mentioned files in this document can be viewed with multiple Linux commands such as more, less and vi. However, it is very important to ensure that only read actions are performed to it. All files require root access to be able to view them.
/var/opt/CSCOpx/MDC/log/operation/usmsharedsvcs.log
This log clearly marks the start of the policy deployment task on FMC and the completion of each phase, which helps to determine the phase where deployment ran into a failure, along with the failure code.
The transactionID value included in the JSON portion of the log can be used to find log entries related to one particular deployment attempt.
10-May-2024 18:05:31.249,[INFO],(JsonRESTServerResource.java:111)
com.cisco.nm.vms.api.rest.DeploymentServerResource, ajp-nio-127.0.0.1-9009-exec-3
** REST Request [ DC ]
** ID : e45c6abd-0fff-4341-bdad-ddd5fee10034
** URL: POST https://localhost6/csm/api/deploy/GetTranscript
{
"data": {},
"deviceUUID": "49243dac-0ba7-11ef-af54-a592d78081a7",
"jobID": 34359753974,
"offset": {
"size": 20,
"start": 0
},
"requestID": "e3be908a0ef711ef9d519da21f9032fa",
"version": "7.2.5"
}
/var/log/sf/policy_deployment.log
While this log file has existed throughout 6.x releases, which start at 6.4, its coverage was expanded.
It now describes the detailed steps taken on FMC to build the deployment packages, therefore it is best used for to analyze failures from Phase 1 - 4.
The start of each phase is marked by a line with INFO start .
May 8 02:00:58 RTP-vFMC-Pod-09 ActionQueueScrape.pl[10413]: > SF::UMPD::CSMData::getPolicyRollbackInfo start (161.32M)
May 8 02:00:58 RTP-vFMC-Pod-09 ActionQueueScrape.pl[10413]: < SF::UMPD::CSMData::getPolicyRollbackInfo end (161.32M, 0.012(sec))
...
Managed Device Troubleshooting
There are additional phases and sections which depend on the device package, High Availability configuration, and the outcome of prior phases for each managed device.
If a deployment issue is isolated to a failure on the managed device, further troubleshooting can be performed on the device with two logs on the device: policy_deployment.log and ngfwManager.log.
/ngfw/var/log/ngfwManager.log
This log file provides detailed steps taken by Config Communication Manager and Config Dispatcher to communicate with FMC, work with the deployment package, and orchestrate the validation and application of Snort and LINA configurations.
These are a few examples of ngfwManager.log that represent the start of major phases:
FTD receives FMC's request for running configuration:

May 30 16:37:10 ccm[4293] Thread-10: INFO  com.cisco.ccm.ConfigCommunicationManager- Passing CD-Message-Request to Config Dispatcher...
May 30 16:37:10 ccm[4293] Thread-10: DEBUG com.cisco.ccm.ConfigCommunicationManager- <?xml version="1.0" encoding="UTF-8"?><cdMessagesList><timeStamp>1559234230012</timeStamp><cdMessage><name>LinaShowCommand</name><messageId>-753133537443151390</messageId><contentType>XML</contentType><msgContent><![CDATA[<?xml version="1.0" encoding="UTF-8"?><message><name>LinaShowCommand</name>...


FTD receives FMC's request to download the deployment package:

May 30 16:37:18 ccm[4293] Thread-9: INFO  com.cisco.ccm.ConfigCommunicationManager- Downloading database (transaction 8589938211, version 1559234236)
May 30 16:37:18 ccm[4293] Thread-9: DEBUG com.cisco.ccm.DownloadManager- handle record: 8589938211, status = PENDING
May 30 16:37:18 ccm[4293] Thread-9: DEBUG com.cisco.ccm.DownloadManager- begin downloading database


FTD begins the deployment of policy changes:

May 30 16:37:21 ccm[4293] Thread-9: INFO  com.cisco.ccm.ConfigCommunicationManager- Starting deployment
May 30 16:37:21 ccm[4293] Thread-11: INFO  com.cisco.ccm.ConfigCommunicationManager- Sending message: DEPLOYMENT_STATUS_CCM to Manager


FTD begins LINA deployment:

May 30 16:37:42 ccm[4293] Thread-19: DEBUG com.cisco.ngfw.configdispatcher.communicators.LinaCommunicatorImpl- Trying to send Start-Config-Sequencerequest to lina


FTD begins finalizing the deployment:

May 30 16:38:48 ccm[4293] Thread-19: DEBUG com.cisco.ngfw.configdispatcher.communicators.LinaCommunicatorImpl- Clustering Message sent out of ConfigDispatcher:
Name:Cluster-App-Conf-Finalize-Request
/ngfw/var/log/sf/policy_deployment.log
This log contains the details of the policy applied to Snort. Though the content of the log is mostly advanced and requires analysis by TAC, it is still possible to trace the process with a few key entries:
Config Dispatcher begins extracting the packaged policies for validation:

Jul 18 17:20:57 firepower policy_apply.pl[25122]: INFO  -> calling SF::UMPD::Plugins::NGFWPolicy::Device::exportDeviceSnapshotToSandbox  (Plugin 230 <- Framework 611 <- Transaction 1085)
Jul 18 17:20:57 firepower policy_apply.pl[25122]: INFO  found NGFWPolicy =>   (NGFWPolicy::Util 32 <- NGFWPolicy::Device 43 <- Plugin 235)
...
Jul 18 17:20:57 firepower policy_apply.pl[25122]: INFO export FTD platform settings... (PlatformSettings::FTD::Device 29 <- Plugin 235<339 <- PlatformSettings::Device 13)


Config validation begins:

Jul 18 17:21:37 firepower policy_apply.pl[25122]: INFO  starting validateExportedFiles - sqlite = /var/cisco/deploy/sandbox/policy_deployment.db, sandbox = /var/cisco/deploy/sandbox/exported-files (memory = 229.99 MB)  (Framework 3950<687 <- Transaction 1101 <- main 194)


Validation has completed successfully:

Jul 18 17:21:49 firepower policy_apply.pl[25122]: INFO validateExportedFiles - sqlite = /var/cisco/deploy/sandbox/policy_deployment.db, sandbox = /var/cisco/deploy/sandbox/exported-files took 12 (memory = 238.50 MB, change = 8.51 MB) (Framework 3976<724 <- Transaction 1101 <- main 194)


Config Dispatcher begins moving the validated configuration to the Snort directories in production:

Jul 18 17:21:54 firepower policy_apply.pl[26571]: INFO  -> calling SF::UMPD::Plugins::NGFWPolicy::Device::publishExportedFiles  (Plugin 230 <- Framework 822 <- Transaction 1662)


Snort processes will reload to apply the new configurations:

Jul 18 17:22:02 firepower policy_apply.pl[26571]: INFO  Reconfiguring DE a3bcd340-992f-11e9-a1f1-ac829f31a4f9...  (Snort::SnortNotifications 292<154 <- Snort::Device 343 <- Plugin 235)
Jul 18 17:22:02 firepower policy_apply.pl[26571]: INFO  sending SnortReload to a3bcd340-992f-11e9-a1f1-ac829f31a4f9  (Snort::SnortNotifications 298<154 <- Snort::Device 343 <- Plugin 235)


Snort reload has completed successfully:

Jul 18 17:22:14 firepower policy_apply.pl[26571]: INFO notifyProcesses - sandbox = /var/cisco/deploy/sandbox/exported-files took 16 (memory = 169.52 MB, change = 16.95 MB) (Framework 3976<964 <- Transaction 1680 <- main 200)


After LINA config apply finishes, Snort deployment is finalized:

Jul 18 17:23:32 firepower policy_apply.pl[26913]: INFO  starting finalizeDeviceDeployment - sandbox = /var/cisco/deploy/sandbox (memory = 101.14 MB)  (Framework 3950<980 <- Transaction 1740 <- main 206)
Example
Step 1. A deployment fails

Step 2. Obtain the Deploy Transcript and Transaction ID.

Step 3. SSH into your Management Center and utilize the Linux utility less to read the file as shown on your FMC:
Example: sudo less /var/opt/CSCOpx/MDC/log/operation/usmsharedsvcs.log (The sudo password is your user password for ssh.)

Step 4. When you are in less, use forward slash and enter in the message ID to search for the logs related to the deployment transactionID.
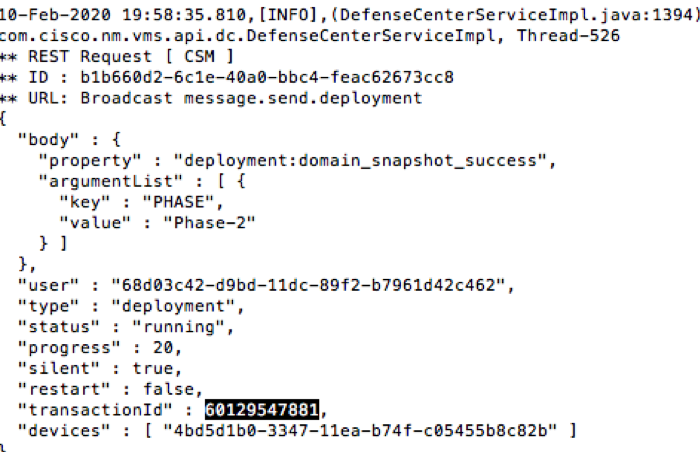
Example: /60129547881 (While inless, use n to navigate to the next result.)
Example of Running Message

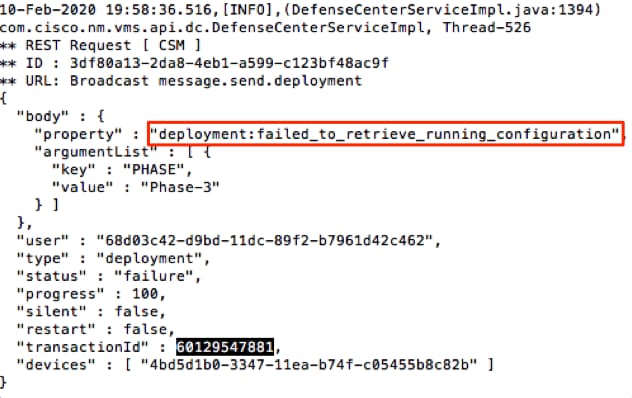
Example of Failure Message

5) Compare the proper failure to the attached table of Common Failure Messages.
That is, failed_to_retrieve_running_configuration occurs during communication failures between the two devices.
Common Failure Messages
These are common failure messages that can be seen on the front end of the Management Center Task as well as the error code which can be seen in the backend.
These messages can be analyzed and compared with the common reasons for possible resolutions.
In the event that these are not seen, or do not resolve your situation, please contact TAC for assistance.
----------------------------------------------------------------------------------------
|
Error code |
Error messages |
Reason |
|
|
Deployment failure - The device has changed domain from {SRCDOMAIN} to {DESTINATIONDOMAIN}. Try again later. |
This error typically occurs when a device has moved or is taken from a second domain. A re-deploy while no cross-domain information occurs usually amends this issue. |
|
|
Deployment failed due to another deployment in progress for this device. Try again later. |
This is typically reported when deployment is triggered on a device in deployment. In some versions, this is prevented without a failure notification; however, this phase still exists for troubleshooting assistance. |
|
|
Deployment cannot be performed on an individual device that is a member of a cluster. Try to deploy the cluster again later. |
This message is applicable for FTD on devices with the Firepower eXtensible Operative System (FXOS) Chassis Manager. If the cluster is built on FXOS, but not on the FMC, this message is shown. Please create the cluster on the Management Center appliance before you attempt to deploy. |
|
|
Policies for one or more devices have been altered since {TIMESTAMP}. Retry deployment. |
This error is shown If any policy/object is altered for any device in the deployment job after user triggers deploy and before CSM elements and domain snapshots are created. A redeploy fixes this issue. This can occur when many users use the same FMC to edit and save objects while they deploy. |
|
|
Policy {Policy Name} has been altered since {Timestamp}. Retry deployment. |
This error is shown If any policy/object is altered for the concerned device in the deployment job, after user triggers deploy and before CSM and domain snapshots are created. A redeploy fixes this issue. |
|
|
Deployment failed due to failure of collection of policies and objects. If problem persists after a repeated attempt contact Cisco TAC. |
If a recent Policy Import is provided, wait an hour or so and attempt another deploy. |
|
|
Deployment failed due to timeout to collect policies and objects. If problem persists after another attempt, contact Cisco TAC. |
The domain snapshot has a timeout of 5 minutes by default. If the system is under high load, or the hypervisor malfunctions, this can cause unnatural delays in the call. This can occur if the Management Center or device is not provided the proper amount of memory resources as well. If this happens without load, or does not proceed at a later time, contact TAC. |
|
|
Deployment failed in policy and object collection. If problem persists after another attempt, contact Cisco TAC. |
Contact TAC. Advanced troubleshooting is required. |
|
|
Deployment failed due to failure to retrieve run configuration information from device. Retry deployment. |
This message can occur when connectivity between an end sensor and an FMC does not function as expected. Verify the tunnel health between the units and monitor the connectivity between the two devices. |
|
|
Deployment failed as device can be running a previous deployment or a restart. If problem persists after another attempt, contact Cisco TAC. |
This message is shown, when FMC attempts a deploy, while a previous deployment is in progress on FTD. Typically happens when a previous deployment is unfinished on FTD and the FTD rebooted or the ngfwManager process on FTD restarted. A retry after 20 minutes to allow processes to formally timeout must resolve this issue. If after a delay or if the delay is not acceptable, contact TAC. |
|
|
Deployment failed due to connectivity issues with the device or device does not respond. If problem persists after another attempt, contact Cisco TAC. |
FMC issues certain LINA show commands to fetch the running configuration for configuration generation. This can happen when there are connectivity problems or issues with the ngfwManager process on the end sensor. In the event that you are not facing connectivity issues between your units, contact TAC. |
|
|
Deployment failed due to communications failure with device. If problem persists after another attempt, contact Cisco TAC. |
Usually occurs with high network latency between the devices to cause a policy timeout. Verify the network latency between devices to verify it matches the minimums for the version mentioned in the user guide. |
|
|
Deployment failed as cluster configuration synchronization is in progress. Retry deployment. |
This is applicable only for FTD cluster setups. If a deployment is attempted on an FTD cluster while app sync(configuration sync) is in progress, the same is rejected by FTD. A retry after configuration sync must solve this issue. The current cluster status can be tracked with this command in the managed device CLISH: > show cluster info |
|
asa_configuration_generation_errors |
Deployment failed to generate device configuration. If problem persists after another attempt, contact Cisco TAC. |
After review of the USMS Logs mentioned earlier, you can be able to see which configuration is causes the error. These are usually bugs in which the logs can be browsed through the Cisco Bug Tool or contact Cisco TAC to troubleshoot further. |
|
|
Deployment failed because interfaces on device are out of date. Save the configuration on the interfaces page and retry. |
This occurs on 4100 or 9300 models if the interface is unassociated from the device during or right before a deploy. Verify that the interface is fully associated or unassociated before you attempt the deployment. |
|
|
Deployment failed to generate configuration for device. If problem persists after another attempt, contact Cisco TAC. |
This error indicates failure to generate the device configuration for the device. Contact TAC. |
|
|
Deployment failed due to timeout during configuration generation. If problem persists after another attempt, contact Cisco TAC. |
This can happen if latency exists between the devices beyond the normal ranges. Contact TAC if after the latency is normalized, this issue still occurs. |
|
|
Deployment failed due to failure with device communication. Check network connectivity and retry deployment. |
This message is the fallback for any communication issues between the devices. Due to its vague nature, it is written as the fallback to state that an unknown connectivity error has occurred. |
|
|
Policy deployment failure. Retry deployment. |
Another attempt must solve this issue. This can occur when the FMC is unable to start the deployment due to a temporary lock on the database. |
|
|
Deployment to device failed due to timeout. Retry deployment. |
This is related to FTD deployment. Processes on FTD wait 30 minutes for the dispatch to complete deployment. If not, it times out. If this occurs, verify inter-device connectivity and if the connectivity is as expected, Contact TAC. |
|
|
Deployment failed due to configuration download timeout to device. If problem persists after another attempt, contact Cisco TAC. |
This is related to FTD deployment. The FTD is unable to download all device configuration files during deploy due to connectivity issues. Please retry after network connectivity has been verified. If this has been verified, contact TAC. |
|
|
Deployment failed due to configuration error. If problem persists after another attempt, contact Cisco TAC. |
Any errors in the configuration generated by FMC for the device must result in this error post apply. This needs to be analyzed in the USMS logs to verify what issues are seen and attempt to roll them back. Once repaired, this usually requires TAC intervention and bug creation if the logs cannot be matched with a known defect at the Cisco Bug Search Tool. |
|
|
Deployment failed due to communication timeout with device. If problem persists after another attempt, contact Cisco TAC. |
This timeout occurs if the FMC has not heard back from a device after ≤ 45 minutes. This is a communication error. Verify communication and if verified, contact TAC. |
|
|
Deployment to cluster failed as primary unit has changed. Retry deployment. |
For an FTD cluster setup deployment, if the primary node switches when deployment is in progress on the device (post notification), this error is indicated. Retry once the primary node is stable. The current cluster member status can be tracked with this command in the managed device CLISH: > show cluster info |
|
|
Deployment to cluster failed due to primary unit identification failure. Retry deployment. |
FMC has been unable to determine the current primary node during deploy. Typically, this is due to these possibilities: either connectivity issues or current primary are not added to the cluster on FMC. It must get resolved after connectivity is reestablished or after addition of the current primary to the FMC cluster and a retry is done. The current cluster status can be tracked with this command in the managed device CLISH: > show cluster info |
|
|
Deployment failed as cluster configuration synchronization is in progress. Retry deployment. |
This can occur if the device is in App Sync. Once App Sync is complete, please retry deployment once more. |
|
|
Deployment failed due to conflict with concurrent previous deployment. If problem persists after another attempt, contact Cisco TAC. |
This can occur if a deployment is concurrent on one side, but not the other. These are usually caused by communication issues between the devices. If after the timeout occurs, and you are still unable to deploy, contact TAC. |
Related Information
Revision History
| Revision | Publish Date | Comments |
|---|---|---|
3.0 |
13-May-2024
|
Recertification |
2.0 |
23-Sep-2022
|
Initial Release |
1.0 |
17-Feb-2020
|
Initial Release |
Contributed by Cisco Engineers
- Jeff JacksonCisco Technical Consulting Engineer
Contact Cisco
- Open a Support Case

- (Requires a Cisco Service Contract)
 Feedback