Firepower Data Path Troubleshooting Phase 1: Packet Ingress
Available Languages
Download Options
Bias-Free Language
The documentation set for this product strives to use bias-free language. For the purposes of this documentation set, bias-free is defined as language that does not imply discrimination based on age, disability, gender, racial identity, ethnic identity, sexual orientation, socioeconomic status, and intersectionality. Exceptions may be present in the documentation due to language that is hardcoded in the user interfaces of the product software, language used based on RFP documentation, or language that is used by a referenced third-party product. Learn more about how Cisco is using Inclusive Language.
Contents
Introduction
This article is part of a series of articles which explain how to systematically troubleshoot the data path on Firepower systems to determine whether components of Firepower may be affecting traffic. Please refer to the Overview article for information about the architecture of Firepower platforms and links to the other Data Path Troubleshooting articles.
In this article, we will look at the first stage of the Firepower data path troubleshooting, the Packet Ingress stage.

Platform Guide
The following table describes the platforms covered by this article.
| Platform Code Name | Description | Applicable Hardware Platforms | Notes |
| SFR | ASA with FirePOWER Services (SFR) module installed. | ASA-5500-X series | N/A |
| FTD (non-SSP and FPR-2100) | Firepower Threat Defense (FTD) image installed on an Adaptive Security Appliance (ASA) or a Virtual Platform | ASA-5500-X series, virtual NGFW platforms | N/A |
| FTD (SSP) | FTD installed as a logical device on a Firepower eXtensible Operative System (FXOS) based chassis | FPR-9300, FPR-4100, FPR-2100 | The 2100 series does not use the FXOS Chassis Manager |
Troubleshooting the Packet Ingress Phase
The first data path troubleshooting step is to make sure that there are no drops occurring at the ingress or egress stage of packet processing. If a packet is ingressing but not egressing, then you can be sure that the packet is being dropped by the device at some place within the data-path or that the device is unable to create the egress packet (for example, a missing ARP entry).
Identify the Traffic in Question
The first step in troubleshooting the packet ingress stage is to isolate the flow and the interfaces involved in the problem traffic. This includes:
| Flow Information | Interface Information |
|
Protocol Source IP Address Source Port Destination IP Destination Port |
Ingress Interface Egress Interface |
For example:
TCP inside 172.16.100.101:38974 outside 192.168.1.10:80
Tip: You may not be able to identify the exact source port since it is often different in each flow, but the destination (server) port should suffice.
Check for Connection Events
After getting an idea of the ingress and egress interface the traffic should be matching as well as the flow information, the first step to identify whether Firepower is blocking the flow is to check the Connection Events for the traffic in question. These can be viewed in the Firepower Management Center under Analysis > Connections > Events
Note: Prior to checking Connection Events, ensure that logging is enabled in your Access Control Policy rules. Logging is configured in the "Logging" tab within each Access Control Policy rule as well as the Security Intelligence tab. Make sure the suspect rules are configured to send the logs to the "Event Viewer".
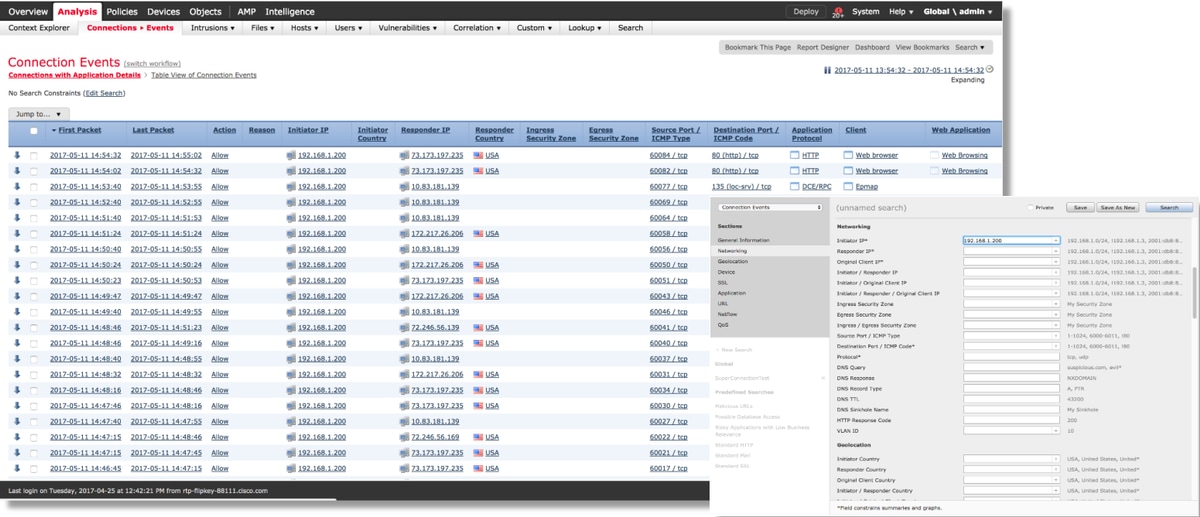
In the example above, "Edit Search" is clicked and a unique source (Initiator) IP is added as a filter to see the flows which were being detected by Firepower. The Action column shows "Allow" for this host traffic.
If Firepower is intentionally blocking traffic, the Action contains the word "Block". Clicking on "Table View of Connection Events" provides more data. The following fields in the Connection Events can be noted if the action is "Block":
- Reason
- Access Control Rule
This, combined with the other fields in the event in question, can help to narrow down which component is blocking the traffic.
For more information about troubleshooting Access Control Rules, you can click here.
Capturing Packets on the Ingress and Egress Interfaces
If there are no events or the Firepower is still suspected of blocking despite the Connection Events displaying a rule action of "Allow" or "Trust", the data path troubleshooting continues.
Here are instructions on how to run an ingress and egress packet capture on the various platforms mentioned above:
SFR - Capture on the ASA Interfaces
Since the SFR module is simply a module running on the ASA Firewall, it is best to first capture on the ingress and egress interfaces of the ASA to make sure that the same packets which ingress are also egressing.
This article contains instructions on how to perform the captures on the ASA.
If it has been determined that the packets which are ingressing the ASA are not egressing, continue to the next phase in troubleshooting (the DAQ phase).
Note: If packets are seen on the ASA ingress interface, it may be worth checking the connected devices.
FTD (non-SSP and FPR-2100) - Capture on the Ingress and Egress Interfaces
Capturing on a non-SSP FTD device is similar to capturing on the ASA. However, you can run the capture commands directly from the CLI initial prompt. When troubleshooting dropped packets it is advised to add the "trace" option to the capture.
Here is an example of configuring an ingress capture for TCP traffic on port 22:

If you add the "trace" option, you can then select an individual packet to trace through the system to see how it came to the final verdict. It also helps to make sure that the proper modifications are done to the packet such as Network Address Translation (NAT) IP modification and that the proper egress interface has been chosen.
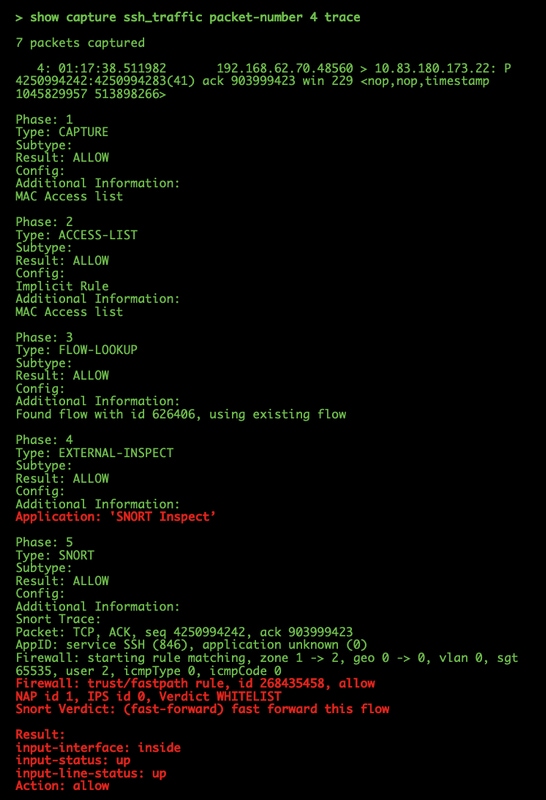
In the example above, we see that the traffic make it to Snort inspection and that it finally reached an allow verdict and overall was passed through the device. Since the traffic can be seen in both directions you can be sure traffic is flowing through the device for this session, so an egress capture may not be needed, but you can take one there as well to make sure the traffic is egressing properly as shown in the trace output.
Note: If the device is unable to create the egress packet, the trace action is still "allow" but the packet is not created or seen on the egress interface capture. This is a very common scenario where the FTD doesn't have an ARP entry for the next hop or destination IP (if this last one is directly connected).
FTD (SSP) - Capture on the Logical FTD Interfaces
The same steps to generate a packet capture on FTD as mentioned above can be followed on an SSP platform. You can connect using SSH into the IP address of the FTD logical interface and enter the following command:
Firepower-module1> connect ftd
>
You can also navigate to the FTD logical device shell from the FXOS command prompt with the following commands:
# connect module 1 console
Firepower-module1> connect ftd
>
If a Firepower 9300 is used, the module number can vary depending on which Security Module is being used. These modules can support up to 3 logical devices.
If multi-instances are being used, the instance ID must be included on the "connect" command. Telnet command can be used to connect to different instances at the same time.
# connect module 1 telnet
Firepower-module1>connect ftd ftd1
Connecting to container ftd(ftd1) console... enter "exit" to return to Boot CLI
>
Check for Interface Errors
Interface level issues can also be checked during this phase. This is especially helpful if packets are missing in the ingress interface capture. If interface errors are seen, checking the connected devices can be helpful.
SFR - Check ASA Interfaces
Since the FirePOWER (SFR) module is basically a virtual machine running on an ASA, the actual ASA interfaces are checked for errors. For detailed information on checking the interface statistics on the ASA, see this ASA Series Command Reference guide section.
FTD (non-SSP and FPR-2100) - Check for Interface Errors
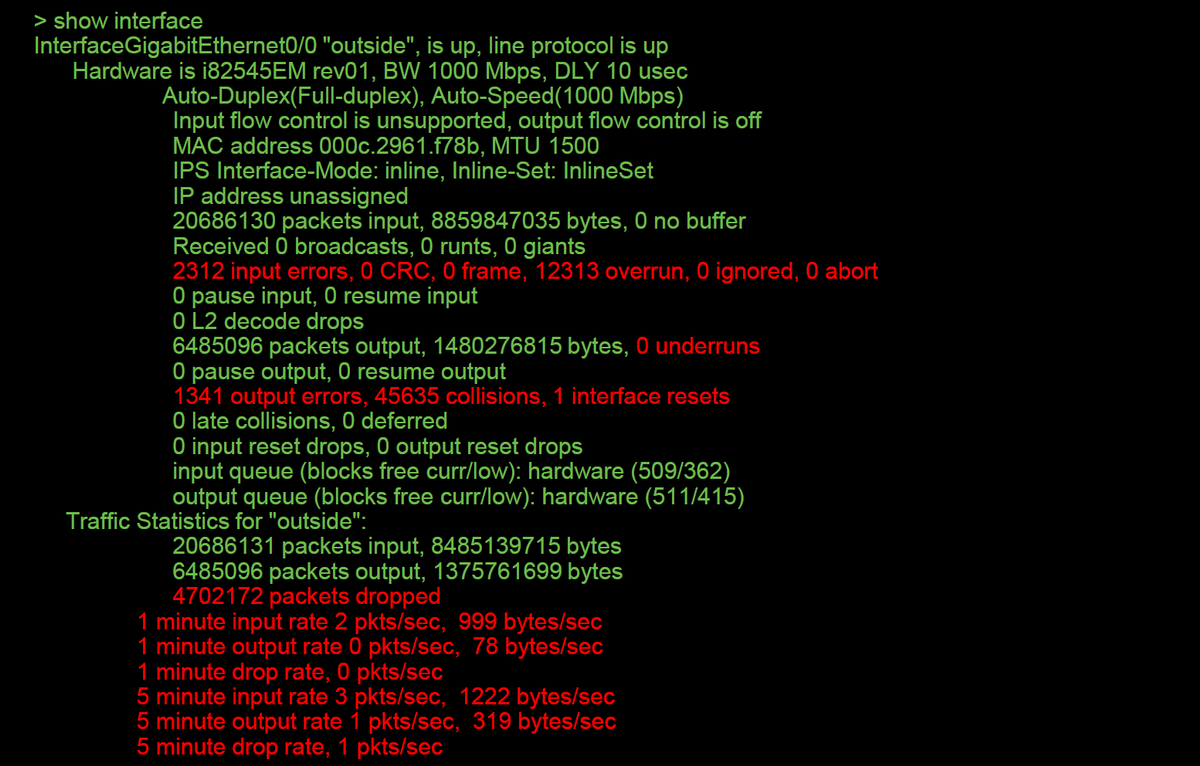
On non-SSP FTD devices, the > show interface command can be run from the initial command prompt. The interesting output is highlighted in red.
FTD (SSP) - Navigating the Data Path to Look for Interface Errors
The 9300 and 4100 SSP platforms have an internal fabric interconnect which first handles the packets.
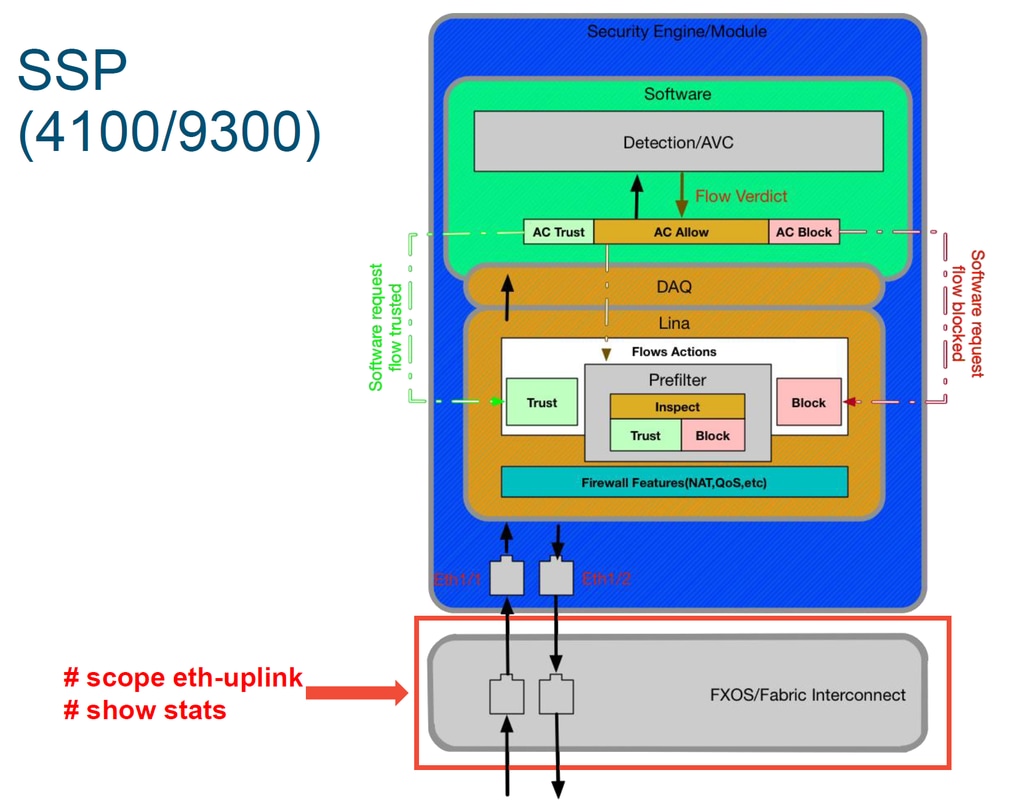
It is worth to check if there are any interface issues at the initial packet ingress. These are the commands to run on the FXOS system CLI in order to get this information.
ssp# scope eth-uplink
ssp /et-uplink # show stats
This is a sample output.
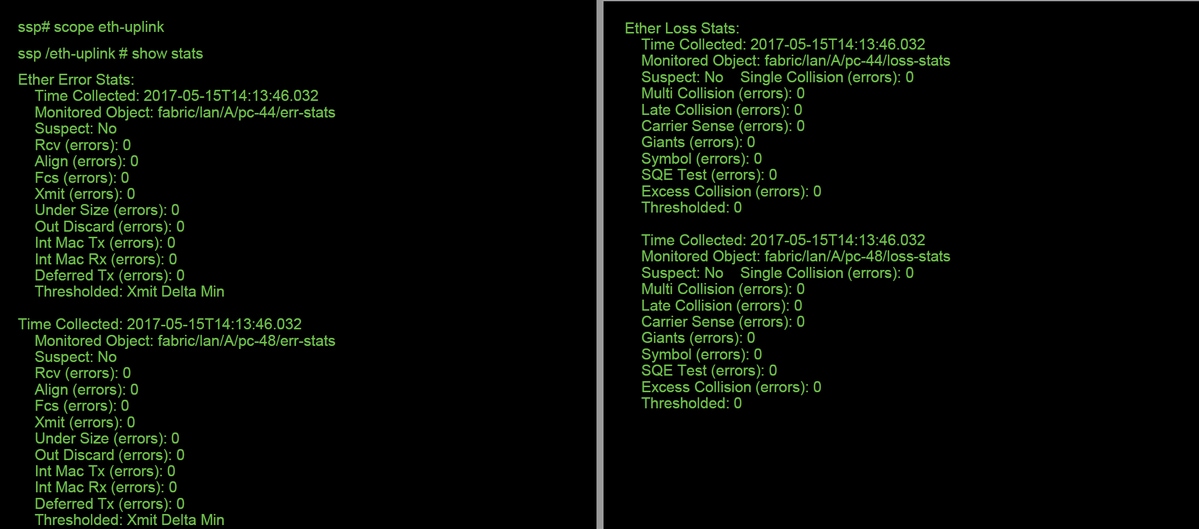
After the fabric interconnect handles the packet upon ingress, it is then sent to the interfaces which are assigned to the logical device hosting the FTD device.
Here is a diagram for reference:
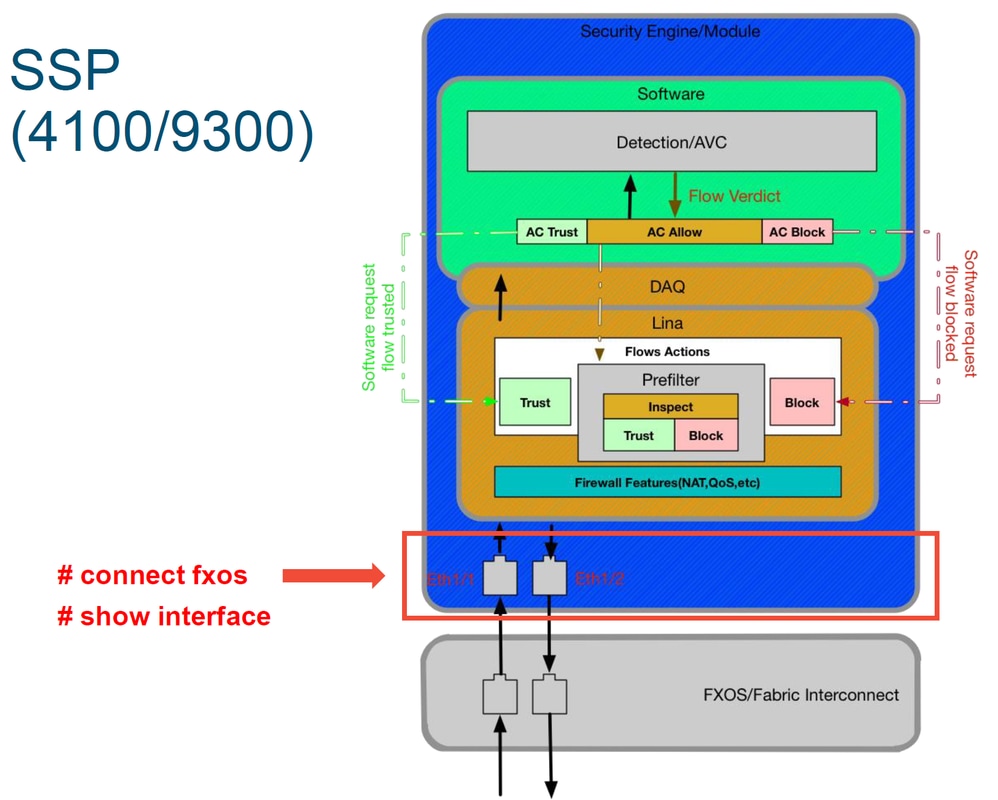
In order to check for any interface level issues, enter the following commands:
ssp# connect fxos
ssp(fxos)# show interface Ethernet 1/7
This is an output example (possible issues highlighted in red):
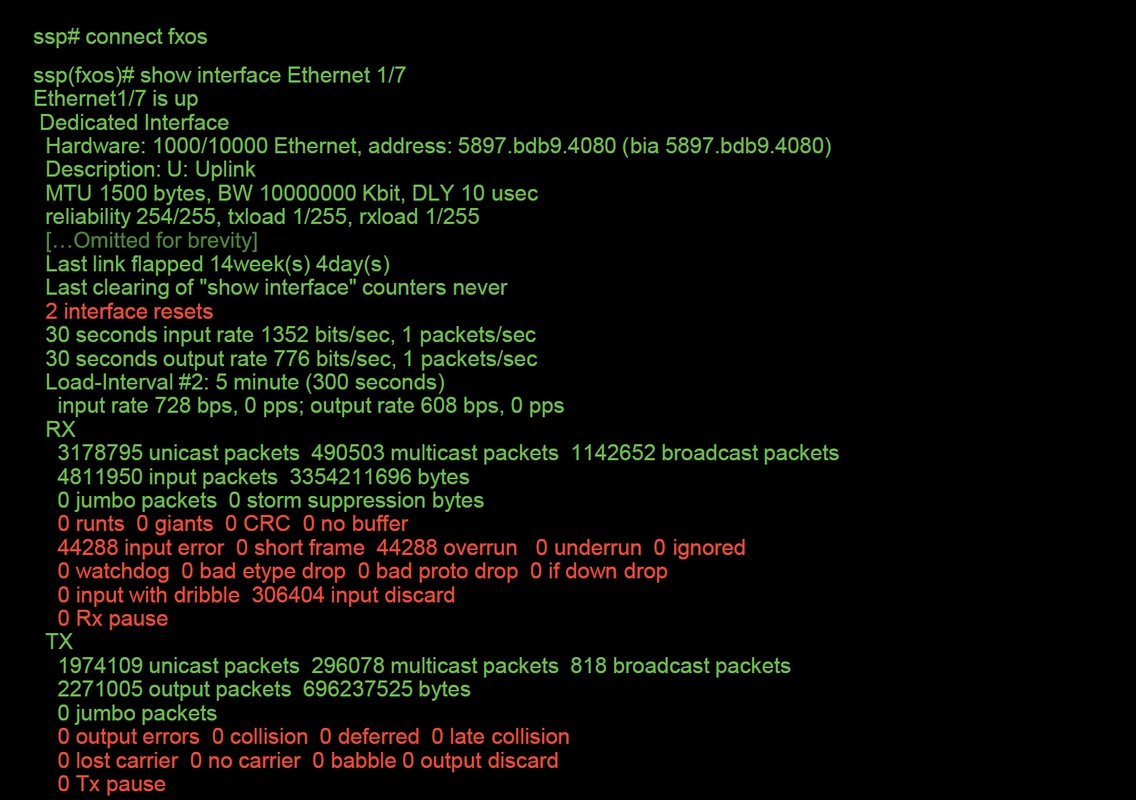
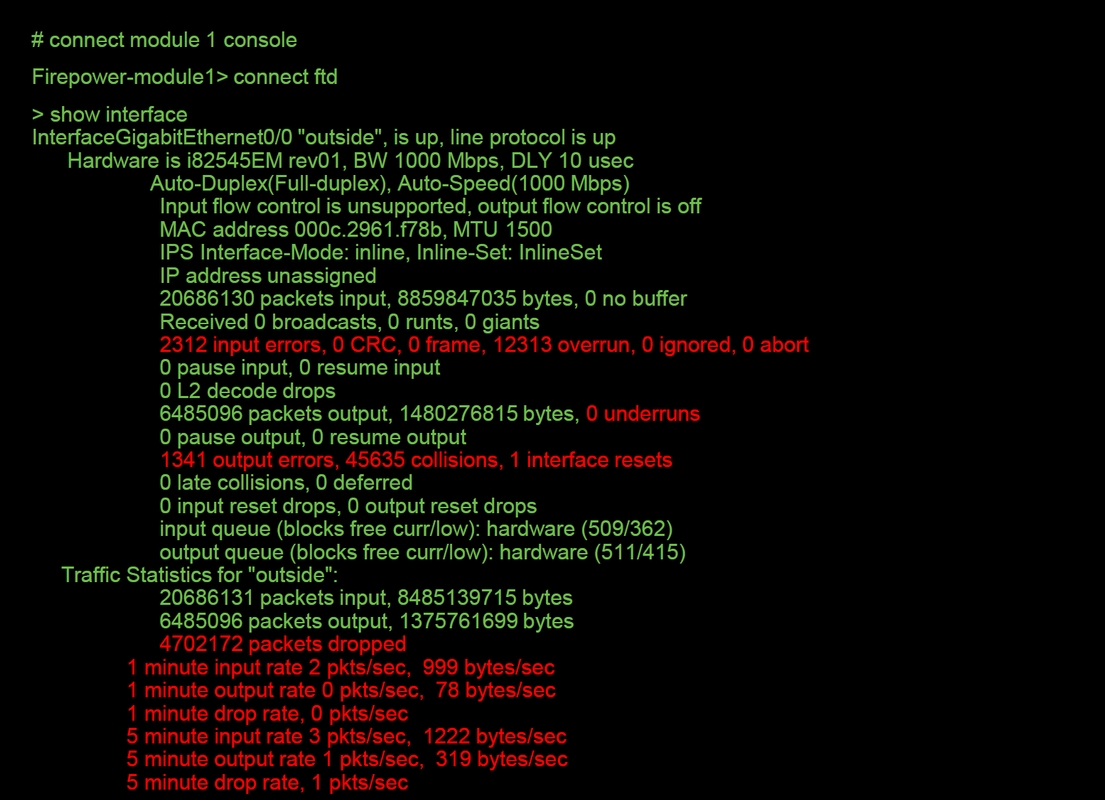
If any errors are seen, the actual FTD software can be checked for interface errors as well.
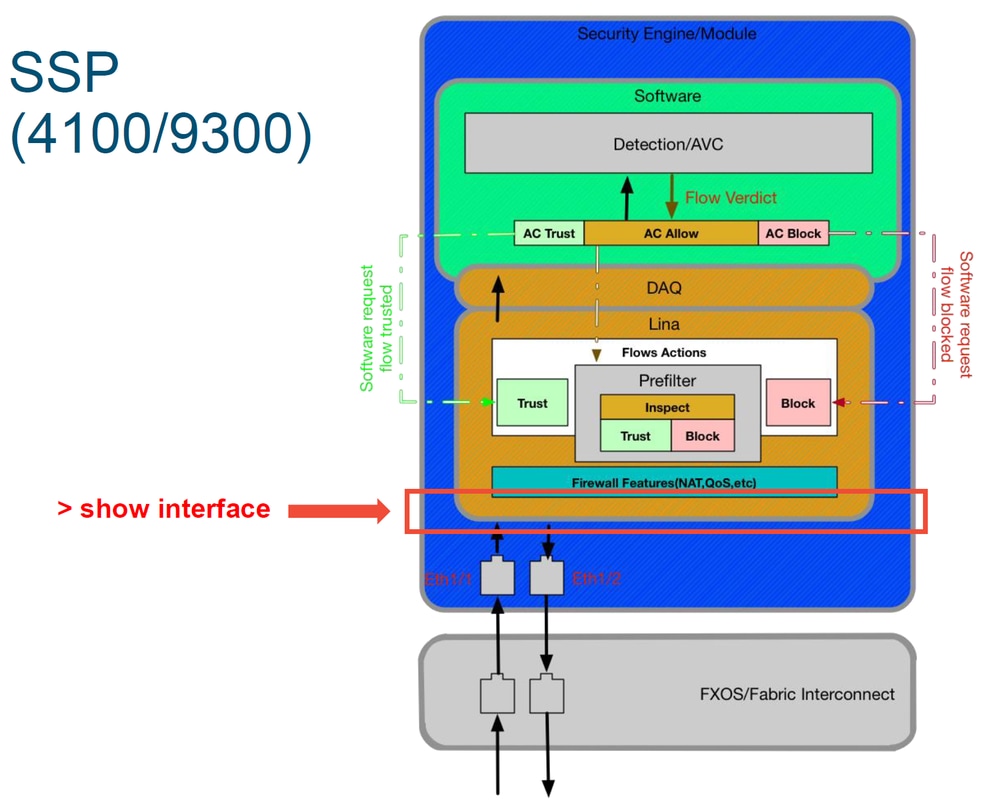
In order to get to the FTD prompt, it is first necessary to navigate to the FTD CLI prompt.
# connect module 1 console
Firepower-module1> connect ftd
> show interface
For multi-instances:
# connect module 1 telnet
Firepower-module1>connect ftd ftd1
Connecting to container ftd(ftd1) console... enter "exit" to return to Boot CLI
>
This is an output example.
Data to Provide to Cisco Technical Assistance Center (TAC)
| Data | Instructions |
| Connection Event screenshots | See this article for instructions |
| 'show interface' output | See this article for instructions |
| Packet captures |
For ASA/LINA: https://www.cisco.com/c/en/us/support/docs/security/asa-5500-x-series-next-generation-firewalls/1180... For Firepower: http://www.cisco.com/c/en/us/support/docs/security/sourcefire-firepower-8000-series-appliances/11777... |
| ASA 'show tech' output |
Log into ASA CLI and have the terminal session saved to a log. Enter the show tech command and then provide the terminal session output file to TAC. This file can be saved to disk or an external storage system with this command. show tech | redirect disk0:/show_tech.log |
| Troubleshoot file from the Firepower device inspecting the traffic | http://www.cisco.com/c/en/us/support/docs/security/sourcefire-defense-center/117663-technote-SourceFire-00.html |
Next Step: Troubleshoot the Firepower DAQ Layer
If it is unclear as to whether the Firepower device is dropping packets, the Firepower device itself can be bypassed to rule out all of the Firepower components at once. This is especially helpful in mitigating an issue if the traffic in question is ingressing the Firepower device but not egressing.
To proceed, please review the next phase of Firepower data path troubleshooting; The Firepower DAQ. Click here to continue.
Contributed by Cisco Engineers
- Created by John GroetzingerCisco Technical Leader
- Edited by John LongCisco QA Software Engineer
- Edited by Cesar Lopez ZamarripaCisco Technical Consultant Engineer
Contact Cisco
- Open a Support Case

- (Requires a Cisco Service Contract)
 Feedback