Firepower Data Path Troubleshooting Phase 2: DAQ Layer
Available Languages
Download Options
Bias-Free Language
The documentation set for this product strives to use bias-free language. For the purposes of this documentation set, bias-free is defined as language that does not imply discrimination based on age, disability, gender, racial identity, ethnic identity, sexual orientation, socioeconomic status, and intersectionality. Exceptions may be present in the documentation due to language that is hardcoded in the user interfaces of the product software, language used based on RFP documentation, or language that is used by a referenced third-party product. Learn more about how Cisco is using Inclusive Language.
Contents
Introduction
This article is part of a series of articles which explain how to systematically troubleshoot the data path on Firepower systems to determine whether components of Firepower may be affecting traffic. Please refer to the Overview article for information about the architecture of Firepower platforms and links to the other Data Path Troubleshooting articles.
In this article, we will look at the second stage of the Firepower data path troubleshooting: the DAQ (Data Aquisition) Layer.

Platform Guide
The following table describes the platforms covered by this article.
| Platform Code Name | Description | Applicable Hardware Platforms | Notes |
| SFR | ASA with Firepower Services (SFR) module installed. | ASA-5500-X series | N/A |
| FTD (all) | Applies to all Firepower Threat Defense (FTD) platforms | ASA-5500-X series, virtual NGFW platforms, FPR-2100, FPR-9300, FPR-4100 | N/A |
| FTD (non-SSP and FPR-2100) | FTD image installed on an ASA or a Virtual Platform | ASA-5500-X series, virtual NGFW platforms, FPR-2100 | N/A |
| FTD (SSP) | FTD installed as a logical device on a Firepower eXtensible Operative System (FXOS) based chassis | FPR-9300, FPR-4100 | The 2100 series does not use the FXOS Chassis Manager |
Troubleshooting the Firepower DAQ Phase
The DAQ (Data Aquisition) Layer is a component of Firepower which translates packets into a form that snort can understand. It initially handles the packet when it is sent to snort. Therefore, if the packets are ingressing but not egressing the Firepower appliance or the packet ingress troubleshooting did not yield useful results, DAQ troubleshooting can be useful.
Capturing Traffic at the DAQ Layer
In order to get to prompt from which to run the capture, you must first connect using SSH to the SFR or FTD IP address.
Note: On the FPR-9300 and 4100 devices, enter connect ftd first, to end up at the second > prompt. You can also SSH into the FXOS Chassis Manager IP, then enter connect module 1 console, followed by connect ftd.
This article explains how to collect packet captures at the Firepower DAQ level.
Note how the syntax is not the same as the capture command used on ASA as well as the LINA side of the FTD platform. Here is an example of a DAQ packet capture run from an FTD device:
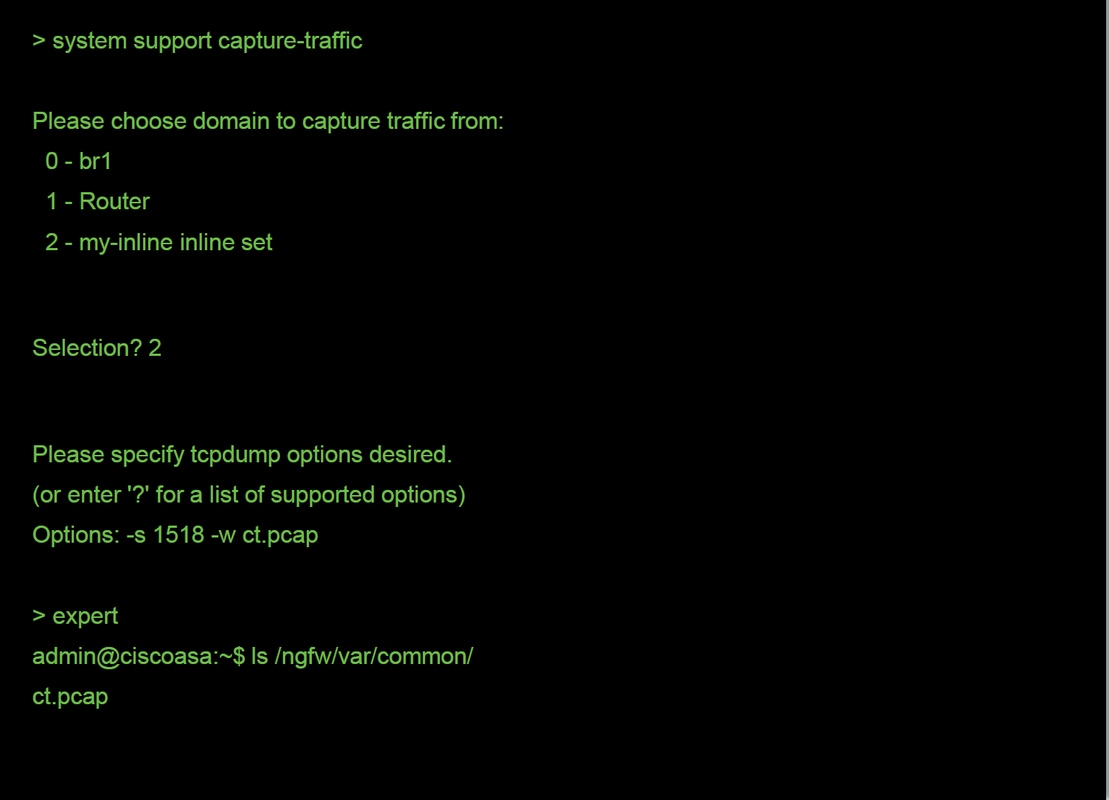
As seen in the screenshot above, a capture on PCAP format called ct.pcap was written to the /ngfw/var/common directory (/var/common on the SFR platform). These capture files can be copied off of the Firepower device from the > prompt using the directions in the article mentioned above.
Alternatively, on the Firepower Management Center (FMC) in Firepower version 6.2.0 and greater, navigate to Devices > Device Management. Then, click on the  icon next to the device in question, followed by Advanced Troubleshooting > File Download.
You can then enter the name of the capture file and click Download.

How to Bypass Firepower
If Firepower is seeing the traffic, but it has been determined that the packets are not egressing the device or there is another issue with the traffic, the next step would be to bypass the Firepower inspection phase to confirm that one of the Firepower components is dropping the traffic. Following is a breakdown of the fastest way to have traffic bypass Firepower on the various platforms.
SFR - Place the Firepower Module into Monitor-Only Mode
On the ASA which hosts the SFR, you can place the SFR module in monitor-only mode via the ASA Command Line Interface (CLI) or the Cisco Adaptive Security Device Manager (ASDM). This causes only a copy of the live packets to be sent to the SFR module.
In order to place the SFR module into monitor-only mode via the ASA CLI, the class-map and policy-map used for SFR redirect must first be determined by running the show service-policy sfr command.
# show service-policy sfr

Global policy:
  Service-policy: global_policy
    Class-map: sfr
      SFR: card status Up, mode fail-open
        packet input 10000, packet output 9900, drop 100, reset-drop 0
The output shows that the global_policy policy map is enforcing the sfr fail-open action on the "sfr" class-map.
Note: "fail-close" is also a mode in which the SFR can run, but it is not as commonly used since it blocks all traffic if the SFR module is down or unresponsive.
In order to place the SFR module into monitor-only mode, you can issue these commands to negate the current SFR configuration and enter the monitor-only configuration:
# configure terminal
(config)# policy-map global_policy
(config-pmap)# class sfr
(config-pmap-c)# no sfr fail-open
(config-pmap-c)# sfr fail-open monitor-only

INFO: The monitor-only mode prevents SFR from denying or altering traffic.

(config-pmap-c)# write memory
Building configuration...
Once the module has been placed into monitor-only mode, it can be verified in the show service-policy sfr output.
# sh service-policy sfr

Global policy:
  Service-policy: global_policy
    Class-map: sfr
      SFR: card status Up, mode fail-open monitor-only
        packet input 0, packet output 100, drop 0, reset-drop 0
Note: To place the SFR module back into inline mode, issue the no sfr fail-open monitor-only command from the (config-pmap-c)# prompt shown above, followed by the sfr {fail-open | fail-close} command that was originally there.
Alternatively, you can place the module into monitor-only via the ASDM by navigating to Configuration > Firewall > Service Policy Rules. Then, click on the rule in question. Next, go to the Rule Actions page and click the ASA FirePOWER Inspection tab. Once there, the Monitor-only can be selected.
If the traffic issue remains even after the SFR module has been confirmed to be in monitor-only mode, the Firepower module is not causing the issue. Packet tracer can then be run to further diagnose issues at the ASA level.
If the issue no longer remains, the next step would be to troubleshoot the Firepower software components.
FTD (all) - Place Inline Sets into TAP mode
If the traffic is passing through interface pairs configured in inline sets, the inline set can be placed into TAP mode. This essentially causes Firepower to not take action on the live packet. It doesn't apply to router or transparent mode without inline sets as the device must modify the packets prior to send them to the next hop and cannot be placed into a bypass mode without dropping traffic. For routed and transparent mode without inline sets, proceed with the packet tracer step.
To configure TAP mode from the FMC User Interface (UI), navigate to Devices > Device Management, then edit the device in question. Under the Inline Sets tab, check off the option for TAP Mode.
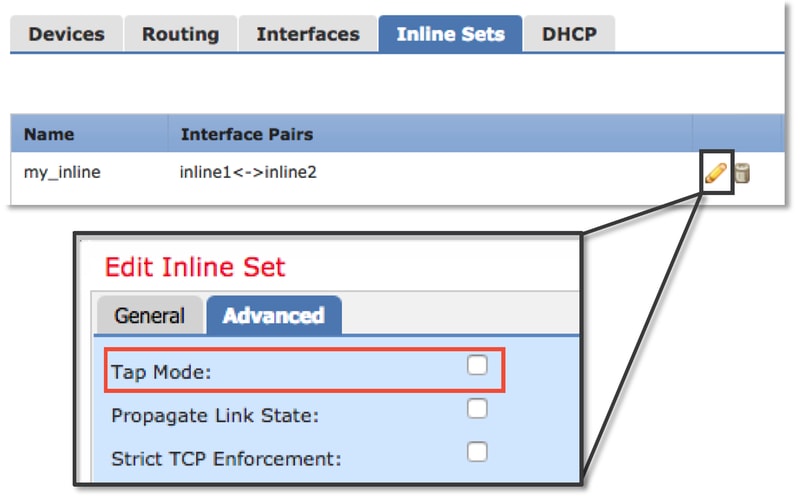
If TAP mode resolves the issue, the next step would be to troubleshoot the Firepower software components.
If TAP mode does not resolve the issue, then the issue would be outside of the Firepower software. Packet tracer can then be used to further diagnose the issue.
Using Packet Tracer to Troubleshoot Simulated Traffic
Packet Tracer is a utility which can help to identify the location of a packet drop. It is a simulator, so it performs a trace of an artificial packet.
SFR - Run Packet Tracer on ASA CLI
Here is an example of how to run packet-tracer on the ASA CLI for SSH traffic. For more detailed information about the syntax of the packet tracer command, please refer to this section on the ASA Series Command Reference guide.
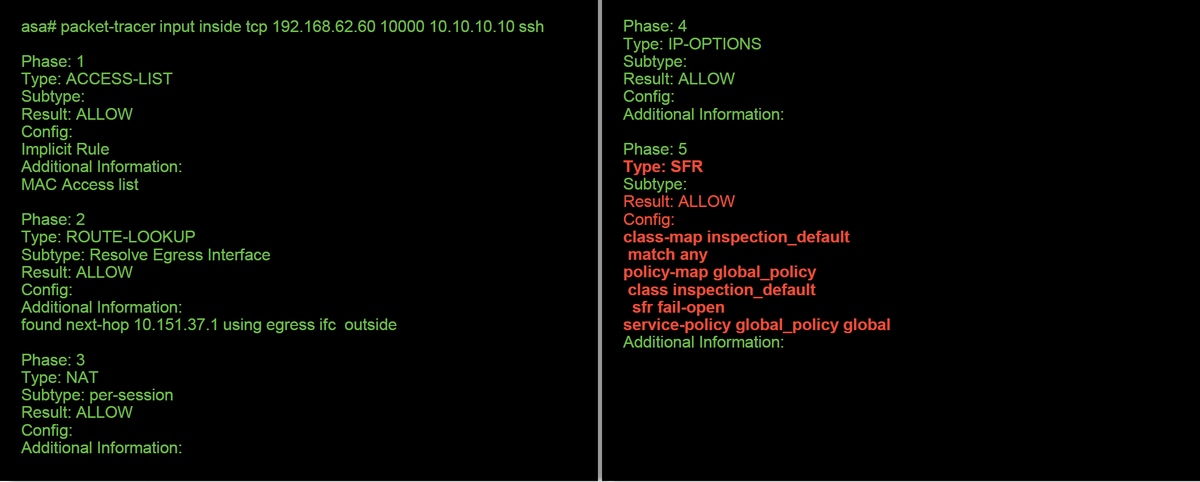
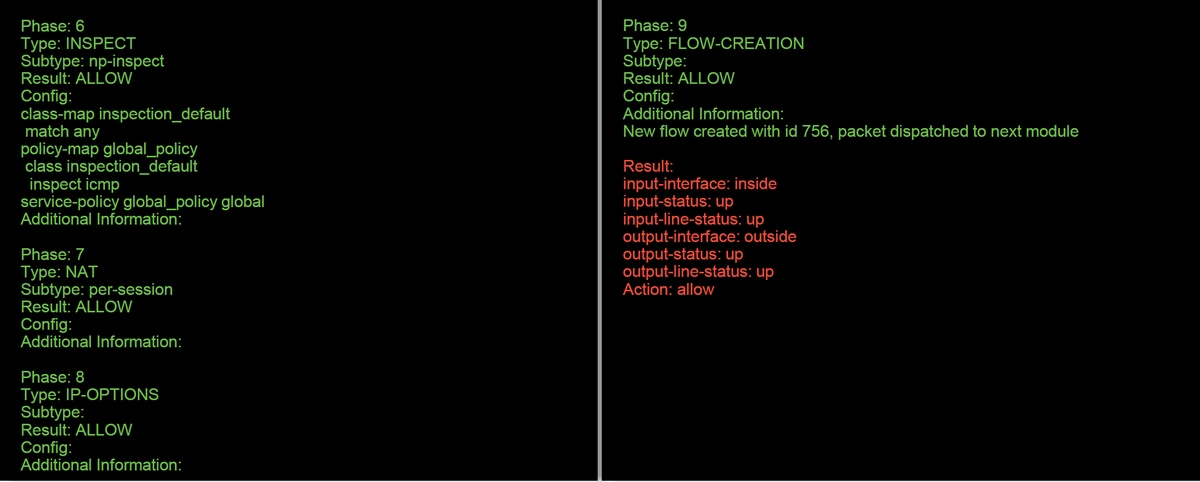
In the example above, we see both the ASA and SFR module allowing the packets as well as useful information about how the ASA would handle the packet flow.
FTD (all) - Run packet tracer on the FTD CLI
On all of the FTD platforms, the packet tracer command can be run from the FTD CLI.
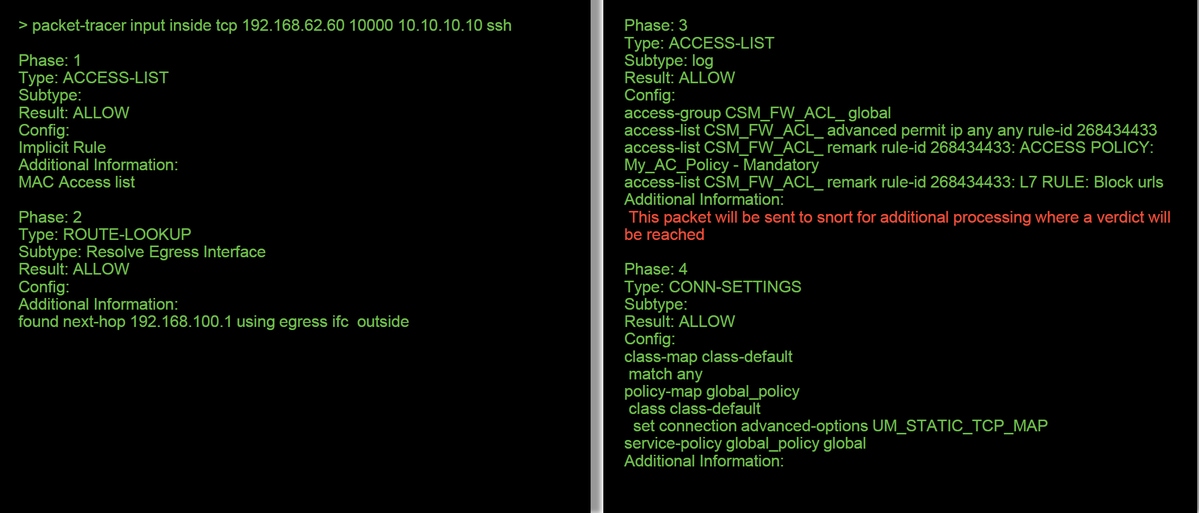
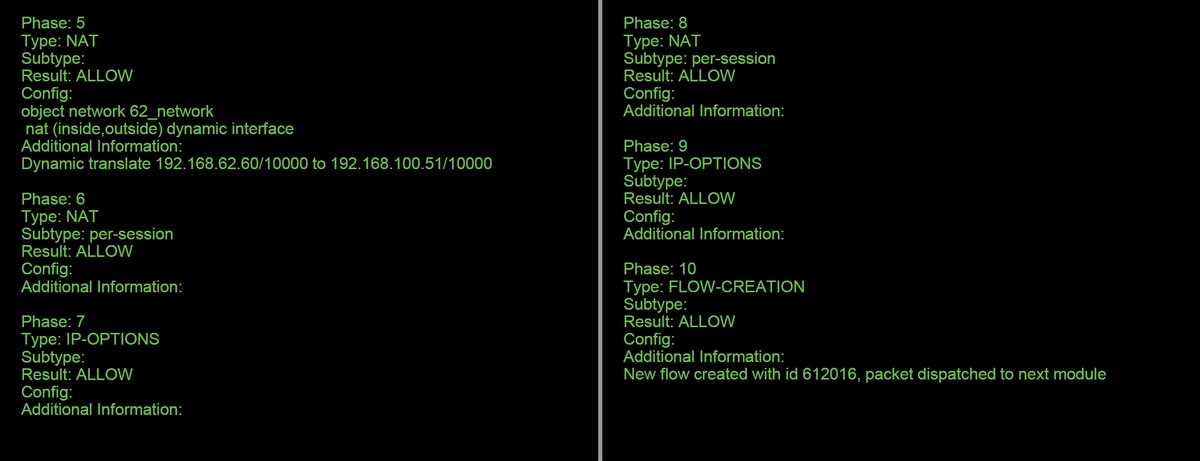
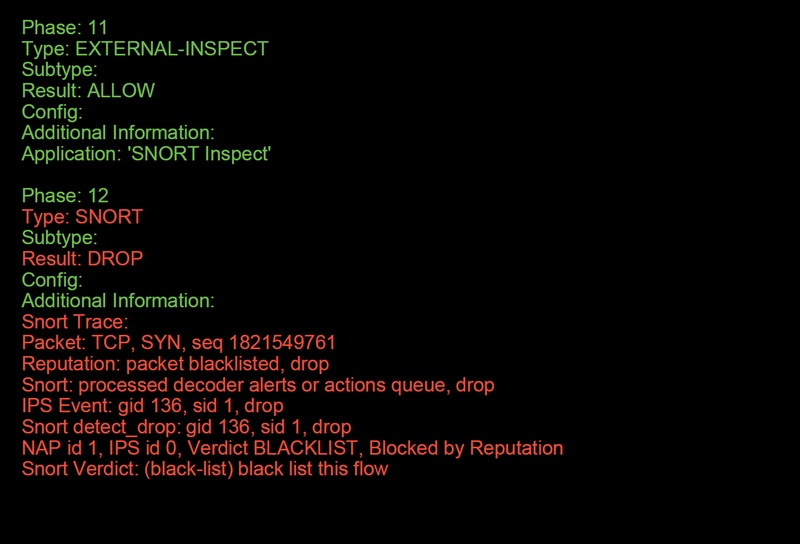
In this example, packet tracer does show the reason for the drop. In this case, it is the IP blacklist within the Security Intelligence feature in Firepower blocking the packet. The next step would be to troubleshoot the individual Firepower software component causing the drop.
Using Capture with Trace to Troubleshoot Live Traffic
The live traffic can also be traced via the capture with trace feature, which is available on all platforms via the CLI. Below is an example of running a capture with trace against SSH traffic.

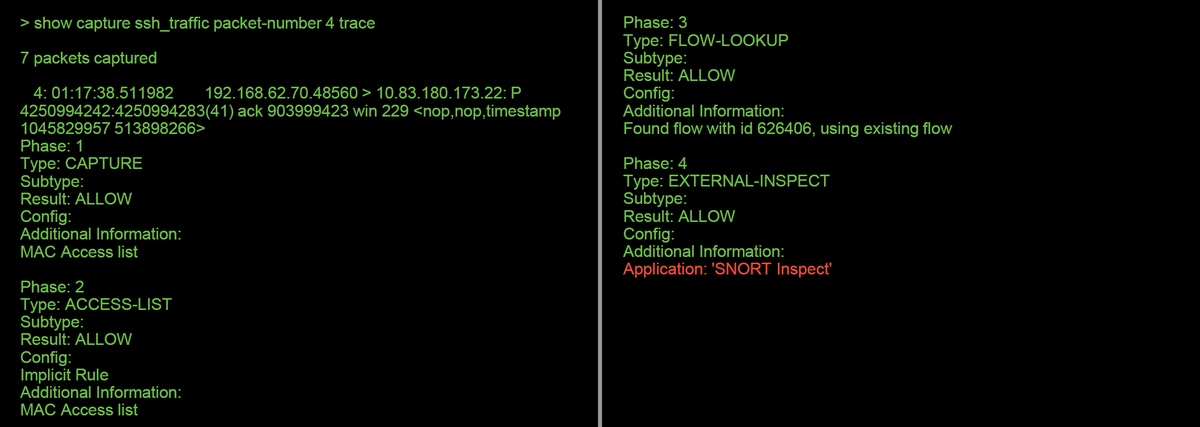
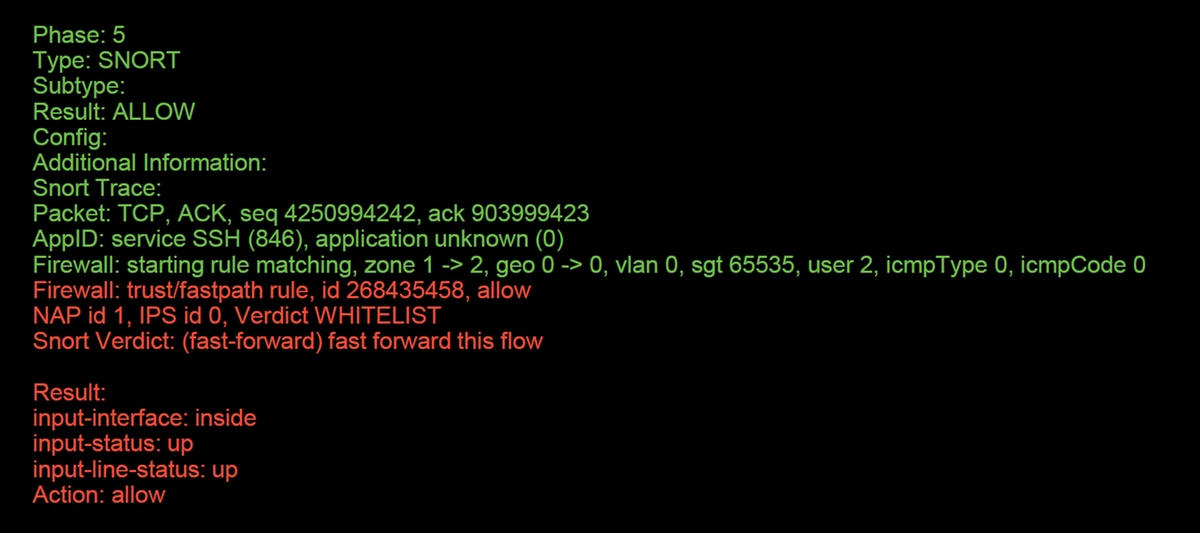
In this example, the fourth packet in the capture was traced, since this is the first packet with application data defined. As shown, the packet ends up being whitelisted by snort, meaning that no further snort inspection is necessary for the flow, and allowed overall.
For more information on the capture with trace syntax, please refer to this section on the ASA Series Command Reference guide.
FTD (all) - Running Capture with Trace on FMC GUI
On the FTD platforms, capture with trace can be run on the FMC UI. To access the utility, navigate to Devices > Device Management.
Then, click on the  icon next to the device in question, followed by Advanced Troubleshooting > Capture w/Trace.
Below is an example of how to run a capture with trace via the GUI.
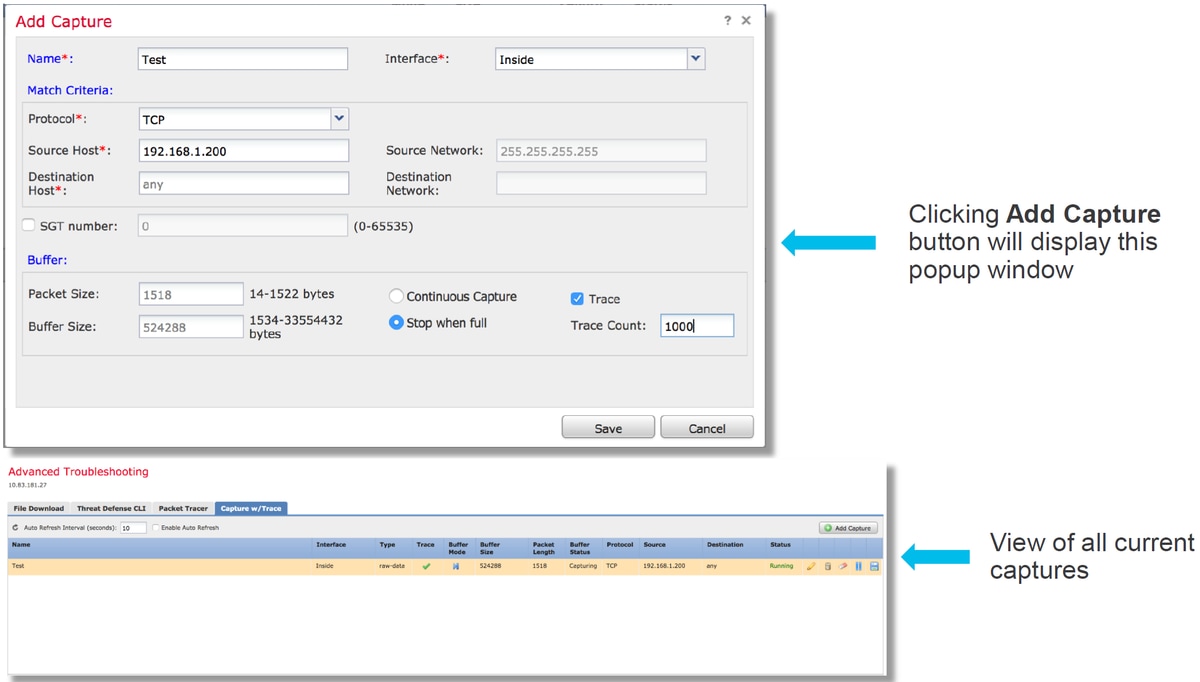
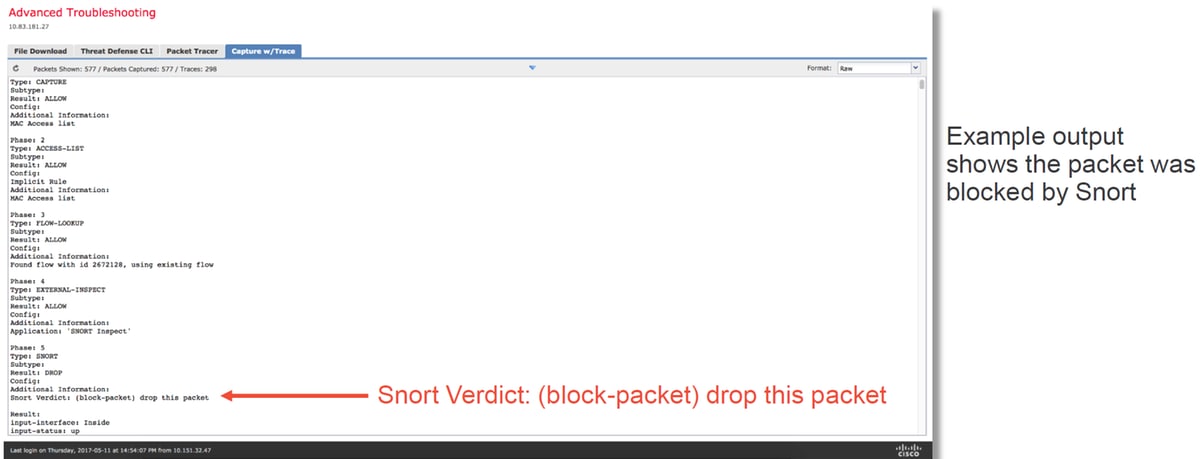
If the capture with trace shows the cause of the packet drop, the next step would be to troubleshoot the individual software components.
If it does not clearly show the cause of the issue, the next step would be to fast-path the traffic.
Creating a PreFilter Fastpath Rule in FTD
On all of the FTD platforms, there is a Pre-Filter Policy, which can be used to divert traffic from Firepower (snort) inspection.
On the FMC, this is found under Policies > Access Control > Prefilter. The default Pre-Filter Policy cannot be edited, so a custom policy will need to be created.
Afterward, the newly created Prefilter Policy needs to be associated with the Access Control Policy. This is configured within the Advanced tab of the Access Control Policy in the Prefilter Policy Settings section.
Below is an example of how to create a Fastpath rule within a Prefilter Policy and verify the hit count.
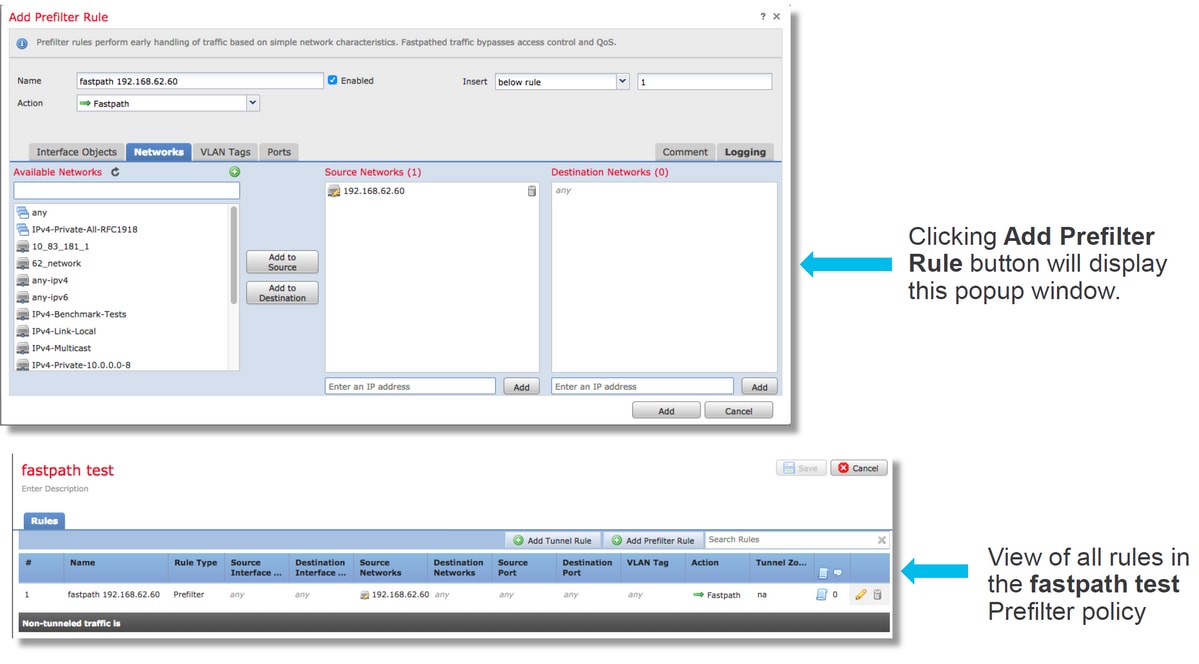
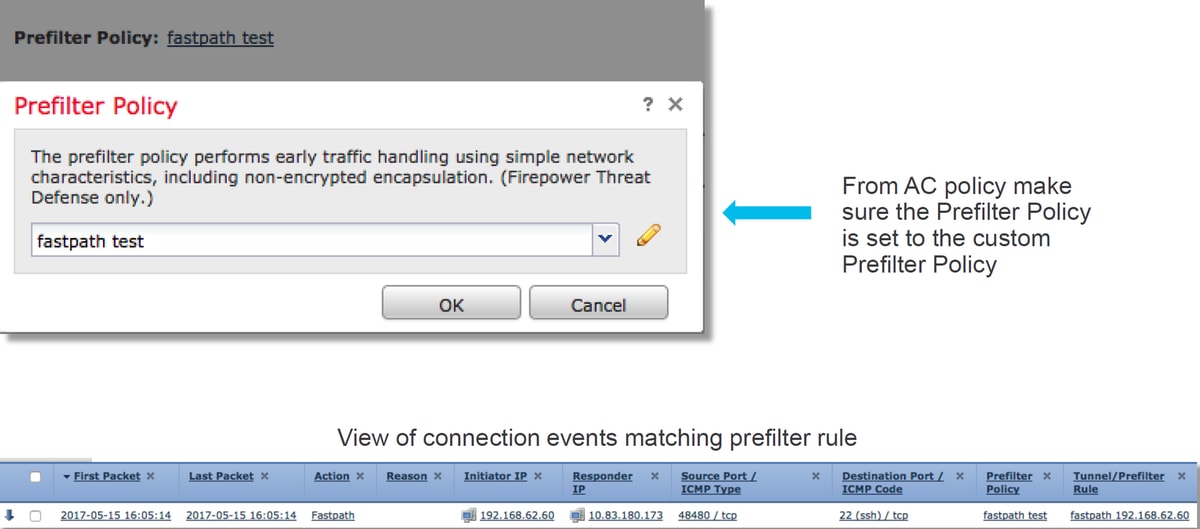
Click here for more details about the operation and configuration of Prefilter Policies.
If adding a PreFilter Policy resolves the traffic issue, the rule can be left in place if desired. However, no further inspection is done to that flow. Further troubleshooting of the Firepower software will need to be performed.
If adding the Prefilter Policy does not resolve the issue, the packet with trace step can be run again to trace the new path of the packet.
Data to Provide to TAC
| Data | Instructions |
| Command outputs | See this article for instructions |
| Packet Captures |
For ASA/LINA: https://www.cisco.com/c/en/us/support/docs/security/asa-5500-x-series-next-generation-firewalls/118097-configure-asa-00.html For Firepower: http://www.cisco.com/c/en/us/support/docs/security/sourcefire-firepower-8000-series-appliances/117778-technote-sourcefire-00.html |
| ASA 'show tech' output |
Log into ASA CLI and have the terminal session saved to a log. Enter theshow techcommand and then provide the terminal session output file to TAC. This file can be saved to disk or an external storage system with this command. show tech | redirect disk0:/show_tech.log |
| Troubleshoot file from the Firepower device inspecting the traffic | http://www.cisco.com/c/en/us/support/docs/security/sourcefire-defense-center/117663-technote-SourceFire-00.html |
Next Step
If it has been determined that a Firepower software component is the cause of the issue, the next step would be to systematically rule out each component, starting with Security Intelligence.
Click here to proceed with the next guide.
Contributed by Cisco Engineers
- Created by John GroetzingerCisco Technical Leader
- Edited by John LongCisco QA Software Engineer
- Edited by Cesar Lopez ZamarripaCisco Technical Consulting Engineer
Contact Cisco
- Open a Support Case

- (Requires a Cisco Service Contract)
 Feedback