Firepower Data Path Troubleshooting Phase 7: Intrusion Policy
Available Languages
Download Options
Bias-Free Language
The documentation set for this product strives to use bias-free language. For the purposes of this documentation set, bias-free is defined as language that does not imply discrimination based on age, disability, gender, racial identity, ethnic identity, sexual orientation, socioeconomic status, and intersectionality. Exceptions may be present in the documentation due to language that is hardcoded in the user interfaces of the product software, language used based on RFP documentation, or language that is used by a referenced third-party product. Learn more about how Cisco is using Inclusive Language.
Contents
Introduction
This article is part of a series of articles which explain how to systematically troubleshoot the data path on Firepower systems to determine whether components of Firepower may be affecting traffic. Please refer to the Overview article for information about the architecture of Firepower platforms and links to the other Data Path Troubleshooting articles.
This article covers the seventh phase of the Firepower data path troubleshooting, the Intrusion Policy feature.
Prerequisites
- This article is applicable to all Firepower platforms running an Intrusion Policy
- The trace feature is only available in version 6.2 and above for the Firepower Threat Defense (FTD) platform only
- Knowledge of open source Snort is helpful, though not required
- For information on open source Snort, please visit https://www.snort.org/
Troubleshooting the Intrusion Policy Phase
Using the "trace" Tool to Detect Intrusion Policy Drops (FTD Only)
The system support trace tool can be run from the FTD Command Line Interface (CLI). This is similar to the firewall-engine-debug tool mentioned in the Access Control Policy phase article, except it digs deeper into the inner workings of Snort. This can be useful to see if any Intrusion Policy rules are triggering on the interesting traffic.
In the example below, traffic from the host with IP address 192.168.62.6 is being blocked by an Intrusion Policy rule (in this case, 1:23111)
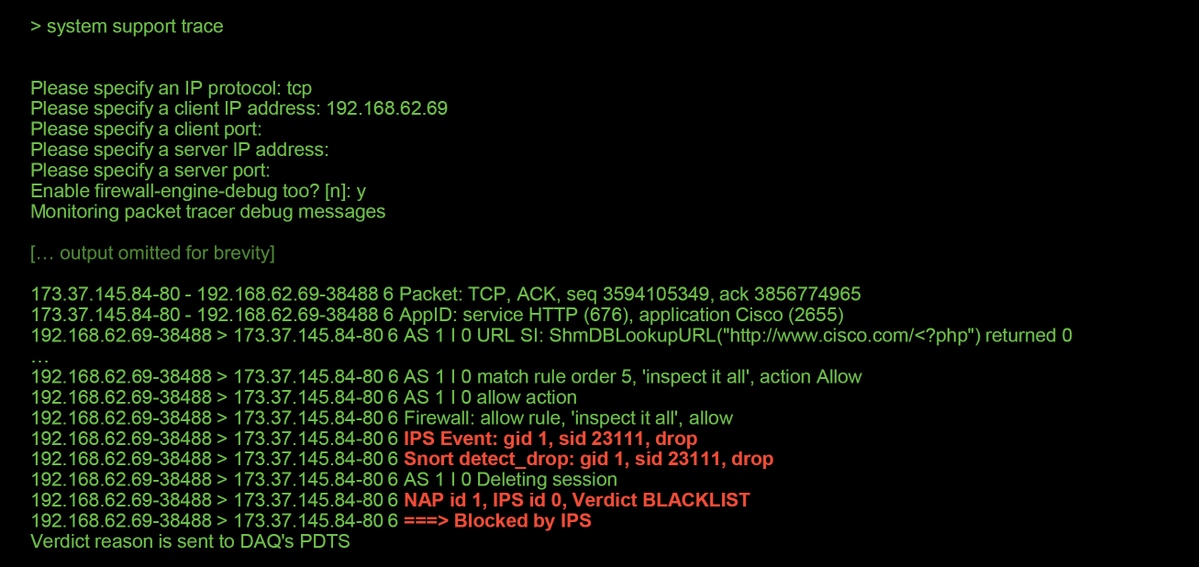
Notice that the action applied by snort was drop. When a drop is detected by snort, that particular session is then blacklisted so that any additional packets are dropped as well.
The reason why snort is able to perform the drop action is that the "Drop when Inline" option is enabled within the Intrusion Policy. This can be verified in the initial landing page within the Intrusion Policy. In the Firepower Management Center (FMC), navigate to Policies > Access Control > Intrusion and click the edit icon next to the policy in question.
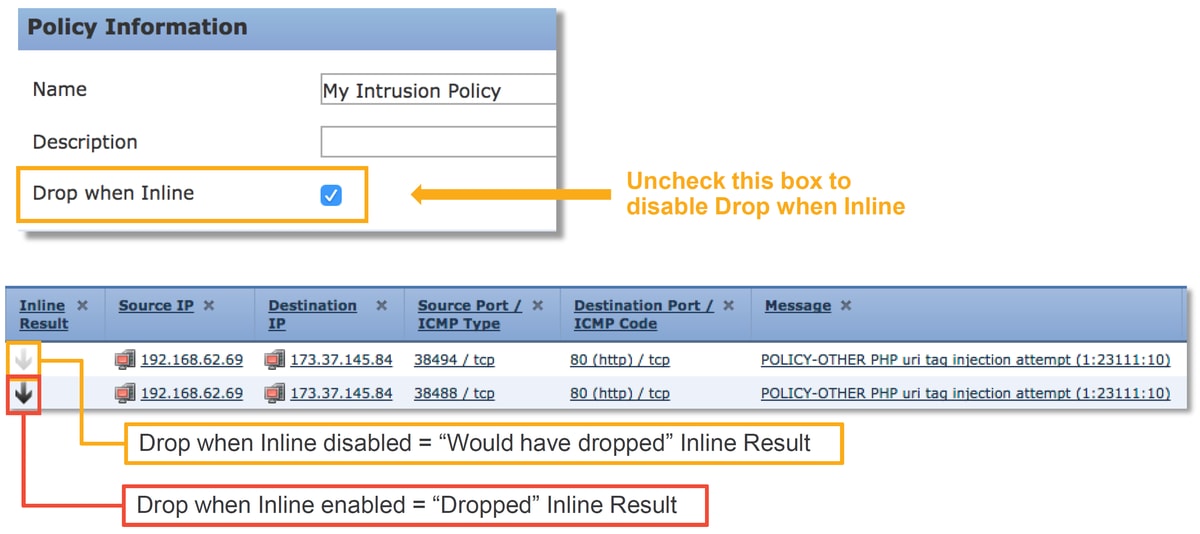
If "Drop When Inline" is disabled, snort no longer drops offending packets, but it still alerts with an Inline Result of "Would Have Dropped" in the Intrusion Events.
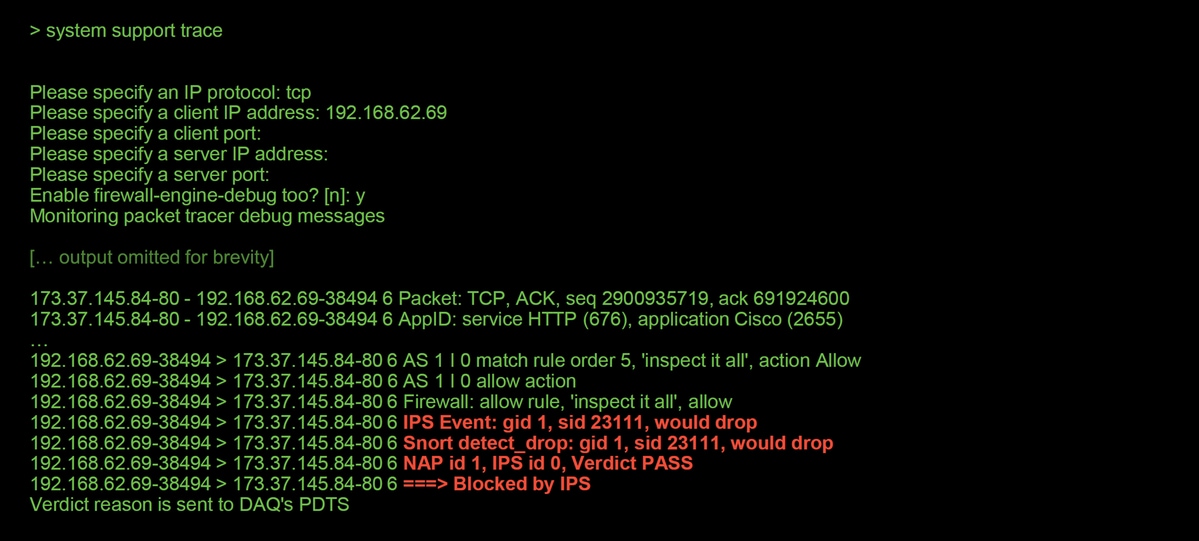
With "Drop When Inline" disabled, the trace output shows a would drop action for the traffic session in question.
Check for Suppressions in the Intrusion Policies
It is possible for snort to drop traffic without sending Intrusion Events to the FMC (silently drop). This is accomplished by configuring Suppressions. In order to verify whether any suppression has been configured in an Intrusion Policy, the expert shell can be checked on the backend, as illustrated below.

Notice that the Intrusion Policy called "My Intrusion Policy" contains a suppression for the 1:23111 rule. Therefore, traffic can be dropped due to this rule, without any events. This is another reason why the trace utility can be helpful, as it still shows the drops occurring.
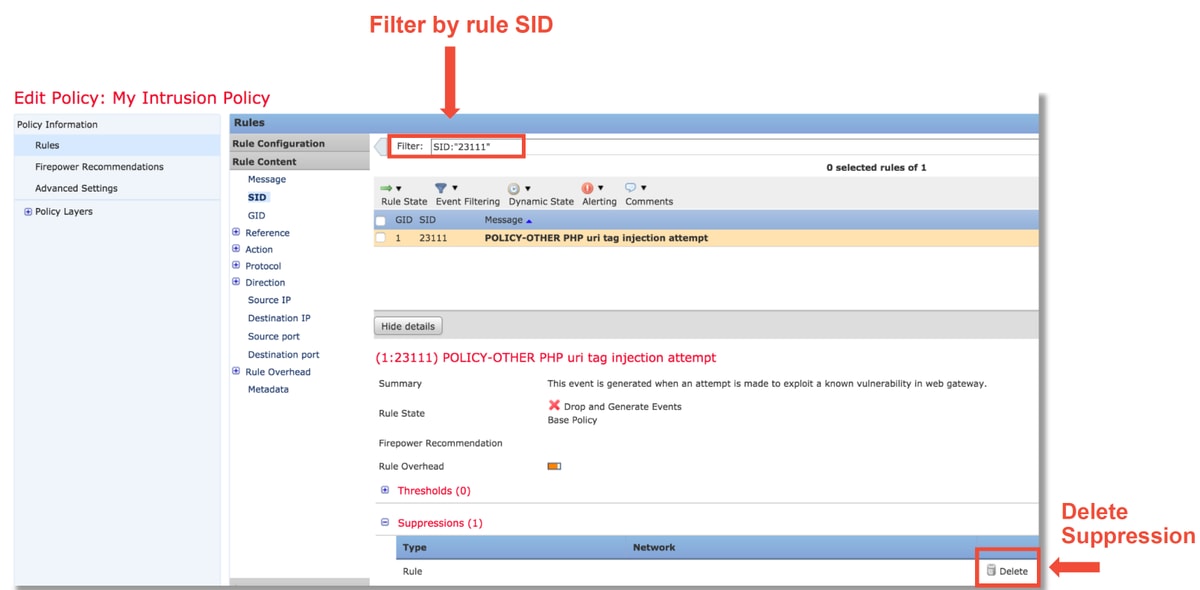
In order to delete the suppression, the rule in question can be filtered within the Intrusion Policy Rules view. This brings up an option to delete the suppression, as shown below.
Create a Targeted Intrusion Policy
If traffic is being dropped by a particular Intrusion Policy rule, you may not want the traffic in question to be dropped but you may also not want to disable the rule. The solution is to create a new Intrusion Policy with the offending rule(s) disabled and then have it evaluate the traffic from the targeted hosts.
Here is an illustration on how to create the new Intrusion Policy (under Policies > Access Control > Intrusion).
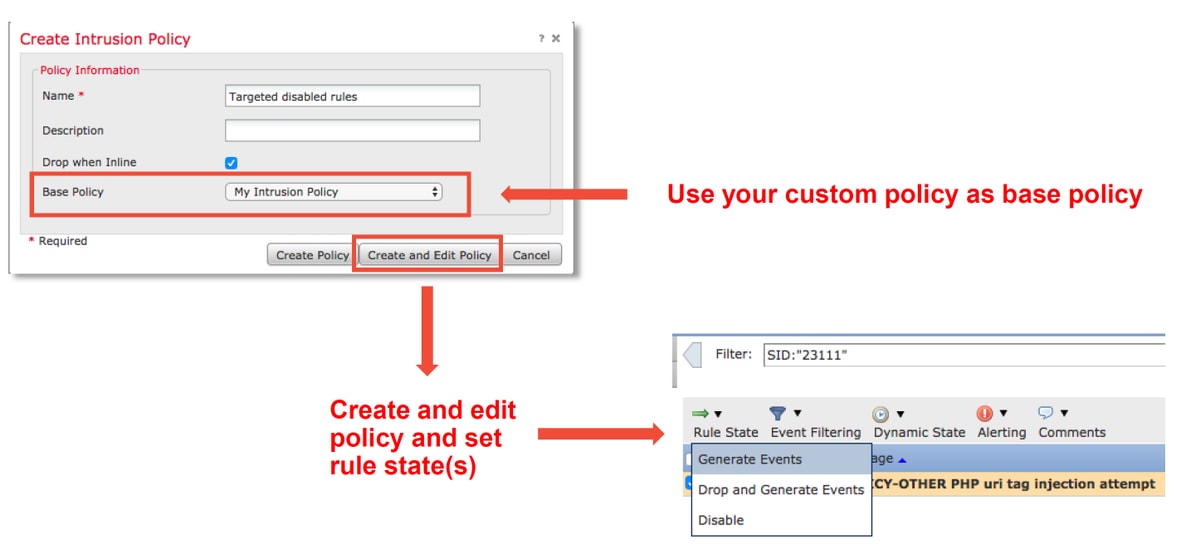
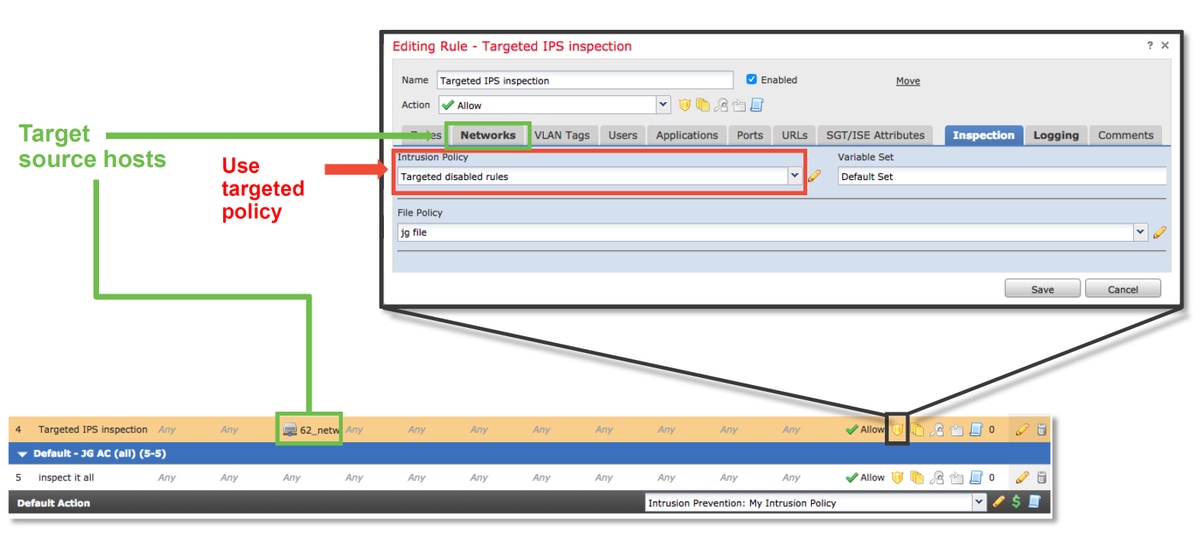
After creating the new Intrusion Policy, it can then be used within a new Access Control Policy rule, which targets the hosts in question, whose traffic was previously being dropped by the original Intrusion Policy.
False Positive Troubleshooting
A common case scenario is false positive analysis for Intrusion Events. There are several things which can be checked before opening a false positive case.
1. From the Table View of Intrusion Events page, click the checkbox for the event in question
2. Click on Download Packets to get the packets captured by Snort when the Intrusion Event was triggered.
3. Right-click on the rule name in the Message column and then Rule Documentation, to see the rule syntax and other relevant information.

Below is the rule syntax for the rule which triggered the event in the example above. The parts of the rule which can be verified against a packet capture (PCAP) file downloaded from the FMC for this rule are in bold.
alert tcp $EXTERNAL_NET any -> $HOME_NET $HTTP_PORTS \
(msg:"OS-OTHER Bash CGI environment variable injection attempt"; \
flow:to_server,established; \
content:"() {"; fast_pattern:only; http_header; \
metadata:policybalanced-ipsdrop, policy max-detect-ipsdrop, policy security-ipsdrop, ruleset community, service http; \
reference:cve,2014-6271; reference:cve,2014-6277; reference:cve,2014-6278; reference:cve,2014-7169; \
classtype:attempted-admin; \
sid:31978; rev:5; )
These initial steps can then be followed to perform the analysis process, to see if the traffic should have matched the rule which triggered.
1. Check the Access Control rule that the traffic matched. This information is found as part of the columns on the Intrusion Events tab.
2. Find the Variable Set used in said Access Control rule. The Variable Set can then be reviewed under Objects > Object Management > Variable Sets
3. Make sure the IP addresses in the PCAP file match variables (in this case, a host included in $EXTERNAL_NET variable connecting to a host included in the $HOME_NET variable configuration)
4. For flow, a full session/connection may need to be captured. Snort won't capture the complete flow due to performance reasons. However, in most cases, it is safe to assume that if a rule with flow:established triggered, the session was established at the time the rule triggered, so a full PCAP file isn't necessary to verify this option in a snort rule. But it may be useful to better understand the reason why it was triggered.
5. For service http, look at the PCAP file in Wireshark to see if it looks like HTTP traffic. If you have network discovery enabled for the host and it has seen the application "HTTP" before, it can cause service to match on a session.
With this information in mind, the packet(s) which are downloaded from the FMC can be further reviewed in Wireshark. The PCAP file can be evaluated to determine whether the event which is triggered is a false positive.
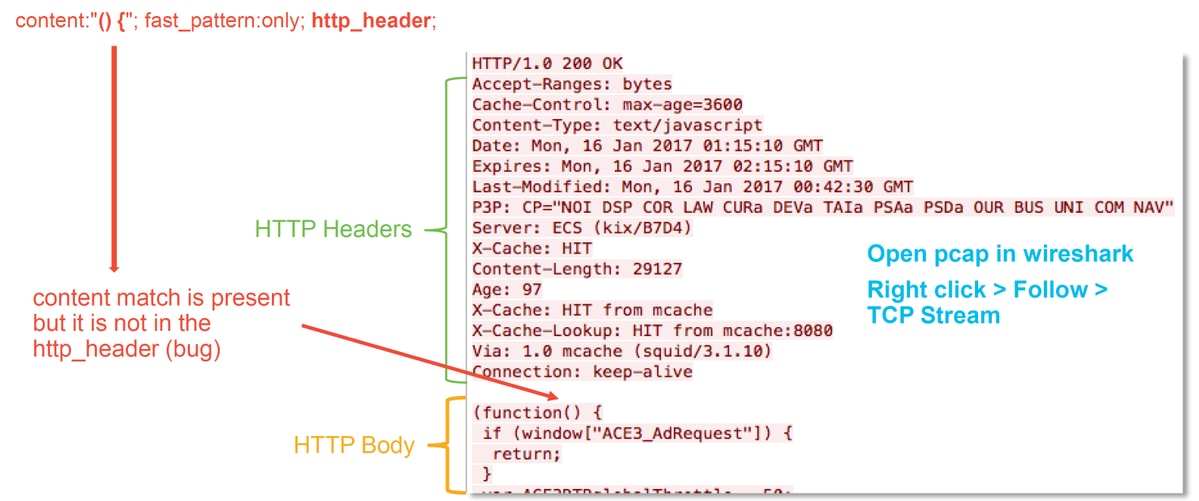
In the illustration above, the content for which the rule detects was present in the PCAP file - "() {"
However, the rule specifies that the content should be detected in the HTTP header of the packet - http_header
In this case, the content was found in the HTTP body. Therefore this is a false positive. However, it is not a false positive in the sense that the rule is written incorrectly. The rule is correct and it can not be improved in this case. This example is likely encountering a Snort bug which is causing snort to have buffer confusion. This means that Snort has identified the http_headers incorrectly.
In this case, you can check for any existing bugs for snort/IPS engine in the version that your device is running, and if there are none, a case with Cisco Technical Assistance Center (TAC) can be opened. Full session captures are required to investigate such an issue as the Cisco team needs to review how Snort got into that state, which can't be done with a single packet.
True Positive Example
The illustration below shows packet analysis for the same Intrusion Event. This time, the event is a true positive because the content does appear in the HTTP header.

Data to Provide to TAC
| Data | Instructions |
| Troubleshoot file from the Firepower device inspecting the traffic | http://www.cisco.com/c/en/us/support/docs/security/sourcefire-defense-center/117663-technote-SourceFire-00.html |
| Packet captures which were downloaded from the FMC | See this Article for instructions |
| Any relevant CLI output gathered, such as trace output | See this Article for instructions |
Next Steps
If it has been determined that the Intrusion Policy component is not the cause of the issue, the next step would be to troubleshoot the Network Analysis Policy feature.
Click here to proceed to the last article.
Contributed by Cisco Engineers
- Created by John GroetzingerCisco Technical Leader
- Edited by John LongCisco QA Software Engineer
- Edited by Cesar Lopez ZamarripaCisco Technical Consulting Engineer
Contact Cisco
- Open a Support Case

- (Requires a Cisco Service Contract)
 Feedback