Firepower Data Path Troubleshooting Phase 8: Network Analysis Policy
Available Languages
Download Options
Bias-Free Language
The documentation set for this product strives to use bias-free language. For the purposes of this documentation set, bias-free is defined as language that does not imply discrimination based on age, disability, gender, racial identity, ethnic identity, sexual orientation, socioeconomic status, and intersectionality. Exceptions may be present in the documentation due to language that is hardcoded in the user interfaces of the product software, language used based on RFP documentation, or language that is used by a referenced third-party product. Learn more about how Cisco is using Inclusive Language.
Contents
Introduction
This article is part of a series of articles which explain how to systematically troubleshoot the data path on Firepower systems to determine whether components of Firepower may be affecting traffic. Please refer to the Overview article for information about the architecture of Firepower platforms and links to the other Data Path Troubleshooting articles.
This article covers the eighth stage of the Firepower data path troubleshooting, the Network Analysis Policy feature.

Prerequisites
- This article is applicable to all Firepower platforms
- The trace feature is only available in software version 6.2.0 and above for the Firepower Threat Defense (FTD) platform only.
- Knowledge of open source Snort is helpful, though not required
- For information on open source Snort, please visit https://www.snort.org/
Troubleshooting the Network Analysis Policy Feature
The Network Analysis Policy (NAP) contains snort preprocessor settings which perform inspections on traffic, based on the application identified. The preprocessors have the ability to drop traffic, based on configuration. This article addresses how to verify the NAP configuration and check for preprocessor drops.
Note: Preprocessor rules have a Generator ID (GID) other than '1' or '3' (i.e. 129, 119, 124). More information about the GID to preprocessor mappings can be found in the FMC Configuration Guides.
Using the "trace" Tool to Find Preprocessor Drops (FTD Only)
The system support trace tool can be used to detect drops performed at the preprocessor level.
In the example below, the TCP normalization preprocessor detected an anomaly. As a result, the traffic is dropped by rule 129:14, which looks for missing timestamps within a TCP stream.
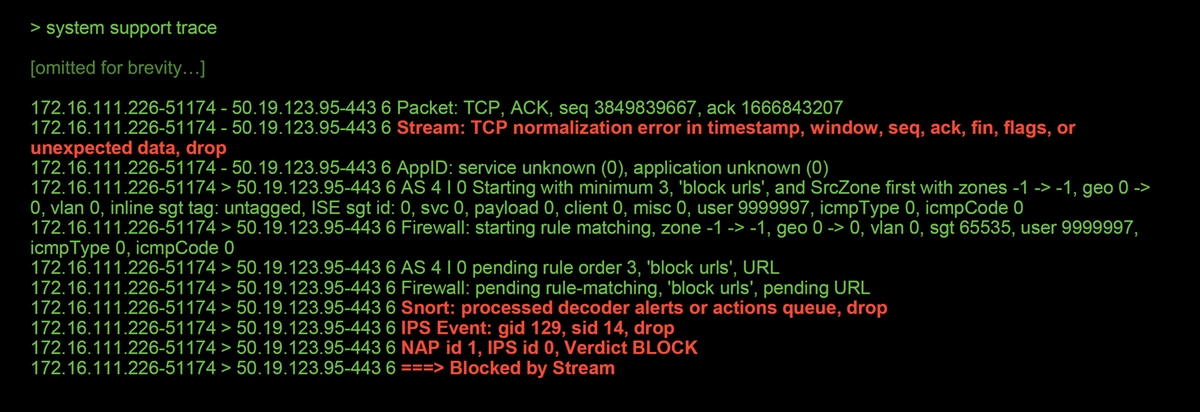
Note: Although the TCP Stream Configuration pre-processor drops the traffic, it is able to do so because the Inline Normalization preprocessor is also enabled. For more on Inline Normalization, you can read this article.
Verify NAP Configuration
On the Firepower Management Center (FMC) UI, the NAP can be viewed under Policies > Access Control > Intrusion. Then, click on the Network Analysis Policy option in the top right, after which you can view the NAPs, create new ones and edit existing ones.
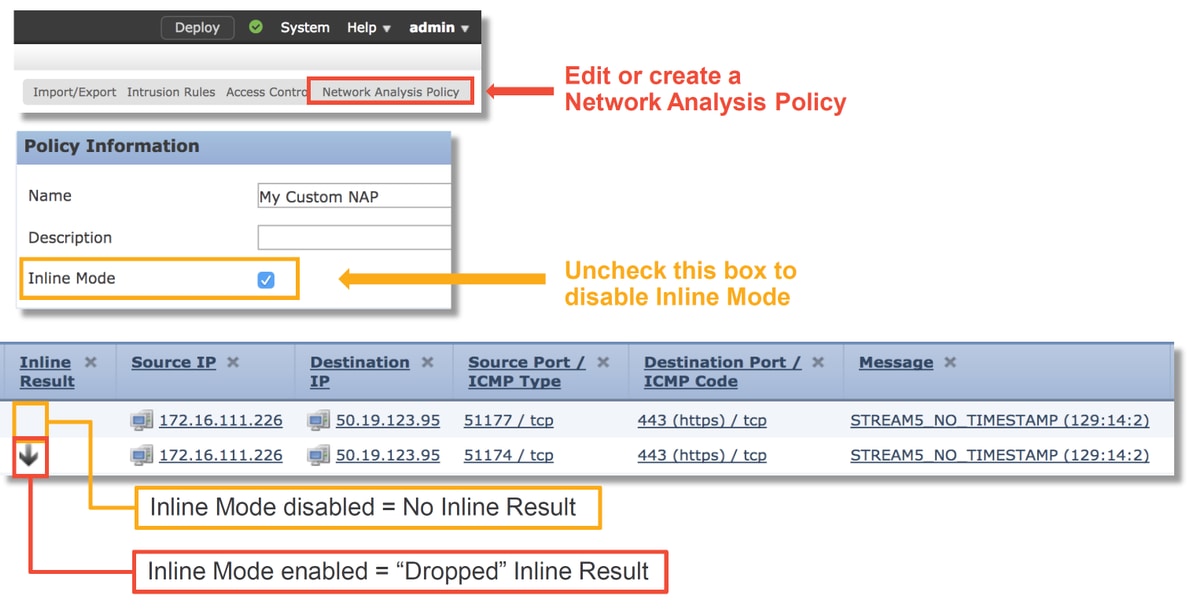
As seen in the illustration above, the NAPs contain an "Inline Mode" feature, which is the equivalent of the "Drop When Inline" option in the Intrusion Policy. A quick mitigation step for preventing the NAP from dropping traffic would be to uncheck Inline Mode. The Intrusion Events generated by the NAP don't display anything in the Inline Result tab with Inline Mode disabled.
View NAP Settings
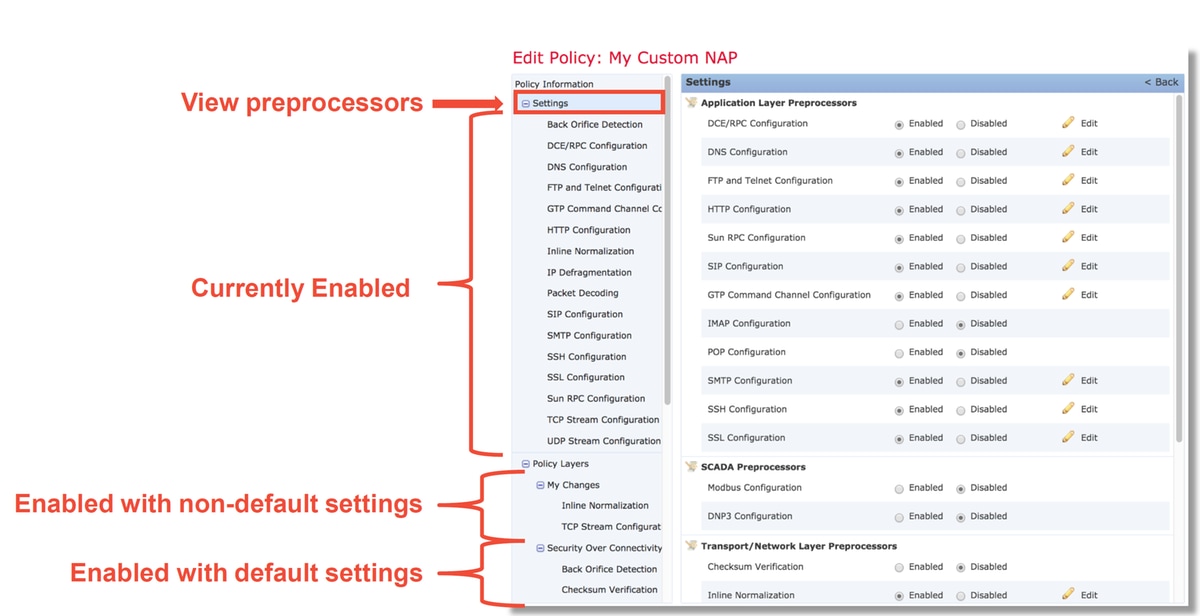
Within the NAP, you can view the current settings. This includes the total enabled preprocessors, followed by the
preprocessors enabled with non-default settings (ones which were manually tweaked) and ones which are enabled with default settings, as seen in the illustration below.
NAP Settings That Can Cause Silent Drops
In the example mentioned in the trace section, the rule TCP Stream Configuration rule 129:14 is dropping traffic. This is determined by looking at the system support trace output. However, if the said rule is not enabled within the respective Intrusion Policy, no Intrusion Events are sent to the FMC.
The reason why this happens is due to a setting within the Inline Normalization preprocessor called Block Unresolvable TCP Header Anomalies. This option basically allows Snort to perform a block action when certain GID 129 rules detect anomalies in the TCP stream.
If Block Unresolvable TCP Header Anomalies is enabled, it is recommended to turn on the GID 129 rules per the illustration below.
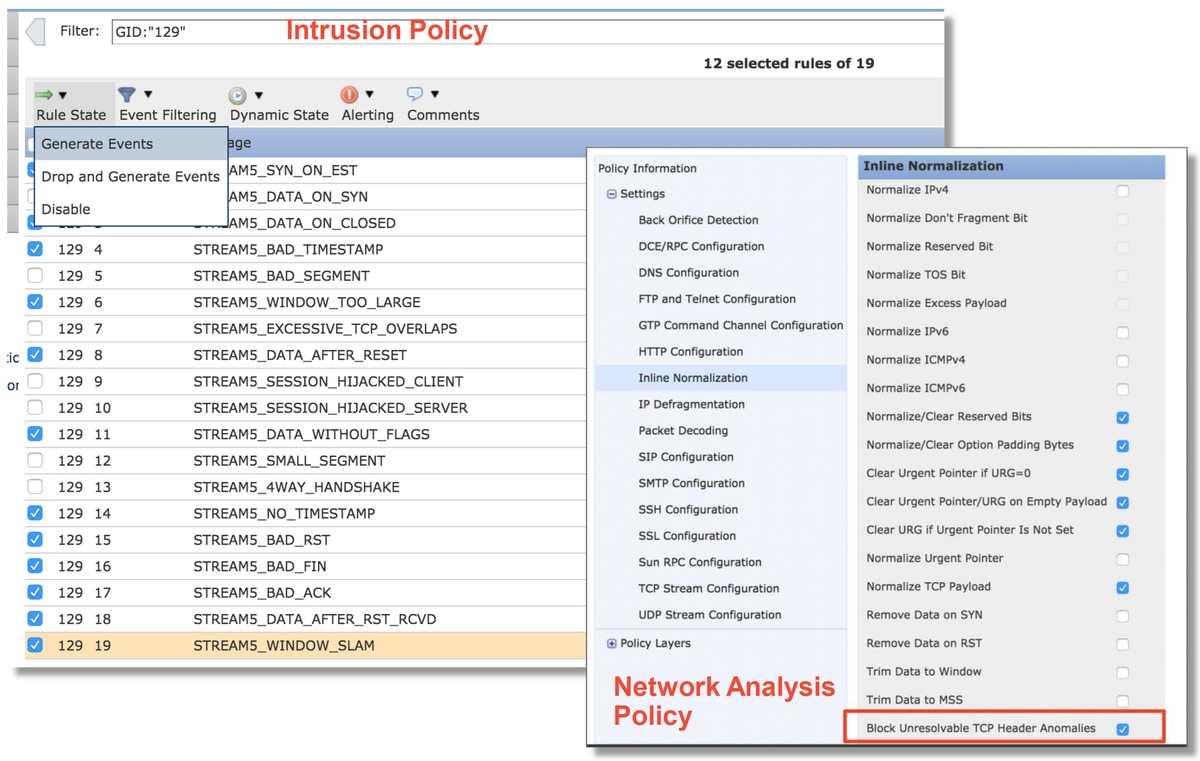
Turning on the GID 129 rules causes Intrusion Events to be sent to the FMC when they take action on the traffic. However, as long as the Block Unresolvable TCP Header Anomalies is enabled, it can still drop traffic even if the Rule State in the Intrusion Policy is set to only Generate Events. This behavior is explained in the FMC Configuration Guides.
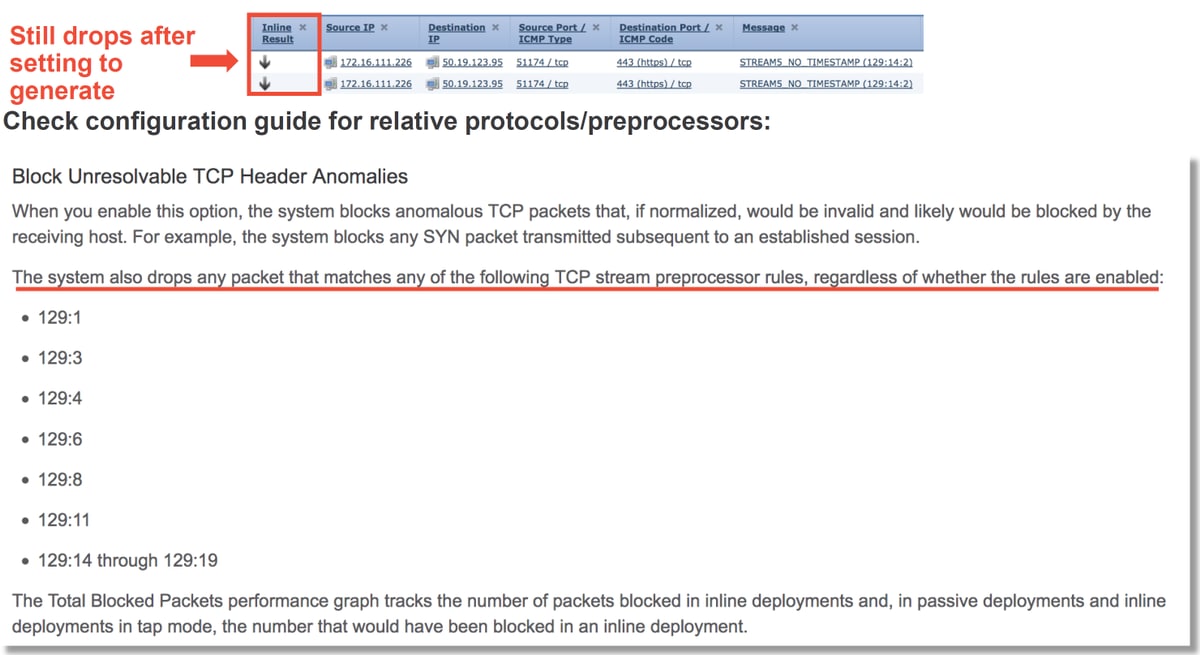
The above documentation can be found in this article (for version 6.4, which is the most recent version at the time of this article posting).
Verify the Backend Configuration
Another layer of complexity is added to the behavior of the preprocessor in that certain settings can be enabled on the backend, without being reflected in the FMC. These are some possible reasons.
- Other enabled features have the ability to force enable preprocessor settings (the main one being File Policy)
- Some Intrusion Policy rules require certain preprocessor options in order to perform detection
- A defect may cause the behavior
- We have seen one instance of this: CSCuz50295 - "File policy with Malware block enables TCP normalization with block flag"
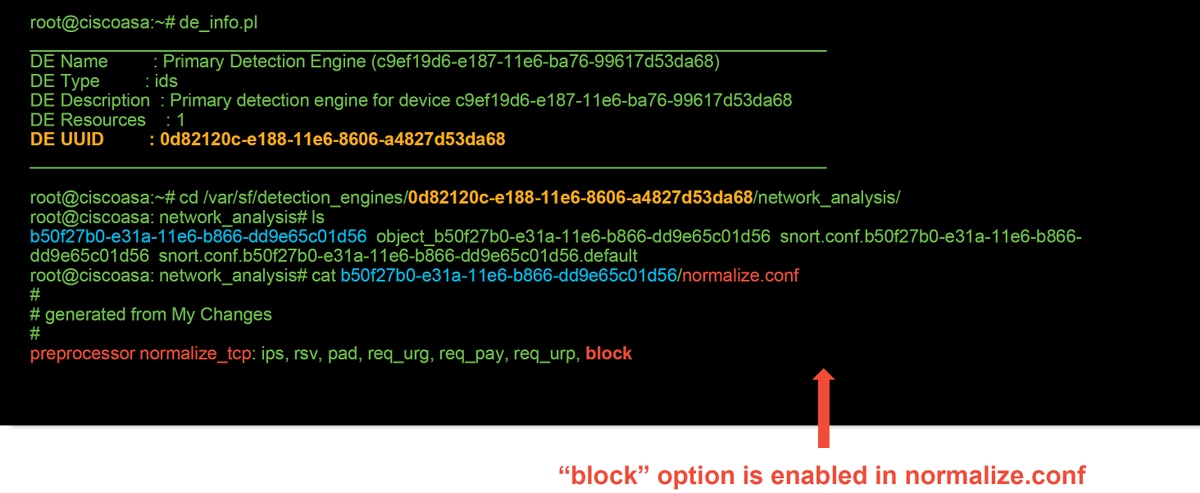
Before looking at the backend configuration, note that the Snort keywords, which are used in the backend Snort configuration files, can be seen by hovering over a specific setting within the NAP. Please refer to the illustration below.

The Block Unresolvable TCP Header Anomalies option in the NAP tab translates to the block keyword on the backend. With that information in mind, the backend configuration can be checked from the expert shell.
Creating a Targeted NAP
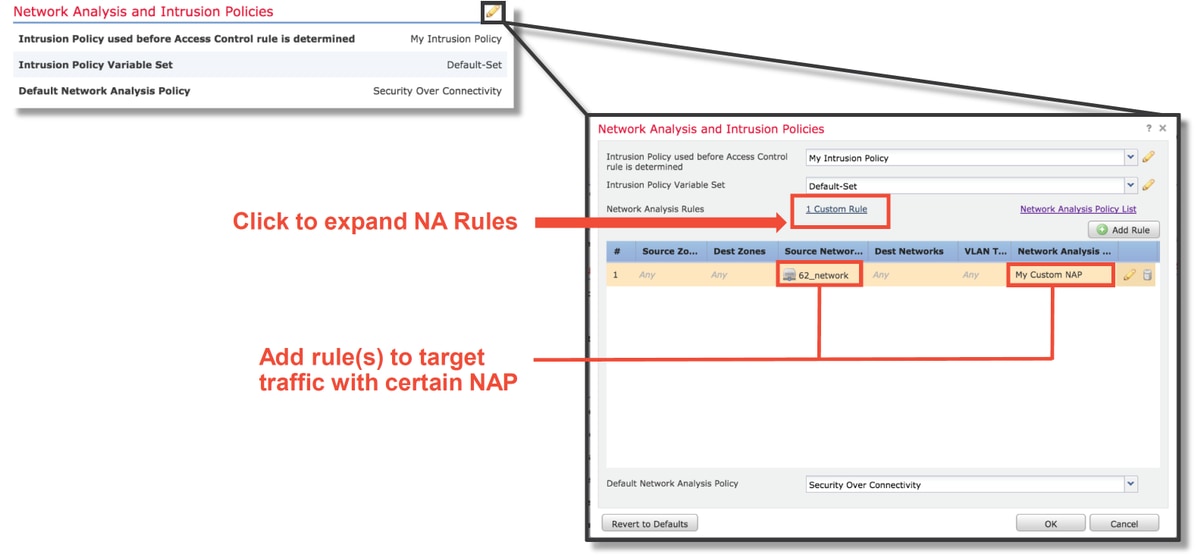
If certain hosts are triggering preprocessor events, a custom NAP can be used to inspect traffic to or from said hosts. Within the custom NAP, the settings which are causing issues can be disabled.
These are the steps for implementing a targeted NAP.
- Create the NAP per the instructions mentioned in Verify NAP configuration section of this article.
- In the Advanced tab of the Access Control Policy, navigate to the Network Analysis and Intrusion Policies section. Click Add Rule and create a rule, using the targeted hosts and choose the newly created NAP in the Network Analysis Policy section.
False Positive Analysis
Checking for false positives in Intrusion Events for preprocessor rules is quite different than that of the Snort rules used for rule evaluation (which contain a GID of 1 and 3).
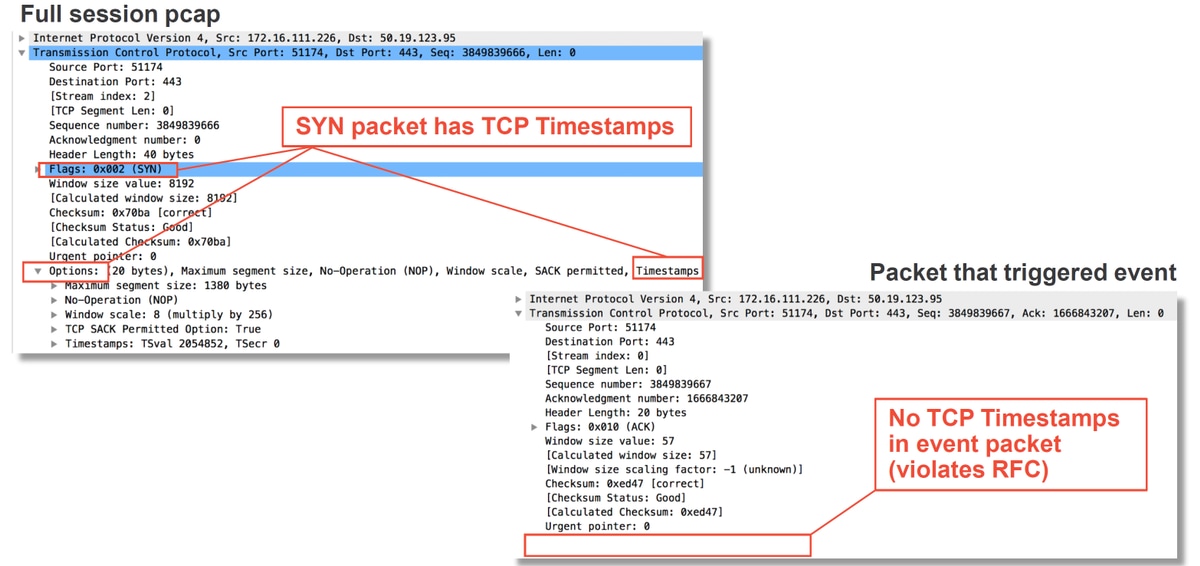
In order to perform a false positive analysis for preprocessor rule events, a full session capture is necessary to look for anomalies within the TCP stream.
In the example below, false positive analysis is being performed on rule 129:14, which is shown to be dropping traffic in the examples above. Since 129:14 is looking for TCP streams in which timestamps are missing, you can clearly see why the rule was triggered per the packet capture analysis illustrated below.
Mitigation Steps
To quickly mitigate possible issues with the NAP, the following steps can be performed.
- If a custom NAP is being used and you aren't sure if a NAP setting is dropping traffic but you suspect it might be, you can try replacing it with a "Balanced Security and Connectivity" or "Connectivity over Security" policy.
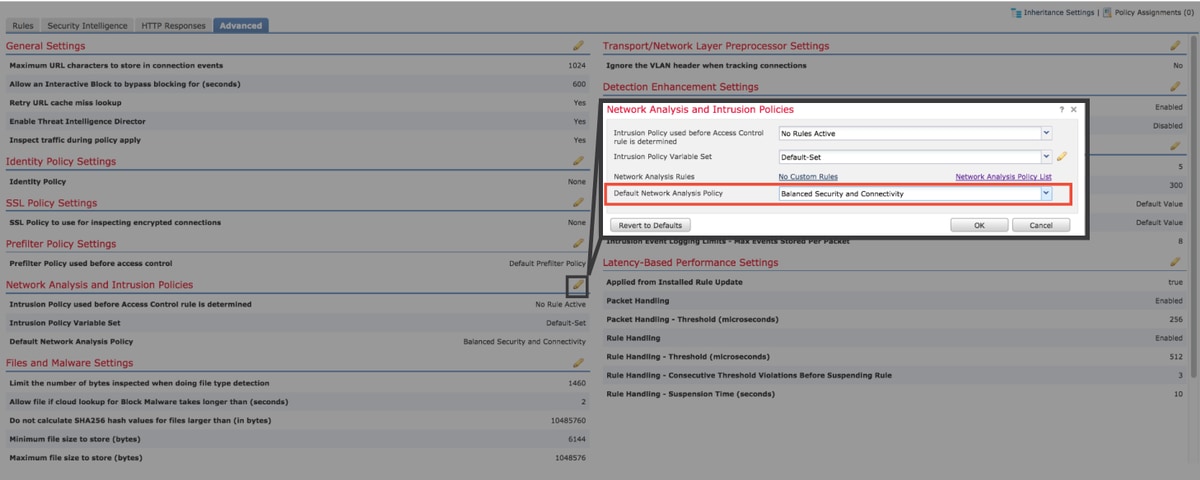
- If any "Custom Rules" are being used, make sure to set the NAP to one of the defaults mentioned above
- If any Access Control rules use a File Policy, you may need to try temporarily removing it as a File Policy can enable pre-processor settings on the backend which are not be reflected in the FMC, and this happens at a "global" level, meaning all NAPs are modified.
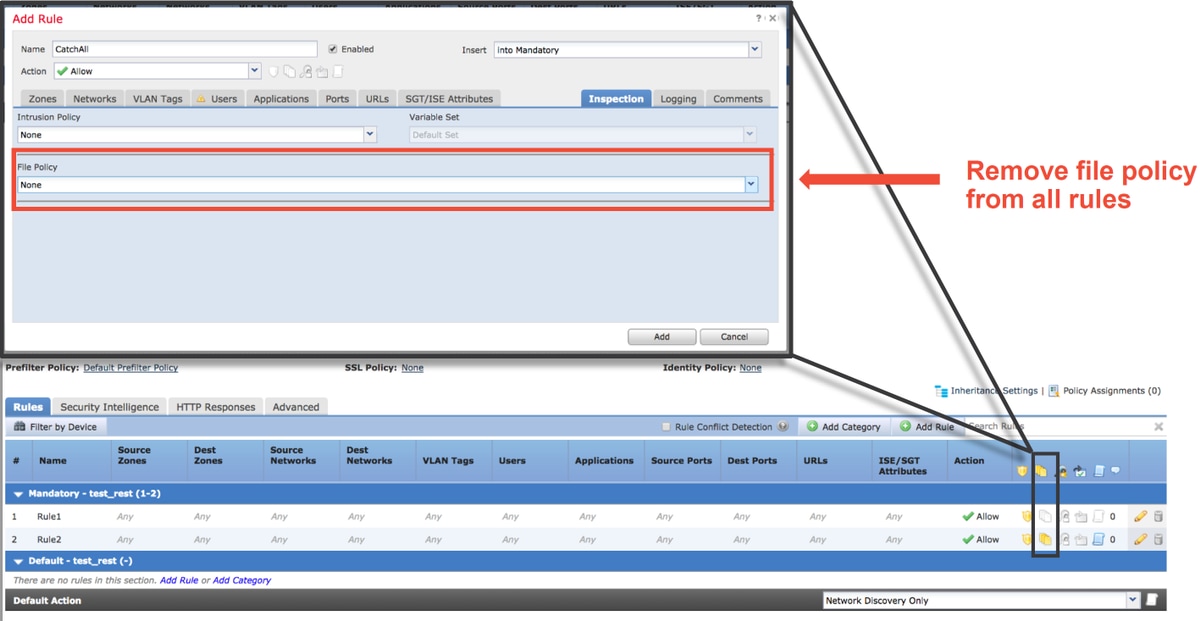
Each protocol has a different preprocessor and troubleshooting them can be very specific to the preprocessor. This article does not cover all preprocessor settings and troubleshooting methods for each.
You can check the documentation for each preprocessor to get a better idea of what each option does, which is helpful when troubleshooting a specific preprocessor.
Data to Provide to TAC
| Data | Instructions |
| Troubleshoot File from the Firepower Device | http://www.cisco.com/c/en/us/support/docs/security/sourcefire-defense-center/117663-technote-SourceFire-00.html |
| Full Session Packet Capture from the Firepower device | http://www.cisco.com/c/en/us/support/docs/security/sourcefire-firepower-8000-series-appliances/117778-technote-sourcefire-00.html |
Contributed by Cisco Engineers
- Created by John GroetzingerCisco Technical Leader
- Edited by John LongCisco QA Software Engineer
- Edited by Cesar Lopez ZamarripaCisco Technical Consultant Engineer
Contact Cisco
- Open a Support Case

- (Requires a Cisco Service Contract)
 Feedback