Troubleshoot Firepower Threat Defense IGMP and Multicast Basics
Available Languages
Download Options
Bias-Free Language
The documentation set for this product strives to use bias-free language. For the purposes of this documentation set, bias-free is defined as language that does not imply discrimination based on age, disability, gender, racial identity, ethnic identity, sexual orientation, socioeconomic status, and intersectionality. Exceptions may be present in the documentation due to language that is hardcoded in the user interfaces of the product software, language used based on RFP documentation, or language that is used by a referenced third-party product. Learn more about how Cisco is using Inclusive Language.
Contents
Introduction
This document describes the basics of multicast and how Firepower Threat Defense (FTD) implements the Internet Group Management Protocol (IGMP).
Prerequisites
Requirements
Basic IP routing knowledge.
Components Used
The information in this document was created from the devices in a specific lab environment. All of the devices used in this document started with a cleared (default) configuration. If your network is live, ensure that you understand the potential impact of any command.
The content of this article is also applicable to the Adaptive Security Appliance (ASA) software.
The information in this document is based on these software and hardware versions:
- Cisco Firepower 4125 Threat Defense Version 7.1.0.
- Firepower Management Center (FMC) Version 7.1.0.
- ASA version 9.19.1.
Background Information
Definitions
- Unicast = from a single host to another host (one-to-one).
- Broadcast = from a single host to ALL possible hosts (one-to-all).
- Multicast = from a host of a group of hosts to a group of hosts (one-to-many or many-to-many).
- Anycast = from a host to the nearest host of a group (one-to-one-of-many).
Basics
- Multicast RFC 988 was written in 1986 by Steve Deering.
- IPv4 Multicast uses the range 224.0.0.0/4 (first 4 bits 1110) – 224.0.0.0 – 239.255.255.255.
- For IPv4 the L2 MAC address derives from L3 multicast IP: 01005e (24 bits) + 25th bit always 0 + 23 lower bits of the multicast IPv4 address.
- IPv6 Multicast uses the range FF00::/8 and it is more flexible than IPv4 multicast since it can embed Rendezvous Point (RP) IP.
- For IPv6 the L2 MAC address derives from the L3 multicast: 3333 + 32 lower bits of the multicast IPv6 address.
- Multicast advantages: Efficiency due to reduced load on the source. Performance, since it avoids traffic duplication or flooding.
- Multicast disadvantages: Unreliable transport (UDP-based), no Congestion avoidance, out-of-sequence delivery.
- Multicast is not supported on the public Internet since it requires all devices in the path to enable it. Typically, used when all devices are under a common administrative authority.
- Typical Multicast Applications: Internal Video-stream, Video-conference.
Multicast vs Replicated Unicast
In Replicated Unicast the source creates multiple copies of the same unicast packet (replicas) and sends them to multiple destination hosts. Multicast moves the burden from the source host to the network, while in Replicated Unicast all the work is done on the source host.
Configure
IGMP basics
- IGMP is the ‘language’ spoken between the multicast receivers and the local L3 device (typically a router).
- IGMP is a layer 3 protocol (like ICMP) and uses IP Protocol number 2.
- There are currently 3 IGMP versions. The default IGMP version on the firewall is version 2. Only versions 1 and 2 are currently supported.
- Between IGMPv1 and IGMPv2 the main differences are:
- IGMPv1 has no Leave Group message.
- IGMPv1 has no Group-Specific Query (used by the firewall when a host leaves a multicast group).
- IGMPv1 has no querier election process.
- IGMPv3 is not currently supported on ASA/FTD, but as a reference, the important difference between IGMPv2 and IGMPv3 is the inclusion of a Group-and-Source-Specific Query in IGMPv3 which is used in Source-Specific Multicast (SSM).
- IGMPv1/IGMPv2/IGMPv3 Queries = 224.0.0.1
IGMPv2 Leave = 224.0.0.2
IGMPv3 Membership Report = 224.0.0.22 - If a host wants to join can send an unsolicited IGMP Membership Report message:

- From the firewall point of view, there are 2 types of IGMP Queries: General Queries and Group-specific Queries
- When the firewall receives an IGMP Leave Group message it has to check if there are other members of that group on the subnet. For that reason, the firewall sends a Group-Specific Query:

- On subnets where there are multiple routers/firewalls a querier (a device that sends all IGMP queries) is elected:
firepower# show igmp interface INSIDE
INSIDE is up, line protocol is up
  Internet address is 192.168.1.97/24
  IGMP is enabled on interface
  Current IGMP version is 2
  IGMP query interval is 125 seconds
  IGMP querier timeout is 60 seconds
  IGMP max query response time is 10 seconds
  Last member query response interval is 1 seconds
  Inbound IGMP access group is:
  IGMP limit is 500, currently active joins: 2
  Cumulative IGMP activity: 21 joins, 20 leaves
  IGMP querying router is 192.168.1.97 (this system)  <-- IGMP querier
- On FTD, similar to a classic ASA, you can enable debug igmp to see IGMP-related messages:
firepower# debug igmp
IGMP debugging is on
IGMP: Received v2 Query on DMZ from 192.168.6.1
IGMP: Received v2 Report on INSIDE from 192.168.1.50 for 239.255.255.250   <-- Received an IGMP packet
IGMP: group_db: add new group 239.255.255.250 on INSIDE
IGMP: MRIB updated (*,239.255.255.250) : Success
IGMP: Switching to EXCLUDE mode for 239.255.255.250 on INSIDE
IGMP: Updating EXCLUDE group timer for 239.255.255.250
IGMP: Received v2 Report on INSIDE from 192.168.1.50 for 230.10.10.10
IGMP: group_db: add new group 230.10.10.10 on INSIDE
IGMP: MRIB updated (*,230.10.10.10) : Success
IGMP: Switching to EXCLUDE mode for 230.10.10.10 on INSIDE
IGMP: Updating EXCLUDE group timer for 230.10.10.10
IGMP: Send v2 general Query on INSIDE
IGMP: Received v2 Query on INSIDE from 192.168.1.97
IGMP: Send v2 general Query on OUTSIDE
IGMP: Received v2 Query on OUTSIDE from 192.168.103.91
IGMP: Received v2 Report on INSIDE from 192.168.1.50 for 239.255.255.250
IGMP: Updating EXCLUDE group timer for 239.255.255.250
IGMP: Received v2 Report on INSIDE from 192.168.1.50 for 230.10.10.10
IGMP: Updating EXCLUDE group timer for 230.10.10.10
- A host normally leaves a multicast group with a Leave Group message (IGMPv2).

Task 1 - Control-Plane Multicast traffic
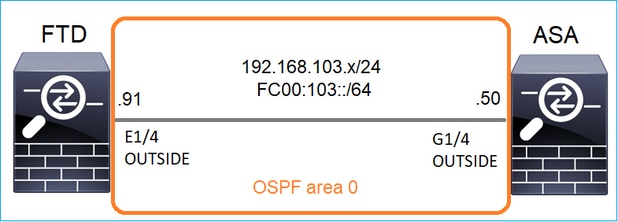
Configure an OSPFv2 and OSPFv3 between the FTD and the ASA. Check how the 2 devices handle the L2 and the L3 Multicast traffic generated by OSPF.
Solution
OSPFv2 configuration
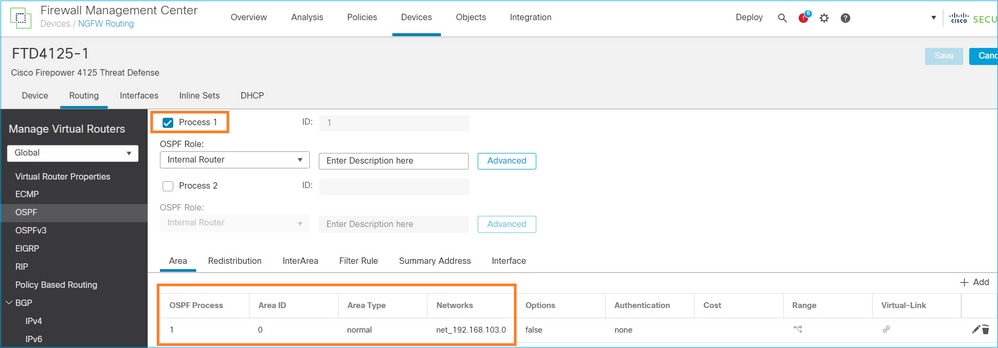

Similarly, for OSPFv3
Configuration on FTD CLI:
router ospf 1
 network 192.168.103.0 255.255.255.0 area 0
 log-adj-changes
!
ipv6 router ospf 1
 no graceful-restart helper
 log-adjacency-changes
!
interface Ethernet1/4
nameif OUTSIDE
security-level 0
ip address 192.168.103.91 255.255.255.0
ipv6 address fc00:103::91/64
ospf authentication null
ipv6 ospf 1 area 0
The configuration creates these entries in the FTD Accelerated Security Path (ASP) permit tables so that ingress multicast traffic is not blocked:
firepower# show asp table classify domain permit
...
in id=0x14f922db85f0, priority=13, domain=permit, deny=false         <-- permit the packets
        hits=1, user_data=0x0, cs_id=0x0, reverse, flags=0x0, protocol=89
        src ip/id=0.0.0.0, mask=0.0.0.0, port=0, tag=any
        dst ip/id=224.0.0.5, mask=255.255.255.255, port=0, tag=any, dscp=0x0, nsg_id=none     <-- OSPF for IPv4
        input_ifc=OUTSIDE(vrfid:0), output_ifc=identity(vrfid:0)     <-- ingress interface
in id=0x14f922db9350, priority=13, domain=permit, deny=false         <-- permit the packets
        hits=0, user_data=0x0, cs_id=0x0, reverse, flags=0x0, protocol=89
        src ip/id=0.0.0.0, mask=0.0.0.0, port=0, tag=any
        dst ip/id=224.0.0.6, mask=255.255.255.255, port=0, tag=any, dscp=0x0, nsg_id=none     <-- OSPF for IPv4
        input_ifc=OUTSIDE(vrfid:0), output_ifc=identity(vrfid:0)     <-- ingress interface
For IPv6:
...
in id=0x14f923fb16f0, priority=13, domain=permit, deny=false      <-- permit the packets
        hits=1, user_data=0x0, cs_id=0x0, reverse, flags=0x0, protocol=89
        src ip/id=::/0, port=0, tag=any
        dst ip/id=ff02::5/128, port=0, tag=any, , nsg_id=none     <-- OSPF for IPv6
        input_ifc=OUTSIDE(vrfid:0), output_ifc=identity(vrfid:0)  <-- ingress interface
in id=0x14f66e9d4780, priority=13, domain=permit, deny=false      <-- permit the packets
        hits=0, user_data=0x0, cs_id=0x0, reverse, flags=0x0, protocol=89
        src ip/id=::/0, port=0, tag=any
        dst ip/id=ff02::6/128, port=0, tag=any, , nsg_id=none     <-- OSPF for IPv6
        input_ifc=OUTSIDE(vrfid:0), output_ifc=identity(vrfid:0)  <-- ingress interface
...
The OSPFv2 and OSPFv3 adjacencies are UP:
firepower# show ospf neighbor
Neighbor ID Pri State Dead Time Address Interface
192.168.103.50 1 FULL/BDR 0:00:35 192.168.103.50 OUTSIDE   <-- OSPF neighbor is up

firepower# show ipv6 ospf neighbor
Neighbor ID Pri State Dead Time Interface ID Interface
192.168.103.50 1 FULL/BDR 0:00:34 3267035482 OUTSIDE       <-- OSPF neighbor is up
These are the multicast OSPF sessions terminated to the box:
firepower# show conn all | include OSPF
OSPF OUTSIDE fe80::2be:75ff:fef6:1d8e NP Identity Ifc ff02::5, idle 0:00:09, bytes 5924, flags
OSPF OUTSIDE 192.168.103.50 NP Identity Ifc 224.0.0.5, idle 0:00:03, bytes 8904, flags
OSPF OUTSIDE ff02::5 NP Identity Ifc fe80::f6db:e6ff:fe33:442e, idle 0:00:01, bytes 6304, flags
OSPF OUTSIDE 224.0.0.5 NP Identity Ifc 192.168.103.91, idle 0:00:00, bytes 25220, flags
As a test, enable capture for IPv4 and clear the connections to the device:
firepower# capture CAP interface OUTSIDE trace
firepower# clear conn all
12 connection(s) deleted.
firepower# clear capture CAP
firepower# !
Warning: This causes an outage! The example is shown for demonstration purposes only!
The captured OSPF packets:
firepower# show capture CAP | include proto-89
1: 12:25:33.142189 192.168.103.50 > 224.0.0.5 ip-proto-89, length 60
2: 12:25:33.702691 192.168.103.91 > 224.0.0.5 ip-proto-89, length 60
7: 12:25:36.317000 192.168.206.100 > 224.0.0.5 ip-proto-89, length 56
8: 12:25:36.952587 fe80::2be:75ff:fef6:1d8e > ff02::5 ip-proto-89 40 [flowlabel 0xe] [hlim 1]
12: 12:25:41.282608 fe80::f6db:e6ff:fe33:442e > ff02::5 ip-proto-89 40 [flowlabel 0xe] [hlim 1]
Here is how the OSPFv2 multicast packet is handled by the firewall:
firepower# show capture CAP packet-number 1 trace
115 packets captured

1: 12:25:33.142189 192.168.103.50 > 224.0.0.5 ip-proto-89, length 60    <-- The first packet of the flow
Phase: 1
Type: CAPTURE
Subtype:
Result: ALLOW
Elapsed time: 6344 ns
Config:
Additional Information:
MAC Access list

Phase: 2
Type: ACCESS-LIST
Subtype:
Result: ALLOW
Elapsed time: 6344 ns
Config:
Implicit Rule
Additional Information:
MAC Access list

Phase: 3
Type: ROUTE-LOOKUP
Subtype: No ECMP load balancing
Result: ALLOW
Elapsed time: 10736 ns
Config:
Additional Information:
Destination is locally connected. No ECMP load balancing.
Found next-hop 192.168.103.50 using egress ifc OUTSIDE(vrfid:0)

Phase: 4
Type: ACCESS-LIST
Subtype:
Result: ALLOW
Elapsed time: 5205 ns
Config:
Implicit Rule
Additional Information:

Phase: 5
Type: NAT
Subtype: per-session
Result: ALLOW
Elapsed time: 5205 ns
Config:
Additional Information:

Phase: 6
Type: IP-OPTIONS
Subtype:
Result: ALLOW
Elapsed time: 5205 ns
Config:
Additional Information:

Phase: 7
Type: CLUSTER-REDIRECT
Subtype: cluster-redirect
Result: ALLOW
Elapsed time: 29280 ns
Config:
Additional Information:

Phase: 8
Type: MULTICAST
Subtype:
Result: ALLOW
Elapsed time: 976 ns
Config:
Additional Information:

Phase: 9
Type: OSPF                   <-- The OSPF process
Subtype: ospf
Result: ALLOW
Elapsed time: 488 ns
Config:
Additional Information:

Phase: 10
Type: FLOW-CREATION
Subtype:
Result: ALLOW
Elapsed time: 13176 ns
Config:
Additional Information:
New flow created with id 620, packet dispatched to next module

Result:
input-interface: OUTSIDE(vrfid:0)
input-status: up
input-line-status: up
output-interface: OUTSIDE(vrfid:0)
output-status: up
output-line-status: up
Action: allow
Time Taken: 82959 ns
This is how the OSPFv3 multicast packet is handled by the firewall:
firepower# show capture CAP packet-number 8 trace
274 packets captured

8: 12:25:36.952587 fe80::2be:75ff:fef6:1d8e > ff02::5 ip-proto-89 40 [flowlabel 0xe] [hlim 1]  <-- The first packet of the flow
Phase: 1
Type: CAPTURE
Subtype:
Result: ALLOW
Elapsed time: 7564 ns
Config:
Additional Information:
MAC Access list

Phase: 2
Type: ACCESS-LIST
Subtype:
Result: ALLOW
Elapsed time: 7564 ns
Config:
Implicit Rule
Additional Information:
MAC Access list

Phase: 3
Type: ROUTE-LOOKUP
Subtype: No ECMP load balancing
Result: ALLOW
Elapsed time: 8296 ns
Config:
Additional Information:
Destination is locally connected. No ECMP load balancing.
Found next-hop ff02::5 using egress ifc identity(vrfid:0)

Phase: 4
Type: ACCESS-LIST
Subtype:
Result: ALLOW
Elapsed time: 8784 ns
Config:
Implicit Rule
Additional Information:

Phase: 5
Type: NAT
Subtype: per-session
Result: ALLOW
Elapsed time: 8784 ns
Config:
Additional Information:

Phase: 6
Type: CLUSTER-REDIRECT
Subtype: cluster-redirect
Result: ALLOW
Elapsed time: 27816 ns
Config:
Additional Information:

Phase: 7
Type: OSPF                    <-- The OSPF process
Subtype: ospf
Result: ALLOW
Elapsed time: 976 ns
Config:
Additional Information:

Phase: 8
Type: FLOW-CREATION
Subtype:
Result: ALLOW
Elapsed time: 13664 ns
Config:
Additional Information:
New flow created with id 624, packet dispatched to next module

Result:
input-interface: OUTSIDE(vrfid:0)
input-status: up
input-line-status: up
output-interface: NP Identity Ifc
Action: allow
Time Taken: 83448 ns
Task 2 – Configure Basic Multicast
Topology

Requirement
Configure the firewall so that multicast traffic from the server is streamed to the multicast client on IP 230.10.10.10
Solution
From the firewall point of view, the minimum configuration is to enable multicast routing globally. This enables in the background IGMP and PIM on all firewall interfaces.
On FMC UI:
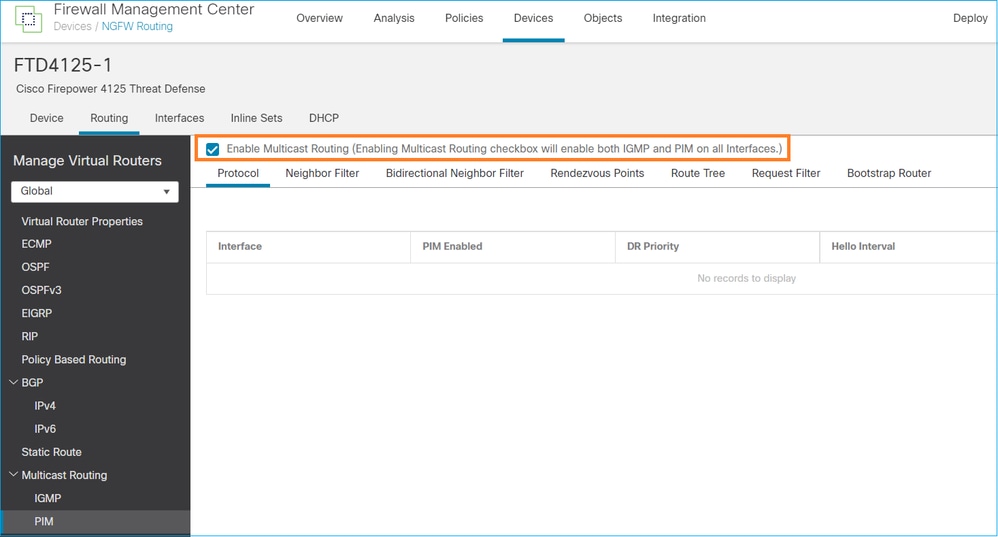
On the firewall CLI this is the pushed configuration:
firepower# show run multicast-routing
multicast-routing                   <-- Multicast routing is enabled
IGMP Verification
firepower# show igmp interface
diagnostic is up, line protocol is up
  Internet address is 0.0.0.0/0
  IGMP is disabled on interface
INSIDE is up, line protocol is up          <-- The interface is UP
  Internet address is 192.168.1.24/24
  IGMP is enabled on interface             <-- IGMP is enabled on the interface
  Current IGMP version is 2                <-- IGMP version
  IGMP query interval is 125 seconds
  IGMP querier timeout is 255 seconds
  IGMP max query response time is 10 seconds
  Last member query response interval is 1 seconds
  Inbound IGMP access group is:
  IGMP limit is 500, currently active joins: 1
  Cumulative IGMP activity: 4 joins, 3 leaves
  IGMP querying router is 192.168.1.24 (this system)
OUTSIDE is up, line protocol is up         <-- The interface is UP
  Internet address is 192.168.103.91/24
  IGMP is enabled on interface             <-- IGMP is enabled on the interface
  Current IGMP version is 2                <-- IGMP version
  IGMP query interval is 125 seconds
  IGMP querier timeout is 255 seconds
  IGMP max query response time is 10 seconds
  Last member query response interval is 1 seconds
  Inbound IGMP access group is:
  IGMP limit is 500, currently active joins: 1
  Cumulative IGMP activity: 1 joins, 0 leaves
  IGMP querying router is 192.168.103.91 (this system)
firepower# show igmp group
IGMP Connected Group Membership
Group Address Interface Uptime Expires Last Reporter
239.255.255.250 INSIDE 00:09:05 00:03:19 192.168.1.50
239.255.255.250 OUTSIDE 00:06:01 00:02:33 192.168.103.60
firepower# show igmp traffic
IGMP Traffic Counters
Elapsed time since counters cleared: 03:40:48 Received Sent

                              Received     Sent
Valid IGMP Packets            21           207
Queries                       0            207
Reports                       15           0       <-- IGMP Reports received and sent
Leaves                        6            0
Mtrace packets                0            0
DVMRP packets                 0            0
PIM packets                   0            0

Errors:
Malformed Packets             0
Martian source                0
Bad Checksums                 0
PIM Verification
firepower# show pim interface

Address          Interface          PIM  Nbr   Hello  DR         DR
                                       Count Intvl  Prior

0.0.0.0          diagnostic         off  0     30     1          not elected
192.168.1.24     INSIDE             on   0     30     1          this system
192.168.103.91   OUTSIDE            on   0     30     1          this system
MFIB Verification
firepower# show mfib
Entry Flags: C - Directly Connected, S - Signal, IA - Inherit A flag,
             AR - Activity Required, K - Keepalive
Forwarding Counts: Pkt Count/Pkts per second/Avg Pkt Size/Kbits per second
Other counts: Total/RPF failed/Other drops
Interface Flags: A - Accept, F - Forward, NS - Negate Signalling
             IC - Internal Copy, NP - Not platform switched
             SP - Signal Present
Interface Counts: FS Pkt Count/PS Pkt Count

(*,224.0.1.39) Flags: S K
   Forwarding: 0/0/0/0, Other: 0/0/0   <-- The Forwarding counters are: Pkt Count/Pkts per second/Avg Pkt Size/Kbits per second
(*,224.0.1.40) Flags: S K
   Forwarding: 0/0/0/0, Other: 8/8/0   <-- The Other counters are: Total/RPF failed/Other drops
(*,232.0.0.0/8) Flags: K
   Forwarding: 0/0/0/0, Other: 0/0/0
Multicast traffic through the firewall
In this case, the VLC media player application is used as a multicast server and a client to test multicast traffic:

VLC multicast server configuration:
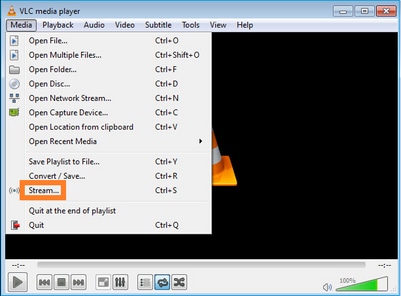
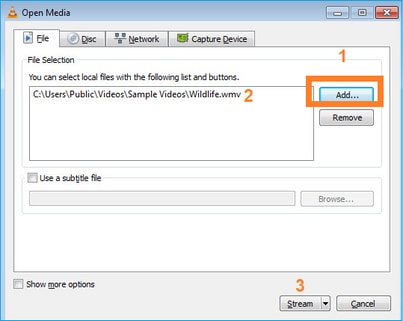
On the next screen just select Next.
Select the format:
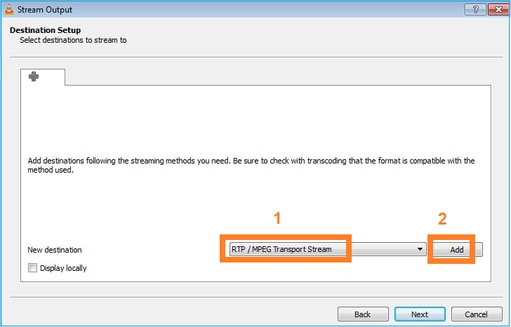
Specify the multicast IP and port:
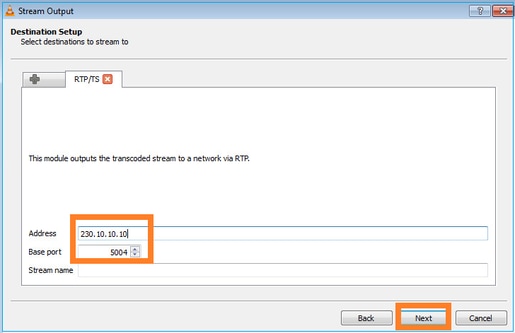
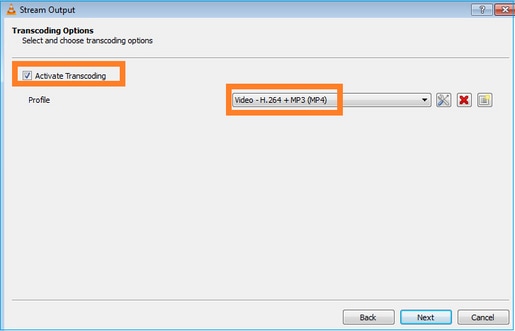
Enable LINA captures on the FTD firewall:
firepower# capture INSIDE interface INSIDE match ip host 192.168.103.60 host 230.10.10.10
firepower# capture OUTSIDE interface OUTSIDE trace match ip host 192.168.103.60 host 230.10.10.10
Select the Stream button for the device to start the multicast stream:
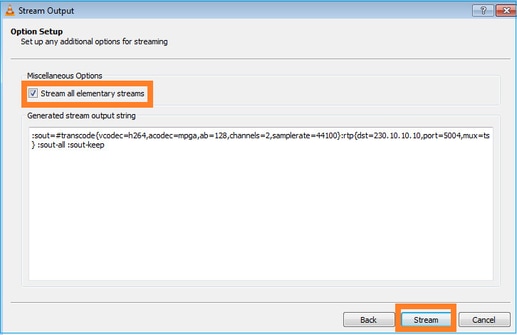
Enable the ‘loop’ option so that the stream is sent continuously:

Verification (non-operational scenario)
This scenario is a demonstration of a non-operational scenario. The goal is to demonstrate the firewall behavior.
The firewall device gets the multicast stream, but does not forward it:
firepower# show capture
capture INSIDE type raw-data interface INSIDE [Capturing - 0 bytes]     <-- No packets sent or received
match ip host 192.168.103.60 host 230.10.10.10
capture OUTSIDE type raw-data trace interface OUTSIDE [Buffer Full - 524030 bytes]  <-- The buffer is full
match ip host 192.168.103.60 host 230.10.10.10
Firewall LINA ASP drops show:
firepower# clear asp drop
firepower# show asp drop

Frame drop:
  Punt rate limit exceeded (punt-rate-limit)                         232  <-- The multicast packets were dropped
  Flow is denied by configured rule (acl-drop)                         2
  FP L2 rule drop (l2_acl)                                             2

Last clearing: 18:38:42 UTC Oct 12 2018 by enable_15

Flow drop:

Last clearing: 08:45:41 UTC May 17 2022 by enable_15
To trace a packet there is a need to capture the first packet of the multicast flow. For this reason clear the current flows:
firepower# clear capture OUTSIDE
firepower# clear conn all addr 230.10.10.10
2 connection(s) deleted.

firepower# show capture OUTSIDE

379 packets captured

1: 08:49:04.537875 192.168.103.60.54100 > 230.10.10.10.5005: udp 64
2: 08:49:04.537936 192.168.103.60.54099 > 230.10.10.10.5004: udp 1328
3: 08:49:04.538027 192.168.103.60.54099 > 230.10.10.10.5004: udp 1328
4: 08:49:04.538058 192.168.103.60.54099 > 230.10.10.10.5004: udp 1328
5: 08:49:04.538058 192.168.103.60.54099 > 230.10.10.10.5004: udp 1328
6: 08:49:04.538073 192.168.103.60.54099 > 230.10.10.10.5004: udp 1328
...
The ‘detail’ option reveals the multicast MAC address:
firepower# show capture OUTSIDE detail

379 packets captured

1: 08:49:04.537875 0050.569d.344a 0100.5e0a.0a0a 0x0800 Length: 106
192.168.103.60.54100 > 230.10.10.10.5005: [udp sum ok] udp 64 (ttl 100, id 19759)
2: 08:49:04.537936 0050.569d.344a 0100.5e0a.0a0a 0x0800 Length: 1370
192.168.103.60.54099 > 230.10.10.10.5004: [udp sum ok] udp 1328 (ttl 100, id 19760)
3: 08:49:04.538027 0050.569d.344a 0100.5e0a.0a0a 0x0800 Length: 1370
192.168.103.60.54099 > 230.10.10.10.5004: [udp sum ok] udp 1328 (ttl 100, id 19761)
...
The trace of a real packet shows that the packet is allowed, but this is not what really happens:
firepower# show capture OUTSIDE packet-number 1 trace
379 packets captured

1: 08:49:04.537875 192.168.103.60.54100 > 230.10.10.10.5005: udp 64
Phase: 1
Type: CAPTURE
Subtype:
Result: ALLOW
Elapsed time: 11712 ns
Config:
Additional Information:
MAC Access list

Phase: 2
Type: ACCESS-LIST
Subtype:
Result: ALLOW
Elapsed time: 11712 ns
Config:
Implicit Rule
Additional Information:
MAC Access list

Phase: 3
Type: ROUTE-LOOKUP
Subtype: No ECMP load balancing
Result: ALLOW
Elapsed time: 7808 ns
Config:
Additional Information:
Destination is locally connected. No ECMP load balancing.
Found next-hop 192.168.103.60 using egress ifc OUTSIDE(vrfid:0)

Phase: 4
Type: ACCESS-LIST
Subtype: log
Result: ALLOW
Elapsed time: 5246 ns
Config:
access-group CSM_FW_ACL_ global
access-list CSM_FW_ACL_ advanced permit ip any any rule-id 268434432
access-list CSM_FW_ACL_ remark rule-id 268434432: ACCESS POLICY: mzafeiro_empty - Default
access-list CSM_FW_ACL_ remark rule-id 268434432: L4 RULE: DEFAULT ACTION RULE
Additional Information:
This packet will be sent to snort for additional processing where a verdict will be reached

Phase: 5
Type: CONN-SETTINGS
Subtype:
Result: ALLOW
Elapsed time: 5246 ns
Config:
class-map class-default
match any
policy-map global_policy
class class-default
set connection advanced-options UM_STATIC_TCP_MAP
service-policy global_policy global
Additional Information:

Phase: 6
Type: NAT
Subtype: per-session
Result: ALLOW
Elapsed time: 5246 ns
Config:
Additional Information:

Phase: 7
Type: IP-OPTIONS
Subtype:
Result: ALLOW
Elapsed time: 5246 ns
Config:
Additional Information:

Phase: 8
Type: CLUSTER-REDIRECT
Subtype: cluster-redirect
Result: ALLOW
Elapsed time: 31232 ns
Config:
Additional Information:

Phase: 9
Type: MULTICAST       <-- multicast process
Subtype:
Result: ALLOW
Elapsed time: 976 ns
Config:
Additional Information:

Phase: 10
Type: FLOW-CREATION   <-- the packet belongs to a new flow
Subtype:
Result: ALLOW
Elapsed time: 20496 ns
Config:
Additional Information:
New flow created with id 3705, packet dispatched to next module

Result:
input-interface: OUTSIDE(vrfid:0)
input-status: up
input-line-status: up
output-interface: OUTSIDE(vrfid:0)
output-status: up
output-line-status: up
Action: allow            <-- The packet is allowed
Time Taken: 104920 ns
Based on the mroute and mfib counters, the packets are dropped because the Outgoing Interface List (OIL) is empty:
firepower# show mroute

Multicast Routing Table
Flags: D - Dense, S - Sparse, B - Bidir Group, s - SSM Group,
C - Connected, L - Local, I - Received Source Specific Host Report,
P - Pruned, R - RP-bit set, F - Register flag, T - SPT-bit set,
J - Join SPT
Timers: Uptime/Expires
Interface state: Interface, State

(192.168.103.60, 230.10.10.10), 00:01:33/00:01:56, flags: SPF
Incoming interface: OUTSIDE
RPF nbr: 192.168.103.60
Outgoing interface list: Null        <-- The OIL is empty!

(*, 239.255.255.250), 00:01:50/never, RP 0.0.0.0, flags: SCJ
Incoming interface: Null
RPF nbr: 0.0.0.0
Immediate Outgoing interface list:
INSIDE, Forward, 00:01:50/never
The MFIB counters show RPF failures which in this case is not the what really happens:
firepower# show mfib 230.10.10.10
Entry Flags: C - Directly Connected, S - Signal, IA - Inherit A flag,
             AR - Activity Required, K - Keepalive
firepower# show mfib 230.10.10.10
Entry Flags: C - Directly Connected, S - Signal, IA - Inherit A flag,
AR - Activity Required, K - Keepalive
Forwarding Counts: Pkt Count/Pkts per second/Avg Pkt Size/Kbits per second   <-- Multicast forwarding counters
Other counts: Total/RPF failed/Other drops            <-- Multicast drop counters
Interface Flags: A - Accept, F - Forward, NS - Negate Signalling
             IC - Internal Copy, NP - Not platform switched
             SP - Signal Present
Interface Counts: FS Pkt Count/PS Pkt Count

(192.168.103.60,230.10.10.10) Flags: K
   Forwarding: 0/0/0/0, Other: 650/650/0       <-- Allowed and dropped multicast packets
Similar RPF failures in the 'show mfib count' output:
firepower# show mfib count
IP Multicast Statistics
8 routes, 4 groups, 0.25 average sources per group
Forwarding Counts: Pkt Count/Pkts per second/Avg Pkt Size/Kilobits per second
Other counts: Total/RPF failed/Other drops(OIF-null, rate-limit etc)
Group: 224.0.1.39
  RP-tree:
    Forwarding: 0/0/0/0, Other: 0/0/0
Group: 224.0.1.40
  RP-tree:
    Forwarding: 0/0/0/0, Other: 0/0/0
Group: 230.10.10.10
  Source: 192.168.103.60,
    Forwarding: 0/0/0/0, Other: 1115/1115/0   <-- Allowed and dropped multicast packets
  Tot. shown: Source count: 1, pkt count: 0
Group: 232.0.0.0/8
  RP-tree:
    Forwarding: 0/0/0/0, Other: 0/0/0
Group: 239.255.255.250
  RP-tree:
    Forwarding: 0/0/0/0, Other: 0/0/0
Configure the VLC multicast receiver:
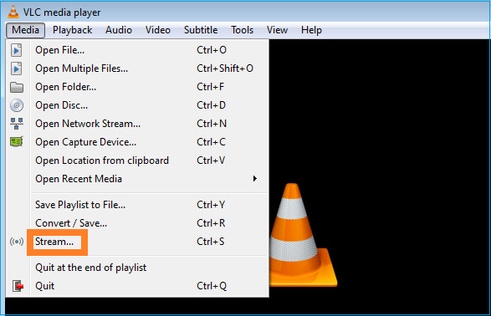
Specify the multicast source IP and select Play:
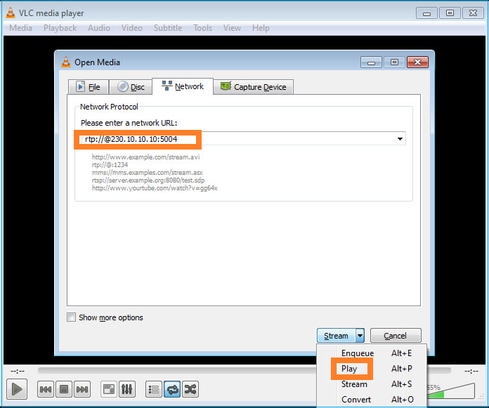
In the backend, as soon as you select Play the host announces its willingness to join the specific multicast group and sends an IGMP Report message:

If you enable a debug, you can see the IGMP report messages:
firepower# debug igmp group 230.10.10.10
IGMP: Received v2 Report on INSIDE from 192.168.1.50 for 230.10.10.10  <-- IGMPv2 Report received
IGMP: group_db: add new group 230.10.10.10 on INSIDE
IGMP: MRIB updated (*,230.10.10.10) : Success
IGMP: Switching to EXCLUDE mode for 230.10.10.10 on INSIDE
IGMP: Updating EXCLUDE group timer for 230.10.10.10
The stream starts:
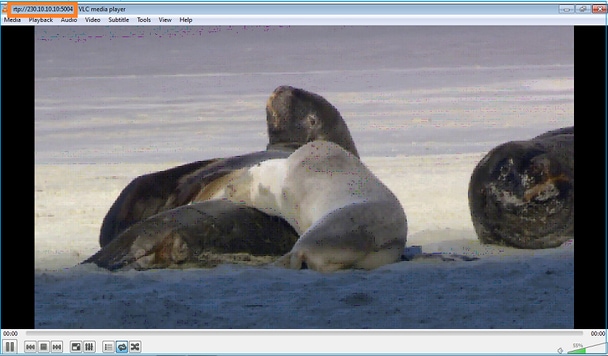
Verification (operational scenario)
firepower# show capture
capture INSIDE type raw-data interface INSIDE [Buffer Full - 524156 bytes]    <-- Multicast packets on the egress interface
match ip host 192.168.103.60 host 230.10.10.10
capture OUTSIDE type raw-data trace interface OUTSIDE [Buffer Full - 524030 bytes]   <-- Multicast packets on the ingress interface
match ip host 192.168.103.60 host 230.10.10.10
The mroute table of the firewall:
firepower# show mroute
Multicast Routing Table
Flags: D - Dense, S - Sparse, B - Bidir Group, s - SSM Group,
       C - Connected, L - Local, I - Received Source Specific Host Report,
       P - Pruned, R - RP-bit set, F - Register flag, T - SPT-bit set,
       J - Join SPT
Timers: Uptime/Expires
Interface state: Interface, State

(*, 230.10.10.10), 00:00:34/never, RP 0.0.0.0, flags: SCJ
  Incoming interface: Null
  RPF nbr: 0.0.0.0
  Immediate Outgoing interface list:
    INSIDE, Forward, 00:00:34/never

(192.168.103.60, 230.10.10.10), 00:01:49/00:03:29, flags: SFJT
  Incoming interface: OUTSIDE
  RPF nbr: 192.168.103.60
  Inherited Outgoing interface list:
    INSIDE, Forward, 00:00:34/never        <-- The OIL shows an interface
firepower# show mfib 230.10.10.10
Entry Flags: C - Directly Connected, S - Signal, IA - Inherit A flag,
             AR - Activity Required, K - Keepalive
Forwarding Counts: Pkt Count/Pkts per second/Avg Pkt Size/Kbits per second
Other counts: Total/RPF failed/Other drops
Interface Flags: A - Accept, F - Forward, NS - Negate Signalling
             IC - Internal Copy, NP - Not platform switched
             SP - Signal Present
Interface Counts: FS Pkt Count/PS Pkt Count

(*,230.10.10.10) Flags: C K
  Forwarding: 0/0/0/0, Other: 0/0/0
  INSIDE Flags: F NS
    Pkts: 0/0
(192.168.103.60,230.10.10.10) Flags: K
  Forwarding: 6373/0/1354/0, Other: 548/548/0      <-- There are multicast packets forwarded
  OUTSIDE Flags: A
  INSIDE Flags: F NS
    Pkts: 6373/6
mfib counters:
firepower# show mfib count
IP Multicast Statistics
10 routes, 5 groups, 0.40 average sources per group
Forwarding Counts: Pkt Count/Pkts per second/Avg Pkt Size/Kilobits per second
Other counts: Total/RPF failed/Other drops(OIF-null, rate-limit etc)
Group: 224.0.1.39
  RP-tree:
    Forwarding: 0/0/0/0, Other: 0/0/0
Group: 224.0.1.40
  RP-tree:
    Forwarding: 0/0/0/0, Other: 0/0/0
Group: 230.10.10.10
  RP-tree:
    Forwarding: 0/0/0/0, Other: 0/0/0
  Source: 192.168.103.60,
    Forwarding: 7763/0/1354/0, Other: 548/548/0   <-- There are multicast packets forwarded
  Tot. shown: Source count: 1, pkt count: 0
Group: 232.0.0.0/8
  RP-tree:
    Forwarding: 0/0/0/0, Other: 0/0/0
Group: 239.255.255.250
  RP-tree:
    Forwarding: 0/0/0/0, Other: 0/0/0
  Source: 192.168.1.50,
    Forwarding: 7/0/500/0, Other: 0/0/0
  Tot. shown: Source count: 1, pkt count: 0
IGMP Snooping
- IGMP Snooping is a mechanism used on switches in order to prevent multicast flooding.
- The switch monitors IGMP Reports to determine where are hosts (receivers) located.
- The switch monitors IGMP Queries to determine where are routers/firewalls (senders) located.
- IGMP Snooping is enabled by default on most Cisco switches. Check the related switching guides for more details. Here is the sample output from an L3 Catalyst switch:
switch# show ip igmp snooping statistics

  Current number of Statistics entries    : 15
  Configured Statistics database limit    : 32000
  Configured Statistics database threshold: 25600
  Configured Statistics database limit    : Not exceeded
  Configured Statistics database threshold: Not exceeded

Snooping statistics for Vlan204
#channels: 3
#hosts   : 5

Source/Group                    Interface       Reporter        Uptime   Last-Join Last-Leave
0.0.0.0/230.10.10.10            Vl204:Gi1/48    192.168.1.50    2d13h        -     2d12h
0.0.0.0/230.10.10.10            Vl204:Gi1/48    192.168.1.97    2d13h    2d12h         -
0.0.0.0/230.10.10.10            Vl204:Gi2/1     192.168.1.50    2d10h    02:20:05  02:20:00
0.0.0.0/239.255.255.250         Vl204:Gi2/1     192.168.1.50    2d11h    02:20:05  02:20:00
0.0.0.0/239.255.255.250         Vl204:Gi2/1     192.168.2.50    2d14h    2d13h         -
0.0.0.0/239.255.255.250         Vl204:Gi2/1     192.168.6.50    2d13h        -     2d13h
0.0.0.0/224.0.1.40              Vl204:Gi2/26    192.168.2.1     2d14h    00:00:39  2d13h

Snooping statistics for Vlan206
#channels: 4
#hosts   : 3

Source/Group                    Interface       Reporter        Uptime   Last-Join Last-Leave
0.0.0.0/230.10.10.10            Vl206:Gi1/48    192.168.6.91    00:30:15 2d13h     2d13h
0.0.0.0/239.10.10.10            Vl206:Gi1/48    192.168.6.91    2d14h    2d13h         -
0.0.0.0/239.255.255.250         Vl206:Gi2/1     192.168.6.50    2d12h    00:52:49  00:52:45
0.0.0.0/224.0.1.40              Vl206:Gi2/26    192.168.6.1     00:20:10 2d13h     2d13h
0.0.0.0/230.10.10.10            Vl206:Gi2/26    192.168.6.1     2d13h    2d13h         -
0.0.0.0/230.10.10.10            Vl206:Gi2/26    192.168.6.91    2d13h        -     2d13h
0.0.0.0/239.10.10.10            Vl206:Gi2/26    192.168.6.1     2d14h    2d14h         -
0.0.0.0/239.10.10.10            Vl206:Gi2/26    192.168.6.91    2d14h        -     2d14h
Task 3 – IGMP static-group vs IGMP join-group
Overview
| ip igmp static-group | ip igmp join-group | |
| Applied on FTD interface? | Yes | Yes |
| Does the FTD attract a multicast stream? | Yes, a PIM Join is sent towards the upstream device. the source or towards the Rendezvous Point (RP). This only occurs if the FTD with this command is the PIM Designated Router (DR) on that interface. | Yes, a PIM Join is sent towards the upstream device. the source or towards the Rendezvous Point (RP). This only occurs if the FTD with this command is the PIM Designated Router (DR) on that interface. |
| Does the FTD forward multicast traffic out of the interface? | Yes | Yes |
| Does the FTD consume and reply to the multicast traffic | No | Yes, the FTD punts the multicast stream to the CPU, consumes it, and replies to the source. |
| CPU impact |
Minimal since the packet is not punted to CPU. | Can affect the FTD CPU since each multicast packet that belongs to the group is punted to the FTD CPU. |
Task Requirement
Consider this topology:

On the firewall enable these captures:
firepower# capture CAPI interface OUTSIDE trace match icmp host 192.168.103.62 any
firepower# capture CAPO interface INSIDE match icmp host 192.168.103.62 any
- Use ICMP ping from the L3 switch to send multicast traffic to IP 230.11.11.11 and check how this is handled by the firewall.
- Enable the igmp static-group command on the firewall INSIDE interface and check how the multicast stream (IP 230.11.11.11) is handled by the firewall.
- Enable the igmp static-group command on the firewall INSIDE interface and check how the multicast stream (IP 230.11.11.11) is handled by the firewall.
Solution
The firewall does not have any mroutes for the IP 230.11.11.11:
firepower# show mroute

Multicast Routing Table
Flags: D - Dense, S - Sparse, B - Bidir Group, s - SSM Group,
       C - Connected, L - Local, I - Received Source Specific Host Report,
       P - Pruned, R - RP-bit set, F - Register flag, T - SPT-bit set,
       J - Join SPT
Timers: Uptime/Expires
Interface state: Interface, State

(*, 239.255.255.250), 00:43:21/never, RP 0.0.0.0, flags: SCJ
  Incoming interface: Null
  RPF nbr: 0.0.0.0
  Immediate Outgoing interface list:
    OUTSIDE, Forward, 00:05:41/never
    INSIDE, Forward, 00:43:21/never
A simple way to test multicast is to use the ICMP ping tool. In this case, initiate a ping from the R2 to the multicast IP address 230.11.11.11:
L3-Switch# ping 230.11.11.11 re 100
Type escape sequence to abort.
Sending 100, 100-byte ICMP Echos to 230.11.11.11, timeout is 2 seconds:
...............................
On the firewall, an mroute is created dynamically and the OIL is empty:
firepower# show mroute

Multicast Routing Table
Flags: D - Dense, S - Sparse, B - Bidir Group, s - SSM Group,
C - Connected, L - Local, I - Received Source Specific Host Report,
P - Pruned, R - RP-bit set, F - Register flag, T - SPT-bit set,
J - Join SPT
Timers: Uptime/Expires
Interface state: Interface, State

(192.168.103.62, 230.11.11.11), 00:02:33/00:00:56, flags: SPF  <-- The mroute is added
  Incoming interface: OUTSIDE
  RPF nbr: 192.168.103.62
 Outgoing interface list: Null     <-- The OIL is empty
The capture on the firewall shows:
firepower# show capture
capture CAPI type raw-data trace interface OUTSIDE [Capturing - 1040 bytes]    <-- There are ICMP packets captured on ingress interface
match icmp host 192.168.103.62 any
capture CAPO type raw-data interface INSIDE [Capturing - 0 bytes]     <-- There are no ICMP packets on egress
match icmp host 192.168.103.62 any
The firewall creates connections for each ping, but silently drops the packets:
firepower# show log | include 230.11.11.11
May 17 2022 11:05:47: %FTD-7-609001: Built local-host identity:230.11.11.11       <-- A new connection is created
May 17 2022 11:05:47: %FTD-6-302020: Built inbound ICMP connection for faddr 192.168.1.99/6 gaddr 230.11.11.11/0 laddr 230.11.11.11/0 type 8 code 0
May 17 2022 11:05:47: %FTD-6-302020: Built inbound ICMP connection for faddr 192.168.103.62/6 gaddr 230.11.11.11/0 laddr 230.11.11.11/0 type 8 code 0
May 17 2022 11:05:49: %FTD-6-302021: Teardown ICMP connection for faddr 192.168.1.99/6 gaddr 230.11.11.11/0 laddr 230.11.11.11/0 type 8 code 0
May 17 2022 11:05:49: %FTD-6-302021: Teardown ICMP connection for faddr 192.168.103.62/6 gaddr 230.11.11.11/0 laddr 230.11.11.11/0 type 8 code 0
May 17 2022 11:05:49: %FTD-7-609002: Teardown local-host identity:230.11.11.11 duration 0:00:02  <-- The connection is closed
May 17 2022 11:05:51: %FTD-7-609001: Built local-host identity:230.11.11.11             <-- A new connection is created
May 17 2022 11:05:51: %FTD-6-302020: Built inbound ICMP connection for faddr 192.168.1.99/6 gaddr 230.11.11.11/0 laddr 230.11.11.11/0 type 8 code 0
May 17 2022 11:05:51: %FTD-6-302020: Built inbound ICMP connection for faddr 192.168.103.62/6 gaddr 230.11.11.11/0 laddr 230.11.11.11/0 type 8 code 0
May 17 2022 11:05:53: %FTD-6-302021: Teardown ICMP connection for faddr 192.168.1.99/6 gaddr 230.11.11.11/0 laddr 230.11.11.11/0 type 8 code 0
May 17 2022 11:05:53: %FTD-6-302021: Teardown ICMP connection for faddr 192.168.103.62/6 gaddr 230.11.11.11/0 laddr 230.11.11.11/0 type 8 code 0
May 17 2022 11:05:53: %FTD-7-609002: Teardown local-host identity:230.11.11.11 duration 0:00:02      <-- The connection is closed
Note: The LINA ASP drop capture does not show the dropped packets
The main indication of multicast packet drops is:
firepower# show mfib
Entry Flags: C - Directly Connected, S - Signal, IA - Inherit A flag,
             AR - Activity Required, K - Keepalive
Forwarding Counts: Pkt Count/Pkts per second/Avg Pkt Size/Kbits per second
Other counts: Total/RPF failed/Other drops
Interface Flags: A - Accept, F - Forward, NS - Negate Signalling
             IC - Internal Copy, NP - Not platform switched
             SP - Signal Present
Interface Counts: FS Pkt Count/PS Pkt Count

(*,224.0.1.39) Flags: S K
  Forwarding: 0/0/0/0, Other: 0/0/0
(*,224.0.1.40) Flags: S K
  Forwarding: 0/0/0/0, Other: 0/0/0
(192.168.103.62,230.11.11.11) Flags: K         <-- The multicast stream
  Forwarding: 0/0/0/0, Other: 27/27/0          <-- The packets are dropped
igmp static-group
On FMC configure a static IGMP group:
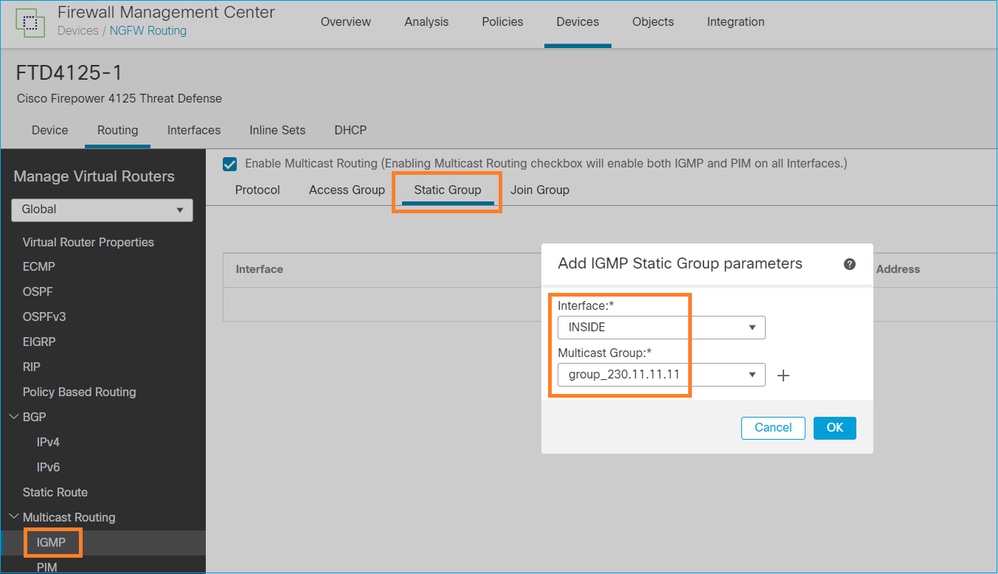
This is what is deployed in the background:
interface Port-channel1.205
 vlan 205
 nameif INSIDE
 cts manual
  propagate sgt preserve-untag
  policy static sgt disabled trusted
 security-level 0
 ip address 192.168.1.24 255.255.255.0
 igmp static-group 230.11.11.11        <-- IGMP static group is enabled on the interface
The ping fails, but the ICMP multicast traffic is now forwarded through the firewall:
L3-Switch# ping 230.11.11.11 re 10000
Type escape sequence to abort.
Sending 10000, 100-byte ICMP Echos to 230.11.11.11, timeout is 2 seconds:
............................
firepower# show capture
capture CAPI type raw-data trace interface OUTSIDE [Capturing - 650 bytes]   <-- ICMP packets are captured on ingress interface
match icmp host 192.168.103.62 any
capture CAPO type raw-data interface INSIDE [Capturing - 670 bytes]    <-- ICMP packets are captured on egress interface
match icmp host 192.168.103.62 any
firepower# show capture CAPI
8 packets captured

1: 11:31:32.470541 192.168.103.62 > 230.11.11.11 icmp: echo request
2: 11:31:34.470358 192.168.103.62 > 230.11.11.11 icmp: echo request
3: 11:31:36.470831 192.168.103.62 > 230.11.11.11 icmp: echo request
4: 11:31:38.470785 192.168.103.62 > 230.11.11.11 icmp: echo request
...

firepower# show capture CAPO
11 packets captured

1: 11:31:32.470587 802.1Q vlan#205 P0 192.168.103.62 > 230.11.11.11 icmp: echo request
2: 11:31:34.470404 802.1Q vlan#205 P0 192.168.103.62 > 230.11.11.11 icmp: echo request
3: 11:31:36.470861 802.1Q vlan#205 P0 192.168.103.62 > 230.11.11.11 icmp: echo request
4: 11:31:38.470816 802.1Q vlan#205 P0 192.168.103.62 > 230.11.11.11 icmp: echo request
Note: Trace of the packet shows an incorrect output (ingress interface is the same as egress. For more details check Cisco bug ID CSCvm89673.
firepower# show capture CAPI packet-number 1 trace

1: 11:39:33.553987 192.168.103.62 > 230.11.11.11 icmp: echo request
Phase: 1
Type: CAPTURE
Subtype:
Result: ALLOW
Elapsed time: 3172 ns
Config:
Additional Information:
MAC Access list

Phase: 2
Type: ACCESS-LIST
Subtype:
Result: ALLOW
Elapsed time: 3172 ns
Config:
Implicit Rule
Additional Information:
MAC Access list

Phase: 3
Type: ROUTE-LOOKUP
Subtype: No ECMP load balancing
Result: ALLOW
Elapsed time: 9760 ns
Config:
Additional Information:
Destination is locally connected. No ECMP load balancing.
Found next-hop 192.168.103.62 using egress ifc OUTSIDE(vrfid:0)

Phase: 4
Type: ACCESS-LIST
Subtype:
Result: ALLOW
Elapsed time: 5368 ns
Config:
Implicit Rule
Additional Information:

Phase: 5
Type: CONN-SETTINGS
Subtype:
Result: ALLOW
Elapsed time: 5368 ns
Config:
class-map class-default
match any
policy-map global_policy
class class-default
set connection advanced-options UM_STATIC_TCP_MAP
service-policy global_policy global
Additional Information:

Phase: 6
Type: NAT
Subtype: per-session
Result: ALLOW
Elapsed time: 5368 ns
Config:
Additional Information:

Phase: 7
Type: IP-OPTIONS
Subtype:
Result: ALLOW
Elapsed time: 5368 ns
Config:
Additional Information:

Phase: 8
Type: CLUSTER-REDIRECT
Subtype: cluster-redirect
Result: ALLOW
Elapsed time: 31720 ns
Config:
Additional Information:

Phase: 9
Type: INSPECT
Subtype: np-inspect
Result: ALLOW
Elapsed time: 488 ns
Config:
class-map inspection_default
match default-inspection-traffic
policy-map global_policy
class inspection_default
inspect icmp
service-policy global_policy global
Additional Information:

Phase: 10
Type: INSPECT
Subtype: np-inspect
Result: ALLOW
Elapsed time: 2440 ns
Config:
Additional Information:

Phase: 11
Type: MULTICAST    <-- The packet is multicast
Subtype:
Result: ALLOW
Elapsed time: 976 ns
Config:
Additional Information:

Phase: 12
Type: FLOW-CREATION    <-- A new flow is created
Subtype:
Result: ALLOW
Elapsed time: 56120 ns
Config:
Additional Information:
New flow created with id 5690, packet dispatched to next module

Phase: 13
Type: CAPTURE
Subtype:
Result: ALLOW
Elapsed time: 10248 ns
Config:
Additional Information:
MAC Access list

Result:
input-interface: OUTSIDE(vrfid:0)
input-status: up
input-line-status: up
output-interface: OUTSIDE(vrfid:0)
output-status: up
output-line-status: up
Action: allow       <-- The packet is allowed
Time Taken: 139568 ns
Tip: You can ping with timeout 0 from the source host and can check the firewall mfib counters:
L3-Switch# ping 230.11.11.11 re 500 timeout 0
Type escape sequence to abort.
Sending 1000, 100-byte ICMP Echos to 230.11.11.11, timeout is 0 seconds:
......................................................................
......................................................................
......................................................................
....................
firepower# clear mfib counters
firepower# !ping from the source host.

firepower# show mfib 230.11.11.11
Entry Flags: C - Directly Connected, S - Signal, IA - Inherit A flag,
AR - Activity Required, K - Keepalive
Forwarding Counts: Pkt Count/Pkts per second/Avg Pkt Size/Kbits per second
Other counts: Total/RPF failed/Other drops
Interface Flags: A - Accept, F - Forward, NS - Negate Signalling
IC - Internal Copy, NP - Not platform switched
SP - Signal Present
Interface Counts: FS Pkt Count/PS Pkt Count

(*,230.11.11.11) Flags: C K
  Forwarding: 0/0/0/0, Other: 0/0/0
  INSIDE Flags: F NS
    Pkts: 0/0
(192.168.103.62,230.11.11.11) Flags: K
  Forwarding: 500/0/100/0, Other: 0/0/0    <-- 500 multicast packets forwarded. The average size of each packet is 100 Bytes
  OUTSIDE Flags: A
  INSIDE Flags: F NS
    Pkts: 500/0
igmp join-group
On FMC remote the previously configured static group configuration and configure an IGMP join group:
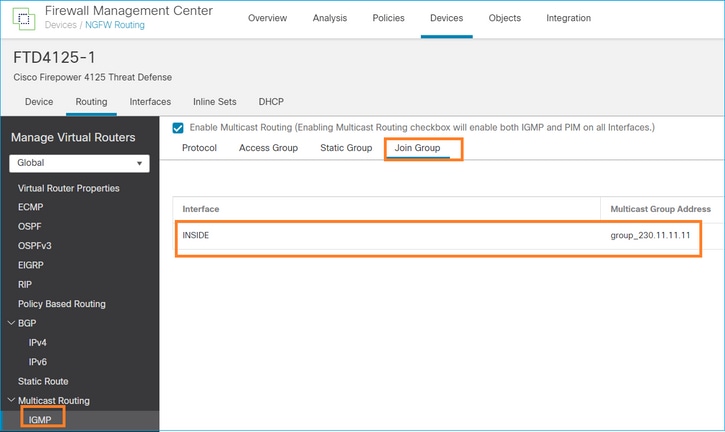

The deployed configuration:
firepower# show run interface Port-channel1.205
!
interface Port-channel1.205
vlan 205
nameif INSIDE
cts manual
propagate sgt preserve-untag
policy static sgt disabled trusted
security-level 0
ip address 192.168.1.24 255.255.255.0
igmp join-group 230.11.11.11       <-- The interface joined the multicast group
The IGMP group:
firepower# show igmp group
IGMP Connected Group Membership
Group Address Interface Uptime Expires Last Reporter
230.11.11.11 INSIDE 00:30:43 never 192.168.1.24   <-- The group is enabled on the interface
From the source host, try the first ICMP multicast test towards 230.11.11.11 IP:
L3-Switch# ping 230.11.11.11 repeat 10
Type escape sequence to abort.
Sending 10, 100-byte ICMP Echos to 230.11.11.11, timeout is 2 seconds:

Reply to request 0 from 192.168.1.24, 12 ms
Reply to request 1 from 192.168.1.24, 8 ms
Reply to request 2 from 192.168.1.24, 8 ms
Reply to request 3 from 192.168.1.24, 8 ms
Reply to request 4 from 192.168.1.24, 8 ms
Reply to request 5 from 192.168.1.24, 12 ms
Reply to request 6 from 192.168.1.24, 8 ms
Reply to request 7 from 192.168.1.24, 8 ms
Reply to request 8 from 192.168.1.24, 8 ms
Reply to request 9 from 192.168.1.24, 8 ms
Note: If you do not see all the replies check Cisco bug ID CSCvm90069.
Task 4 – Configure IGMP Stub Multicast Routing

Configure stub multicast routing on FTD so that IGMP Membership Report messages received on the INSIDE interface are forwarded to the OUTSIDE interface.
Solution
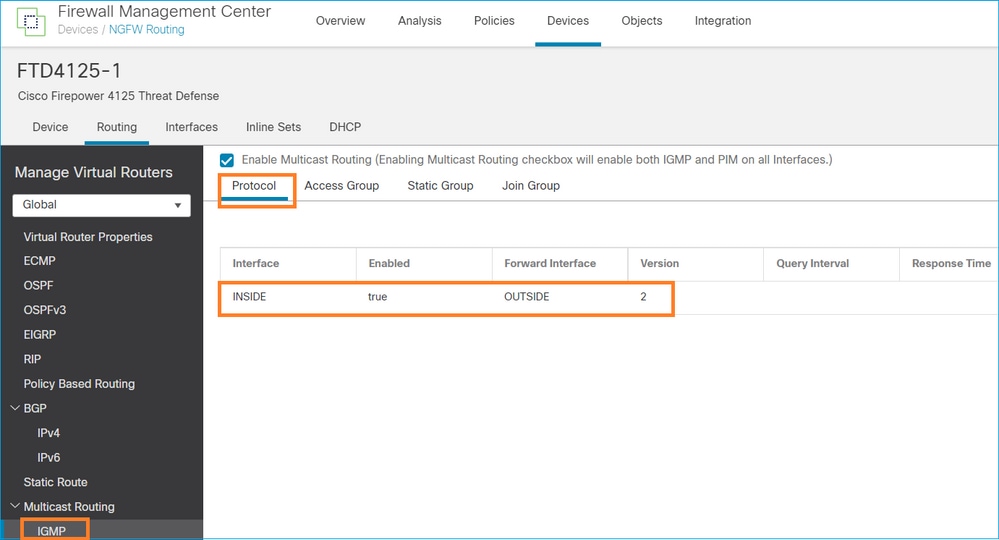
The deployed configuration:
firepower# show run multicast-routing
multicast-routing               <-- Multicast routing is enabled
firepower# show run interface Port-channel1.205
!
interface Port-channel1.205
 vlan 205
 nameif INSIDE
 cts manual
  propagate sgt preserve-untag
  policy static sgt disabled trusted
 security-level 0
 ip address 192.168.1.24 255.255.255.0
 igmp forward interface OUTSIDE        <-- The interface does stub multicast routing
Verification
Enable captures on FTD:
firepower# capture CAPI interface INSIDE trace match igmp any host 230.10.10.10
firepower# capture CAPO interface OUTSIDE match igmp any host 230.10.10.10
Verification
To force an IGMP Membership Report you can use an application like VLC:
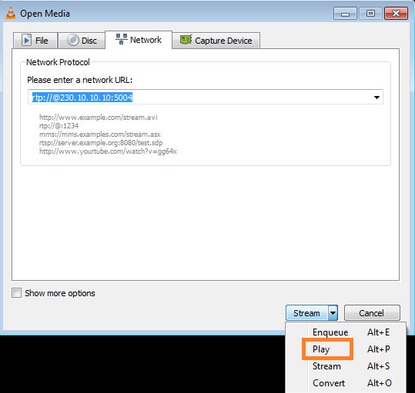
The FTD proxies the IGMP packets:
firepower# show capture
capture CAPI type raw-data trace interface INSIDE [Capturing - 66 bytes]  <-- IGMP packets captured on ingress
match igmp any host 230.10.10.10
capture CAPO type raw-data interface OUTSIDE [Capturing - 62 bytes]   <-- IGMP packets captured on egress
match igmp any host 230.10.10.10
The FTD changes the source IP:
firepower# show capture CAPI

1 packet captured

   1: 12:21:12.820483 802.1Q vlan#205 P6 192.168.1.50 > 230.10.10.10 ip-proto-2, length 8    <-- The source IP of the packet on ingress interface
1 packet shown
firepower# show capture CAPO

1 packet captured

   1: 12:21:12.820743 192.168.103.91 > 230.10.10.10 ip-proto-2, length 8  <-- The source IP of the packet on egress interface
1 packet shown
If you check the pcap in Wireshark, you can see that the packet is completely regenerated by the firewall (the IP identification changes).
A group entry is created on FTD:
firepower# show igmp group
IGMP Connected Group Membership
Group Address    Interface            Uptime    Expires   Last Reporter
230.10.10.10     INSIDE               00:15:22  00:03:28  192.168.1.50     <-- IGMP group is enabled on the ingress interface
239.255.255.250  INSIDE               00:15:27  00:03:29  192.168.1.50
The FTD firewall creates 2 control-plane connections:
firepower# show conn all address 230.10.10.10
9 in use, 28 most used
Inspect Snort:
preserve-connection: 0 enabled, 0 in effect, 0 most enabled, 0 most in effect
IGMP INSIDE 192.168.1.50 NP Identity Ifc 230.10.10.10, idle 0:00:09, bytes 8, flags          <-- Connection terminated on the ingress interface
IGMP OUTSIDE 230.10.10.10 NP Identity Ifc 192.168.103.91, idle 0:00:09, bytes 8, flags       <-- Connection terminated on the egress interface
Trace of the first packet:
firepower# show capture CAPI packet-number 1 trace

6 packets captured

1: 12:21:12.820483 802.1Q vlan#205 P6 192.168.1.50 > 230.10.10.10 ip-proto-2, length 8   <-- The first packet of the flow
Phase: 1
Type: CAPTURE
Subtype:
Result: ALLOW
Elapsed time: 5124 ns
Config:
Additional Information:
MAC Access list

Phase: 2
Type: ACCESS-LIST
Subtype:
Result: ALLOW
Elapsed time: 5124 ns
Config:
Implicit Rule
Additional Information:
MAC Access list

Phase: 3
Type: ROUTE-LOOKUP
Subtype: No ECMP load balancing
Result: ALLOW
Elapsed time: 7808 ns
Config:
Additional Information:
Destination is locally connected. No ECMP load balancing.
Found next-hop 192.168.1.50 using egress ifc INSIDE(vrfid:0)

Phase: 4
Type: CLUSTER-DROP-ON-SLAVE
Subtype: cluster-drop-on-slave
Result: ALLOW
Elapsed time: 5368 ns
Config:
Additional Information:

Phase: 5
Type: ACCESS-LIST
Subtype:
Result: ALLOW
Elapsed time: 5368 ns
Config:
Implicit Rule
Additional Information:

Phase: 6
Type: IP-OPTIONS
Subtype:
Result: ALLOW
Elapsed time: 5368 ns
Config:
Additional Information:

Phase: 7
Type: NAT
Subtype: per-session
Result: ALLOW
Elapsed time: 5368 ns
Config:
Additional Information:

Phase: 8
Type: CLUSTER-REDIRECT
Subtype: cluster-redirect
Result: ALLOW
Elapsed time: 40504 ns
Config:
Additional Information:

Phase: 9
Type: MULTICAST        <-- The packet is multicast
Subtype:
Result: ALLOW
Elapsed time: 976 ns
Config:
Additional Information:

Phase: 10
Type: FLOW-CREATION       <-- A new flow is created
Subtype:
Result: ALLOW
Elapsed time: 17568 ns
Config:
Additional Information:
New flow created with id 5945, packet dispatched to next module

Phase: 11
Type: FLOW-CREATION      <-- A second flow is created
Subtype:
Result: ALLOW
Elapsed time: 39528 ns
Config:
Additional Information:
New flow created with id 5946, packet dispatched to next module

Phase: 12
Type: NEXTHOP-LOOKUP-FROM-OUTPUT-ROUTE-LOOKUP
Subtype: Lookup Nexthop on interface
Result: ALLOW
Elapsed time: 6344 ns
Config:
Additional Information:
Found next-hop 230.10.10.10 using egress ifc OUTSIDE(vrfid:0)

Phase: 13
Type: CAPTURE
Subtype:
Result: ALLOW
Elapsed time: 9760 ns
Config:
Additional Information:
MAC Access list

Result:
input-interface: INSIDE(vrfid:0)
input-status: up
input-line-status: up
output-interface: INSIDE(vrfid:0)
output-status: up
output-line-status: up
Action: allow
Time Taken: 154208 ns
Known Issues
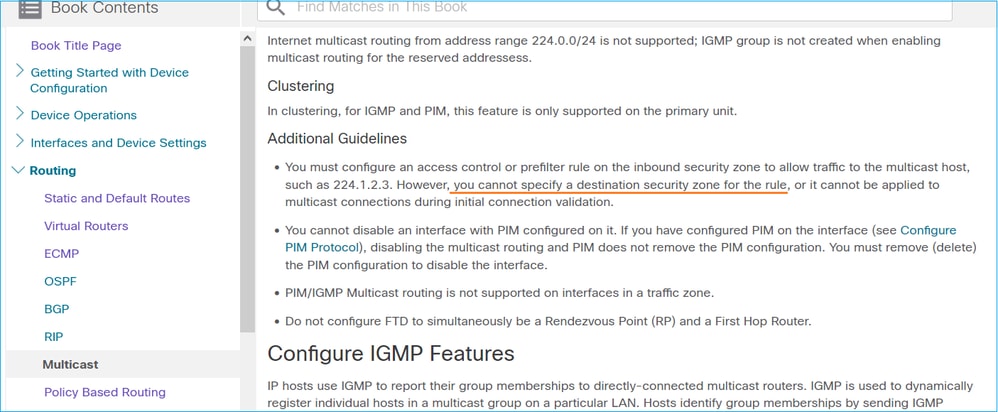
Filter Multicast Traffic on Destination Zones
You cannot specify a destination security zone for the Access Control Policy rule that matches the multicast traffic:

This is also documented in the FMC user guide:
IGMP Reports are Denied by the Firewall when IGMP Interface Limit is Exceeded
By default, the firewall allows maximum 500 current active joins (reports) on an interface. If this threshold is exceeded, the firewall ignores additional incoming IGMP reports from the multicast receivers.
To check the IGMP limit and active joins, run the command show igmp interface nameif:
asa# show igmp interface inside
inside is up, line protocol is up
  Internet address is 10.10.10.1/24
  IGMP is enabled on interface
  Current IGMP version is 2
  IGMP query interval is 125 seconds
  IGMP querier timeout is 255 seconds
  IGMP max query response time is 10 seconds
  Last member query response interval is 1 seconds
  Inbound IGMP access group is:
  IGMP limit is 500, currently active joins: 500
  Cumulative IGMP activity: 0 joins, 0 leaves
  IGMP querying router is 10.10.10.1 (this system)
The IGMP debug command debug igmp shows this output:
asa# debug igmp
Apr 20 2023 09:37:10: %ASA-7-711001: IGMP: Group 230.1.2.3 limit denied on inside
The software versions with the fix of Cisco bug ID CSCvw60976  allow users to configure up to 5000 groups on a per-interface basis.
Firewall Ignores IGMP Reports for the 232.x.x.x/8 Address Range
The 232.x.x.x/8 address range is for use with Source Specific Multicast (SSM). The firewall does not support PIM Source Specific Multicast (SSM) functionality and related configuration.
The IGMP debug command debug igmp shows this output:
asa# debug igmp
Apr 20 2023 09:37:10: %ASA-7-711001: IGMP: Received v2 Report on inside from 10.10.10.11 for 232.179.89.253
Apr 20 2023 09:37:10: %ASA-7-711001: IGMP: group_db: add new group 232.179.89.253 on inside
Apr 20 2023 09:37:10: %ASA-7-711001: IGMP: Exclude report on inside ignored for SSM group 232.179.89.253
Cisco bug ID CSCsr53916  tracks the enhancement to support the SSM range.
Related Information
Revision History
| Revision | Publish Date | Comments |
|---|---|---|
1.0 |
19-May-2022 |
Initial Release |
Contributed by Cisco Engineers
- Mikis ZafeiroudisCisco TAC Engineer
- Ilkin GasimovCisco TAC Engineer
Contact Cisco
- Open a Support Case

- (Requires a Cisco Service Contract)
 Feedback