Verify Firepower, Instance, Availability, Scalability Configuration
Available Languages
Download Options
Bias-Free Language
The documentation set for this product strives to use bias-free language. For the purposes of this documentation set, bias-free is defined as language that does not imply discrimination based on age, disability, gender, racial identity, ethnic identity, sexual orientation, socioeconomic status, and intersectionality. Exceptions may be present in the documentation due to language that is hardcoded in the user interfaces of the product software, language used based on RFP documentation, or language that is used by a referenced third-party product. Learn more about how Cisco is using Inclusive Language.
Contents
Introduction
This document describes the verification of Firepower high availability and scalability configuration, firewall mode, and instance deployment type.
Background Information
The verification steps for the high availability and scalability configuration, firewall mode, and instance deployment type are shown on the user interface (UI), the command-line interface (CLI), via REST-API queries, SNMP, and in the troubleshoot file.
Prerequisites
Requirements
- Basic product knowledge
- REST-API, SNMP
Components Used
The information in this document was created from the devices in a specific lab environment. All of the devices used in this document started with a cleared (default) configuration. If your network is live, ensure that you understand the potential impact of any command.
The information in this document is based on these software and hardware versions:
- Firepower 11xx
- Firepower 21xx
- Firepower 31xx
- Firepower 41xx
- Firepower Management Center (FMC) Version 7.1.x
- Firepower eXtensible Operating System (FXOS) 2.11.1.x
- Firepower Device Manager (FDM) 7.1.x
- Firepower Threat Defense 7.1.x
- ASA 9.17.x
Verify High Availability and Scalability Configuration
High availability refers to the failover configuration. High availability or failover setup joins two devices so that if one of the devices fails, the other device can take over.
Scalability refers to the cluster configuration. A cluster configuration lets you group multiple FTD nodes together as a single logical device. A cluster provides all the convenience of a single device (management, integration into a network) and the increased throughput and redundancy of multiple devices.
In this document these expressions are used interchangeably:
- high availability or failover
- scalability or cluster
In some cases, the verification of high availability and scalability configuration or status is not available. For example, there is no verification command for FTD standalone configuration. Standalone, failover, and cluster configuration modes are mutually exclusive. If a device does not have failover and cluster configuration, it is considered to operate in standalone mode.
FMC High Availability
FMC high availability configuration and status can be verified with the use of these options:
- FMC UI
- FMC CLI
- REST API request
- FMC troubleshoot file
FMC UI
Follow these steps to verify the FMC high availability configuration and status on the FMC UI:
1. Choose System > Integration > High Availability:
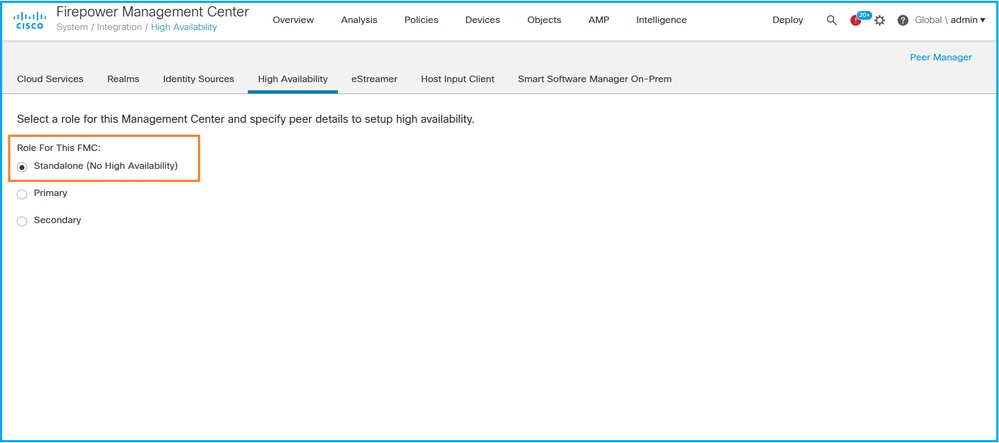
2. Check the role for the FMC. In this case, high availability is not configured and FMC operates in a standalone configuration:
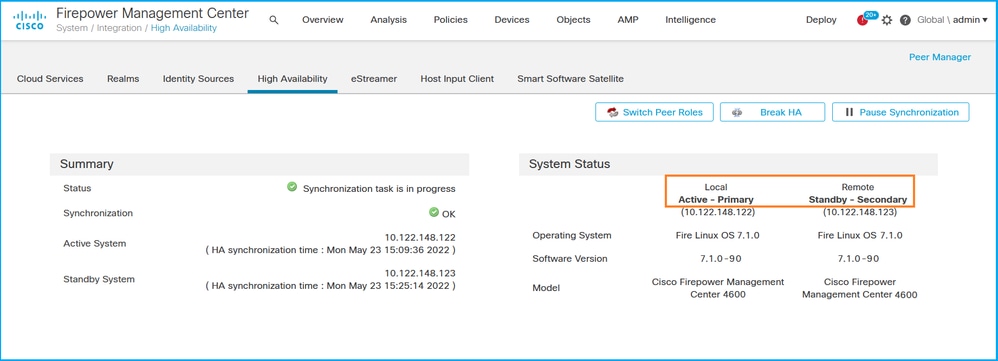
If high availability is configured, local and remote roles are shown:
FMC CLI
Follow these steps to verify the FMC high availability configuration and status on the FMC CLI:
1. Access FMC via SSH or console connection.
2. Run the expert command and then run the sudo su command:
> expert
admin@fmc1:~$ sudo su
Password:
Last login: Sat May 21 21:18:52 UTC 2022 on pts/0
fmc1:/Volume/home/admin#
3. Run the troubleshoot_HADC.pl command and select option 1 Show HA Info Of FMC. If high availability is not configured, this output is shown:
fmc1:/Volume/home/admin# troubleshoot_HADC.pl
****************  Troubleshooting Utility  **************

 1   Show HA Info Of FMC
 2   Execute Sybase DBPing
 3   Show Arbiter Status
 4   Check Peer Connectivity
 5   Print Messages of AQ Task
 6   Show FMC HA Operations History (ASC order)
 7   Dump To File: FMC HA Operations History (ASC order)
 8   Last Successful Periodic Sync Time (When it completed)
 9   Print HA Status Messages
 10  Compare active and standby device list
 11  Check manager status of standby missing devices
 12  Check critical PM processes details
 13   Help
 0   Exit

**************************************************************
Enter choice: 1
HA Enabled: No
If high availability is configured, this output is shown:
fmc1:/Volume/home/admin# troubleshoot_HADC.pl
**************** Troubleshooting Utility **************
1 Show HA Info Of FMC
2 Execute Sybase DBPing
3 Show Arbiter Status
4 Check Peer Connectivity
5 Print Messages of AQ Task
6 Show FMC HA Operations History (ASC order)
7 Dump To File: FMC HA Operations History (ASC order)
8 Help
0 Exit
**************************************************************
Enter choice: 1
HA Enabled: Yes
This FMC Role In HA: Active - Primary
Status out put: vmsDbEngine (system,gui) - Running 29061
In vmsDbEngineStatus(): vmsDbEngine process is running at /usr/local/sf/lib/perl/5.24.4/SF/Synchronize/HADC.pm line 3471.
Sybase Process: Running (vmsDbEngine, theSybase PM Process is Running)
Sybase Database Connectivity: Accepting DB Connections.
Sybase Database Name: csm_primary
Sybase Role: Active
Note: In a high availability configuration, the FMC role can have a primary or secondary role, and active or standby status.
FMC REST API
Follow these steps to verify the FMC high availability and scalability configuration and status via FMC REST-API. Use a REST-API client. In this example, curl is used:
1. Request an authentication token:
# curl -s -k -v -X POST 'https://192.0.2.1/api/fmc_platform/v1/auth/generatetoken' -H 'Authentication: Basic' -u 'admin:Cisco123' | grep -i X-auth-access-token
...
< X-auth-access-token: 5d817ef7-f12f-4dae-b0c0-cd742d3bd2eb
2. Use the token in this query to find the UUID of the global domain:
# curl -s -k -X 'GET'  'https://192.0.2.1/api/fmc_platform/v1/info/domain' -H 'accept: application/json'  -H 'X-auth-access-token: 5d817ef7-f12f-4dae-b0c0-cd742d3bd2eb' | python -m json.tool
{    "items": [
        {
            "name": "Global",
            "type": "Domain",
            "uuid": "e276abec-e0f2-11e3-8169-6d9ed49b625f"
        },
        {
            "name": "Global/LAB2",
            "type": "Domain",
            "uuid": "84cc4afe-02bc-b80a-4b09-000000000000"
        },
        {
            "name": "Global/TEST1",
            "type": "Domain",
            "uuid": "ef0cf3e9-bb07-8f66-5c4e-000000000001"
        },
        {
            "name": "Global/TEST2",
            "type": "Domain",
            "uuid": "341a8f03-f831-c364-b751-000000000001"
        }
    ],
    "links": {
        "self": "https://192.0.2.1/api/fmc_platform/v1/info/domain?offset=0&limit=25"
    },
    "paging": {
        "count": 4,
        "limit": 25,
        "offset": 0,
        "pages": 1
    }
}
Note: The part | python -m json.tool of the command string is used to format the output in JSON-style and is optional.
3. Use the global domain UUID in this query:
# curl -s -k -X 'GET' 'https://192.0.2.1/api/fmc_config/v1/domain/e276abec-e0f2-11e3-8169-6d9ed49b625f/integration/fmchastatuses' -H 'accept: application/json' -H 'X-auth-access-token: 5d817ef7-f12f-4dae-b0c0-cd742d3bd2eb' | python -m json.tool
If high availability is not configured, this output is shown:
{
    "links": {},
    "paging": {
        "count": 0,
        "limit": 0,
        "offset": 0,
        "pages": 0
    }
}
If high availability is configured, this output is shown:
{
    "items": [
        {
            "fmcPrimary": {
                "ipAddress": "192.0.2.1",
                "role": "Active",
                "uuid": "de7bfc10-13b5-11ec-afaf-a0f8cf9ccb46"
            },
            "fmcSecondary": {
                "ipAddress": "192.0.2.2",
                "role": "Standby",
                "uuid": "a2de9750-4635-11ec-b56d-201c961a3600"
            },
            "haStatusMessages": [
                "Healthy"
            ],
            "id": "de7bfc10-13b5-11ec-afaf-a0f8cf9ccb46",
            "overallStatus": "GOOD",
            "syncStatus": "GOOD",
            "type": "FMCHAStatus"
        }
    ],
    "links": {
        "self": "https://192.0.2.1/api/fmc_config/v1/domain/e276abec-e0f2-11e3-8169-6d9ed49b625f/integration/fmchastatuses?offset=0&limit=25"
    },
    "paging": {
        "count": 1,
        "limit": 25,
        "offset": 0,
        "pages": 1
    }
}
FMC Troubleshoot File
Follow these steps to verify the FMC high availability configuration and status in the FMC troubleshoot file:
1. Open the troubleshoot file and navigate to the folder <filename>.tar/results-<date>--xxxxxx/command-outputs
2. Open the file usr-local-sf-bin-troubleshoot_HADC.pl -a.output:
If high availability is not configured, this output is shown:
# pwd
/var/tmp/results-05-06-2022--199172/command-outputs

# cat "usr-local-sf-bin-troubleshoot_HADC.pl -a.output"
Output of /usr/local/sf/bin/troubleshoot_HADC.pl -a:
$VAR1 = [
          'Mirror Server => csmEng',
          {
            'rcode' => 0,
            'stderr' => undef,
            'stdout' => 'SQL Anywhere Server Ping Utility Version 17.0.10.5745
Type       Property                  Value
---------  ----------------          ------------------------------
Database   MirrorRole                NULL
Database   MirrorState               NULL
Database   PartnerState              NULL
Database   ArbiterState              NULL
Server     ServerName                csmEng
Ping database successful.
'
          }
        ];
 (system,gui) - Waiting
HA Enabled: No
Sybase Database Name: csmEng
Arbiter Not Running On This FMC.
Not In HA
If high availability is configured, this output is shown:
# pwd
/var/tmp/results-05-06-2022--199172/command-outputs

# cat "usr-local-sf-bin-troubleshoot_HADC.pl -a.output"
Output of /usr/local/sf/bin/troubleshoot_HADC.pl -a:
Status out put: vmsDbEngine (system,gui) - Running 9399
In vmsDbEngineStatus(): vmsDbEngine process is running at /usr/local/sf/lib/perl/5.24.4/SF/Synchronize/HADC.pm line 3471.
$VAR1 = [
          'Mirror Server => csm_primary',
          {
            'stderr' => undef,
            'stdout' => 'SQL Anywhere Server Ping Utility Version 17.0.10.5745
Type       Property                  Value
---------  ----------------          ------------------------------
Database   MirrorRole                primary
Database   MirrorState               synchronizing
Database   PartnerState              connected
Database   ArbiterState              connected
Server     ServerName                csm_primary
Ping database successful.
',
            'rcode' => 0
          }
        ];

(system,gui) - Running 8185

...
HA Enabled: Yes
This FMC Role In HA: Active - Primary
Sybase Process: Running (vmsDbEngine, theSybase PM Process is Running)
Sybase Database Connectivity: Accepting DB Connections.
Sybase Database Name: csm_primary
Sybase Role: Active

Sybase Database Name: csm_primary
Arbiter Running On This FMC.

Peer Is Connected
FDM High Availability
FDM high availability configuration and status can be verified with the use of these options:
- FDM UI
- FDM REST API request
- FTD CLI
- FTD SNMP Poll
- FTD troubleshoot file
FDM UI
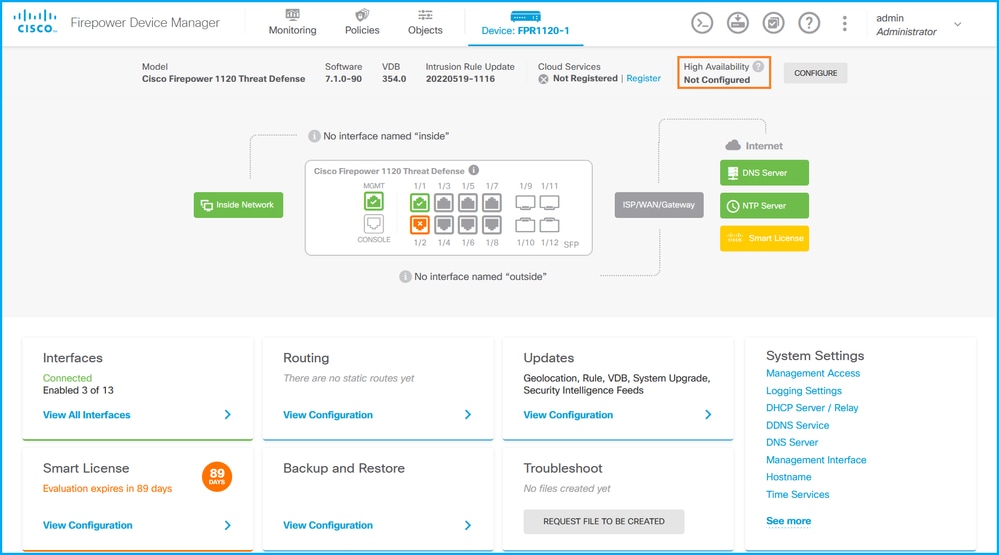
In order to verify the FDM high availability configuration and status on FDM UI, check High Availability on the main page. If high availability is not configured, the High Availability value is Not Configured:
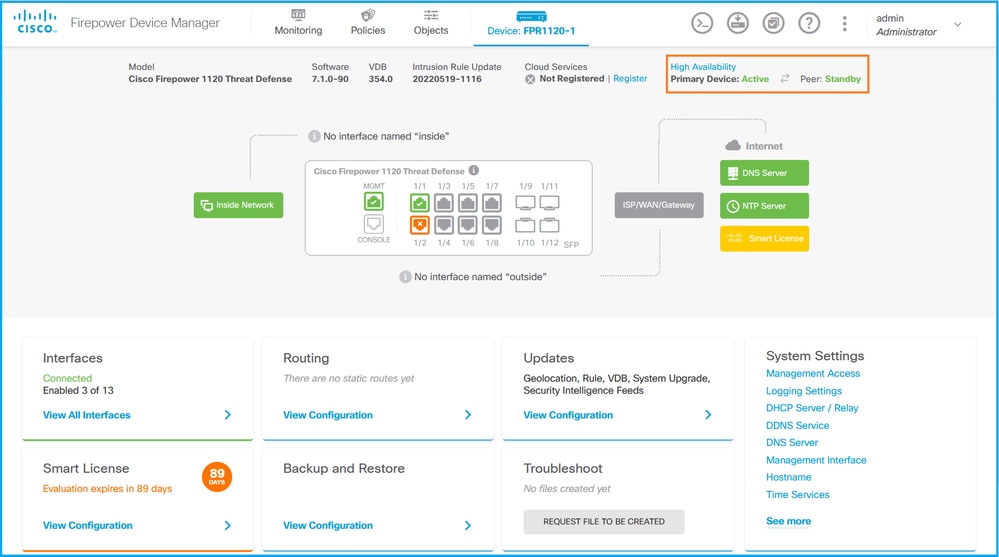
If high availability is configured, the local and remote peer unit failover configuration and roles are shown:
FDM REST API
Follow these steps to verify the FDM high availability configuration and status via FDM REST-API request. Use a REST-API client. In this example, curl is used:
1. Request an authentication token:
# curl -k -X POST --header 'Content-Type: application/json' --header 'Accept: application/json' -d '{ "grant_type": "password", "username": "admin", "password": "Cisco123" }' 'https://192.0.2.3/api/fdm/latest/fdm/token'
{
    "access_token":
    "eyJhbGciOiJIUzI1NiJ9.eyJpYXQiOjE2NTMyMDg1MjgsInN1YiI6ImFkbWluIiwianRpIjoiMjI1YWRhZWMtZDlhYS0xMWVjLWE5MmEtMjk4YjRjZTUxNmJjIiwibmJmIjoxNjUzMjA4NTI4LCJleHAiOjE2NTMyMTAzMjgsInJlZnJlc2hUb2tlbkV4cGlyZXNBdCI6MTY1MzIxMDkyODU2OSwidG9rZW5UeXBlIjoiSldUX0FjY2VzcyIsInVzZXJVdWlkIjoiYTNmZDA3ZjMtZDgxZS0xMWVjLWE5MmEtYzk5N2UxNDcyNTM0IiwidXNlclJvbGUiOiJST0xFX0FETUlOIiwib3JpZ2luIjoicGFzc3dvcmQiLCJ1c2VybmFtZSI6ImFkbWluIn0.ai3LUbnsLOJTN6exKOANsEG5qTD6L-ANd_1V6TbFe6M",
    "expires_in": 1800,
    "refresh_expires_in": 2400,
    "refresh_token": "eyJhbGciOiJIUzI1NiJ9.eyJpYXQiOjE2NTIzOTQxNjksInN1YiI6ImFkbWluIiwianRpIjoiMGU0NGIxYzQtZDI0Mi0xMWVjLTk4ZWMtYTllOTlkZGMwN2Y0IiwibmJmIjoxNjUyMzk0MTY5LCJleHAiOjE2NTIzOTY1NjksImFjY2Vzc1Rva2VuRXhwaXJlc0F0IjoxNjUyMzk1OTY5MDcwLCJyZWZyZXNoQ291bnQiOi0xLCJ0b2tlblR5cGUiOiJKV1RfUmVmcmVzaCIsInVzZXJVdWlkIjoiYTU3ZGVmMjgtY2M3MC0xMWVjLTk4ZWMtZjk4ODExNjNjZWIwIiwidXNlclJvbGUiOiJST0xFX0FETUlOIiwib3JpZ2luIjoicGFzc3dvcmQiLCJ1c2VybmFtZSI6ImFkbWluIn0.Avga0-isDjQB527d3QWZQb7AS4a9ea5wlbYUn-A9aPw",
    "token_type": "Bearer"
}
2. In order to verify high availability configuration, use the access token value in this query:
# curl -s -k -X GET -H 'Accept: application/json' -H 'Authorization: Bearer eyJhbGciOiJIUzI1NiJ9.eyJpYXQiOjE2NTMyMDg1MjgsInN1YiI6ImFkbWluIiwianRpIjoiMjI1YWRhZWMtZDlhYS0xMWVjLWE5MmEtMjk4YjRjZTUxNmJjIiwibmJmIjoxNjUzMjA4NTI4LCJleHAiOjE2NTMyMTAzMjgsInJlZnJlc2hUb2tlbkV4cGlyZXNBdCI6MTY1MzIxMDkyODU2OSwidG9rZW5UeXBlIjoiSldUX0FjY2VzcyIsInVzZXJVdWlkIjoiYTNmZDA3ZjMtZDgxZS0xMWVjLWE5MmEtYzk5N2UxNDcyNTM0IiwidXNlclJvbGUiOiJST0xFX0FETUlOIiwib3JpZ2luIjoicGFzc3dvcmQiLCJ1c2VybmFtZSI6ImFkbWluIn0.ai3LUbnsLOJTN6exKOANsEG5qTD6L-ANd_1V6TbFe6M' 'https://192.0.2.3/api/fdm/v6/devices/default/ha/configurations'
If high availability is not configured, this output is shown:
{
  "items": [
    {
      "version": "issgb3rw2lixf",
      "name": "HA",
      "nodeRole": null,
      "failoverInterface": null,
      "failoverName": null,
      "primaryFailoverIPv4": null,
      "secondaryFailoverIPv4": null,
      "primaryFailoverIPv6": null,
      "secondaryFailoverIPv6": null,
      "statefulFailoverInterface": null,
      "statefulFailoverName": null,
      "primaryStatefulFailoverIPv4": null,
      "secondaryStatefulFailoverIPv4": null,
      "primaryStatefulFailoverIPv6": null,
      "secondaryStatefulFailoverIPv6": null,
      "sharedKey": null,
      "id": "76ha83ga-c872-11f2-8be8-8e45bb1943c0",
      "type": "haconfiguration",
      "links": {
        "self": "https://192.0.2.2/api/fdm/v6/devices/default/ha/configurations/76ha83ga-c872-11f2-8be8-8e45bb1943c0"
      }
    }
  ],
  "paging": {
    "prev": [],
    "next": [],
    "limit": 10,
    "offset": 0,
    "count": 1,
    "pages": 0
  }
}
If high availability is configured, this output is shown:
{
  "items": [
    {
      "version": "issgb3rw2lixf",
      "name": "HA",
      "nodeRole": "HA_PRIMARY",
      "failoverInterface": {
        "version": "ezzafxo5ccti3",
        "name": "",
        "hardwareName": "Ethernet1/1",
        "id": "8d6c41df-3e5f-465b-8e5a-d336b282f93f",
        "type": "physicalinterface"
      },
...
3. In order to verify high availability status, use this query:
# curl -s -k -X GET -H 'Accept: application/json' -H 'Authorization: Bearer eyJhbGciOiJIUzI1NiJ9.eyJpYXQiOjE2NTMyMDg1MjgsInN1YiI6ImFkbWluIiwianRpIjoiMjI1YWRhZWMtZDlhYS0xMWVjLWE5MmEtMjk4YjRjZTUxNmJjIiwibmJmIjoxNjUzMjA4NTI4LCJleHAiOjE2NTMyMTAzMjgsInJlZnJlc2hUb2tlbkV4cGlyZXNBdCI6MTY1MzIxMDkyODU2OSwidG9rZW5UeXBlIjoiSldUX0FjY2VzcyIsInVzZXJVdWlkIjoiYTNmZDA3ZjMtZDgxZS0xMWVjLWE5MmEtYzk5N2UxNDcyNTM0IiwidXNlclJvbGUiOiJST0xFX0FETUlOIiwib3JpZ2luIjoicGFzc3dvcmQiLCJ1c2VybmFtZSI6ImFkbWluIn0.ai3LUbnsLOJTN6exKOANsEG5qTD6L-ANd_1V6TbFe6M' 'https://192.0.2.3/api/fdm/v6/devices/default/operational/ha/status/default'
If high availability is not configured, this output is shown:
{
  "nodeRole" : null,
  "nodeState" : "SINGLE_NODE",
  "peerNodeState" : "HA_UNKNOWN_NODE",
  "configStatus" : "UNKNOWN",
  "haHealthStatus" : "HEALTHY",
  "disabledReason" : "",
  "disabledTimestamp" : null,
  "id" : "default",
  "type" : "hastatus",
  "links" : {
    "self" : "https://192.0.2.3/api/fdm/v6/devices/default/operational/ha/status/default"
  }
}
If high availability is configured, this output is shown:
{
 "nodeRole": "HA_PRIMARY",
  "nodeState": "HA_ACTIVE_NODE",
  "peerNodeState": "HA_STANDBY_NODE",
  "configStatus": "IN_SYNC",
  "haHealthStatus": "HEALTHY",
  "disabledReason": "",
  "disabledTimestamp": "",
  "id": "default",
  "type": "hastatus",
  "links": {
    "self": "https://192.0.2.3/api/fdm/v6/devices/default/operational/ha/status/default"
  }
}
FTD CLI
Follow the steps in the section.
FTD SNMP Poll
Follow the steps in the section.
FTD Troubleshoot File
Follow the steps in the section.
FTD High Availability and Scalability
FTD high availability and scalability configuration and status can be verified with the use of these options:
- FTD CLI
- FTD SNMP
- FTD troubleshoot file
- FMC UI
- FMC REST-API
- FDM UI
- FDM REST-API
- FCM UI
- FXOS CLI
- FXOS REST-API
- FXOS chassis show-tech file
FTD CLI
Follow these steps to verify the FTD high availability and scalability configuration and status on the FTD CLI:
1. Use these options to access the FTD CLI in accordance with the platform and deployment mode:
- Direct SSH access to FTD - all platforms
- Access from the FXOS console CLI (Firepower 1000/2100/3100) via command connect ftd
- Access from the FXOS CLI via commands (Firepower 4100/9300):
connect module <x> [console|telnet], where x is the slot ID, and then connect ftd [instance], where the instance is relevant only for multi-instance deployment
- For virtual FTDs, direct SSH access to FTD, or console access from the hypervisor or cloud UI
2. In order to verify the FTD failover configuration and status, run the show running-config failover and show failover state commands on the CLI.
If the failover is not configured, this output is shown:
> show running-config failover
no failover
> show failover state
                  State          Last Failure Reason      Date/Time
 This host  -     Secondary
                  Disabled       None
 Other host -     Primary
                  Not Detected   None
 ====Configuration State===
 ====Communication State==
If the failover is configured, this output is shown:
> show running-config failover
failover
failover lan unit primary
failover lan interface failover-link Ethernet1/1
failover replication http
failover link failover-link Ethernet1/1
failover interface ip failover-link 10.30.34.2 255.255.255.0 standby 10.30.34.3

> show failover state
               State          Last Failure Reason      Date/Time
This host  -   Primary
               Active         None
Other host -   Secondary
               Standby Ready  Comm Failure             09:21:50 UTC May 22 2022
====Configuration State===
        Sync Done
====Communication State===
        Mac set
3. In order to verify the FTD cluster configuration and status, run the show running-config cluster and show cluster info commands on the CLI.
If the cluster is not configured, this output is shown:
> show running-config cluster
> show cluster info
Clustering is not configured
If the cluster is configured, this output is shown:
> show running-config cluster
cluster group ftd_cluster1
 key *****
 local-unit unit-1-1
 cluster-interface Port-channel48.204 ip 10.173.1.1 255.255.0.0
 priority 9
 health-check holdtime 3
 health-check data-interface auto-rejoin 3 5 2
 health-check cluster-interface auto-rejoin unlimited 5 1
 health-check system auto-rejoin 3 5 2
 health-check monitor-interface debounce-time 500
 site-id 1
 no unit join-acceleration
 enable

> show cluster info
Cluster ftd_cluster1: On
    Interface mode: spanned
Cluster Member Limit : 16
    This is "unit-1-1" in state MASTER
        ID        : 0
        Site ID   : 1
        Version   : 9.17(1)
        Serial No.: FLM1949C5RR6HE
        CCL IP    : 10.173.1.1
        CCL MAC   : 0015.c500.018f
        Module    : FPR4K-SM-24
        Resource  : 20 cores / 44018 MB RAM
        Last join : 13:53:52 UTC May 20 2022
        Last leave: N/A
Other members in the cluster:
    Unit "unit-2-1" in state SLAVE
        ID        : 1
        Site ID   : 1
        Version   : 9.17(1)
        Serial No.: FLM2108V9YG7S1
        CCL IP    : 10.173.2.1
        CCL MAC   : 0015.c500.028f
        Module    : FPR4K-SM-24
        Resource  : 20 cores / 44018 MB RAM
        Last join : 14:02:46 UTC May 20 2022
        Last leave: 14:02:31 UTC May 20 2022
Note: The source and control roles are the same.
FTD SNMP
Follow these steps to verify the FTD high availability and scalability configuration and status via SNMP:
- Ensure that SNMP is configured and enabled. For FDM-managed FTD, refer to Configure and troubleshoot SNMP on Firepower FDM for configuration steps. For FMC-managed FTD, refer to Configure SNMP on Firepower NGFW Appliances for configuration steps.
- In order to verify the FTD failover configuration and status, poll the OID .1.3.6.1.4.1.9.9.147.1.2.1.1.1.
If the failover is not configured, this output is shown:
# snmpwalk -v2c -c cisco123 -On 192.0.2.5 .1.3.6.1.4.1.9.9.147.1.2.1.1.1
SNMPv2-SMI::enterprises.9.9.147.1.2.1.1.1.2.4 = STRING: "Failover LAN Interface"
SNMPv2-SMI::enterprises.9.9.147.1.2.1.1.1.2.6 = STRING: "Primary unit"
SNMPv2-SMI::enterprises.9.9.147.1.2.1.1.1.2.7 = STRING: "Secondary unit (this device)"
SNMPv2-SMI::enterprises.9.9.147.1.2.1.1.1.3.4 = INTEGER: 3
SNMPv2-SMI::enterprises.9.9.147.1.2.1.1.1.3.6 = INTEGER: 3
SNMPv2-SMI::enterprises.9.9.147.1.2.1.1.1.3.7 = INTEGER: 3
SNMPv2-SMI::enterprises.9.9.147.1.2.1.1.1.4.4 = STRING: "not Configured"
SNMPv2-SMI::enterprises.9.9.147.1.2.1.1.1.4.6 = STRING: "Failover Off"
SNMPv2-SMI::enterprises.9.9.147.1.2.1.1.1.4.7 = STRING: "Failover Off"
If the failover is configured, this output is shown:
# snmpwalk -v2c -c cisco123 -On 192.0.2.5 .1.3.6.1.4.1.9.9.147.1.2.1.1.1
SNMPv2-SMI::enterprises.9.9.147.1.2.1.1.1.2.4 = STRING: "Failover LAN Interface"
SNMPv2-SMI::enterprises.9.9.147.1.2.1.1.1.2.6 = STRING: "Primary unit (this device)"   <-- This device is primary
SNMPv2-SMI::enterprises.9.9.147.1.2.1.1.1.2.7 = STRING: "Secondary unit"
SNMPv2-SMI::enterprises.9.9.147.1.2.1.1.1.3.4 = INTEGER: 2
SNMPv2-SMI::enterprises.9.9.147.1.2.1.1.1.3.6 = INTEGER: 9
SNMPv2-SMI::enterprises.9.9.147.1.2.1.1.1.3.7 = INTEGER: 10
SNMPv2-SMI::enterprises.9.9.147.1.2.1.1.1.4.4 = STRING: "fover Ethernet1/2"
SNMPv2-SMI::enterprises.9.9.147.1.2.1.1.1.4.6 = STRING: "Active unit"                  <-- Primary device is active
SNMPv2-SMI::enterprises.9.9.147.1.2.1.1.1.4.7 = STRING: "Standby unit"
3. To verify the cluster configuration and status, poll the OID 1.3.6.1.4.1.9.9.491.1.8.1.
If the cluster is not configured, this output is shown:
# snmpwalk -v2c -c cisco123 192.0.2.5 .1.3.6.1.4.1.9.9.491.1.8.1
SNMPv2-SMI::enterprises.9.9.491.1.8.1.1.0 = INTEGER: 0
If the cluster is configured, but not enabled, this output is shown:
# snmpwalk -v2c -c cisco123 -On 192.0.2.7 .1.3.6.1.4.1.9.9.491.1.8.1
.1.3.6.1.4.1.9.9.491.1.8.1.1.0 = INTEGER: 0                    <-- Cluster status, disabled
.1.3.6.1.4.1.9.9.491.1.8.1.2.0 = INTEGER: 1
.1.3.6.1.4.1.9.9.491.1.8.1.3.0 = INTEGER: 0                    <-- Cluster unit state, disabled
.1.3.6.1.4.1.9.9.491.1.8.1.4.0 = INTEGER: 11
.1.3.6.1.4.1.9.9.491.1.8.1.5.0 = STRING: "ftd_cluster1"        <-- Cluster group name
.1.3.6.1.4.1.9.9.491.1.8.1.6.0 = STRING: "unit-1-1"            <-- Cluster unit name
.1.3.6.1.4.1.9.9.491.1.8.1.7.0 = INTEGER: 0                    <-- Cluster unit ID
.1.3.6.1.4.1.9.9.491.1.8.1.8.0 = INTEGER: 1                    <-- Cluster side ID
...
If the cluster is configured, enabled and operationally up, this output is shown:
# snmpwalk -v2c -c cisco123 -On 192.0.2.7 .1.3.6.1.4.1.9.9.491.1.8.1
.1.3.6.1.4.1.9.9.491.1.8.1.1.0 = INTEGER: 1                    <-- Cluster status, enabled
.1.3.6.1.4.1.9.9.491.1.8.1.2.0 = INTEGER: 1
.1.3.6.1.4.1.9.9.491.1.8.1.3.0 = INTEGER: 16                   <-- Cluster unit state, control unit
.1.3.6.1.4.1.9.9.491.1.8.1.4.0 = INTEGER: 10
.1.3.6.1.4.1.9.9.491.1.8.1.5.0 = STRING: "ftd_cluster1"        <-- Cluster group name
.1.3.6.1.4.1.9.9.491.1.8.1.6.0 = STRING: "unit-1-1"            <-- Cluster unit name
.1.3.6.1.4.1.9.9.491.1.8.1.7.0 = INTEGER: 0                    <-- Cluster unit ID
.1.3.6.1.4.1.9.9.491.1.8.1.8.0 = INTEGER: 1                    <-- Cluster side ID
...
For more information about the OID descriptions refer to the CISCO-UNIFIED-FIREWALL-MIB.
FTD Troubleshoot File
Follow these steps to verify the FTD high availability and scalability configuration and status in the FTD troubleshoot file:
1. Open the troubleshoot file and navigate to the folder <filename>-troubleshoot .tar/results-<date>--xxxxxx/command-outputs.
2. Open the file usr-local-sf-bin-sfcli.pl show_tech_support asa_lina_cli_util.output:
# pwd
/ngfw/var/common/results-05-22-2022--102758/command-outputs

# cat 'usr-local-sf-bin-sfcli.pl show_tech_support asa_lina_cli_util.output'
3. In order to verify the failover configuration and status, check the show failover section.
If the failover is not configured, this output is shown:
------------------ show failover ------------------

Failover Off
Failover unit Secondary
Failover LAN Interface: not Configured
Reconnect timeout 0:00:00
Unit Poll frequency 1 seconds, holdtime 15 seconds
Interface Poll frequency 5 seconds, holdtime 25 seconds
Interface Policy 1
Monitored Interfaces 3 of 1292 maximum
MAC Address Move Notification Interval not set
If the failover is configured, this output is shown:
------------------ show failover ------------------

Failover On
Failover unit Primary
Failover LAN Interface: fover Ethernet1/2 (up)
Reconnect timeout 0:00:00
Unit Poll frequency 1 seconds, holdtime 15 seconds
Interface Poll frequency 5 seconds, holdtime 25 seconds
Interface Policy 1
Monitored Interfaces 1 of 1291 maximum
MAC Address Move Notification Interval not set
failover replication http
Version: Ours 9.17(1), Mate 9.17(1)
Serial Number: Ours FLM2006EN9UR93, Mate FLM2006EQFWAGG
Last Failover at: 13:45:46 UTC May 20 2022
        This host: Primary - Active
                Active time: 161681 (sec)
                slot 0: UCSB-B200-M3-U hw/sw rev (0.0/9.17(1)) status (Up Sys)
                  Interface diagnostic (0.0.0.0): Normal (Waiting)
                slot 1: snort rev (1.0)  status (up)
                slot 2: diskstatus rev (1.0)  status (up)
        Other host: Secondary - Standby Ready
                Active time: 0 (sec)
                slot 0: UCSB-B200-M3-U hw/sw rev (0.0/9.17(1)) status (Up Sys)
                  Interface diagnostic (0.0.0.0): Normal (Waiting)
                slot 1: snort rev (1.0)  status (up)
                slot 2: diskstatus rev (1.0)  status (up)…
4. In order to verify the FTD cluster configuration and status, check the show cluster info section.
If the cluster is not configured, this output is shown:
------------------ show cluster info ------------------
Clustering is not configured
If the cluster is configured and enabled, this output is shown:
------------------ show cluster info ------------------
Cluster ftd_cluster1: On
    Interface mode: spanned
Cluster Member Limit : 16
    This is "unit-1-1" in state MASTER
        ID        : 0
        Site ID   : 1
        Version   : 9.17(1)
        Serial No.: FLM1949C5RR6HE
        CCL IP    : 10.173.1.1
        CCL MAC   : 0015.c500.018f
        Module    : FPR4K-SM-24
        Resource  : 20 cores / 44018 MB RAM
        Last join : 13:53:52 UTC May 20 2022
        Last leave: N/A
Other members in the cluster:
    Unit "unit-2-1" in state SLAVE
        ID        : 1
        Site ID   : 1
        Version   : 9.17(1)
        Serial No.: FLM2108V9YG7S1
        CCL IP    : 10.173.2.1
        CCL MAC   : 0015.c500.028f
        Module    : FPR4K-SM-24
        Resource  : 20 cores / 44018 MB RAM
        Last join : 14:02:46 UTC May 20 2022
        Last leave: 14:02:31 UTC May 20 2022
FMC UI
Follow these steps to verify the FTD high availability and scalability configuration and status on the FMC UI:
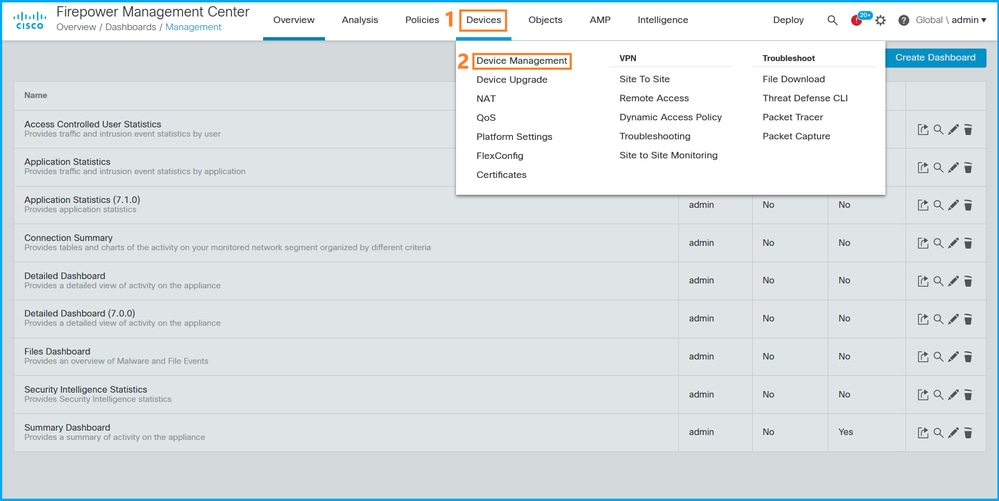
1. Choose Devices > Device Management:

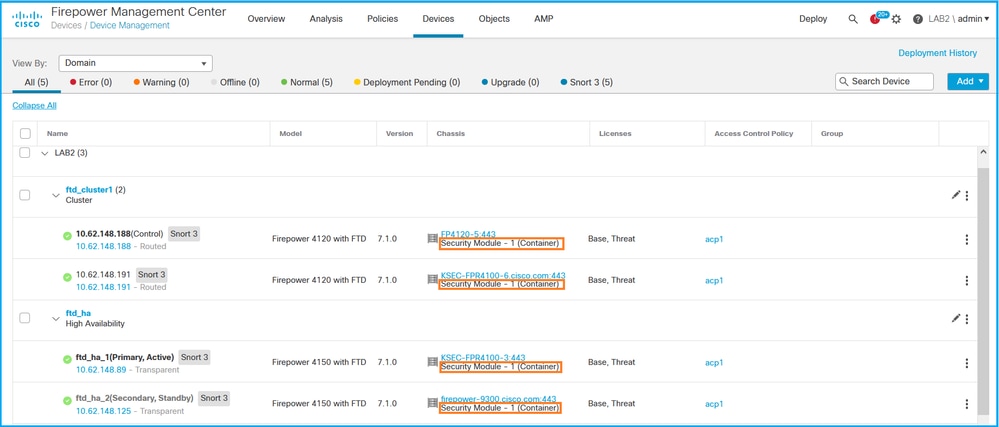
2. In order to verify the FTD high availability and scalability configuration, check the labels High Availability or Cluster. If neither exists, then the FTD runs in a standalone configuration:
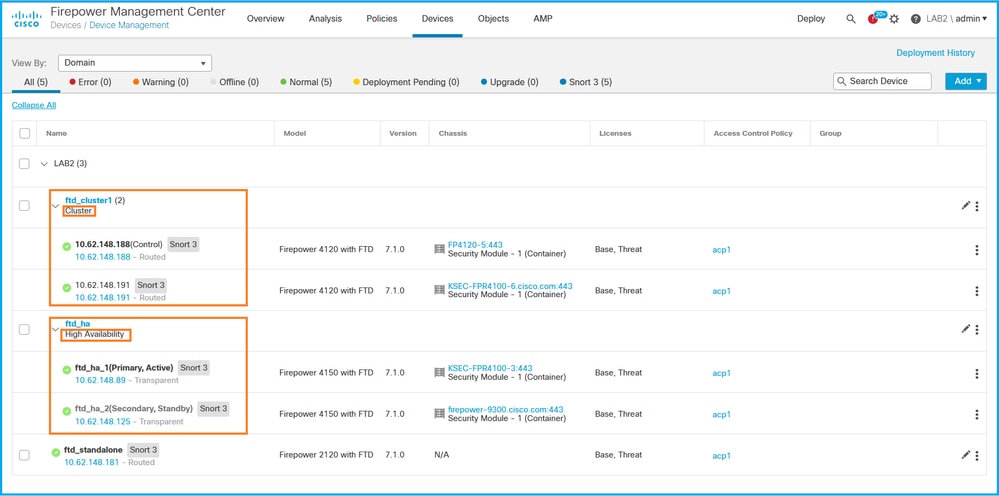
3. In order to verify the FTD high availability and scalability status, check the unit role in parenthesis. If a role does not exist and the FTD is not part of a cluster or failover, then FTD runs in a standalone configuration:
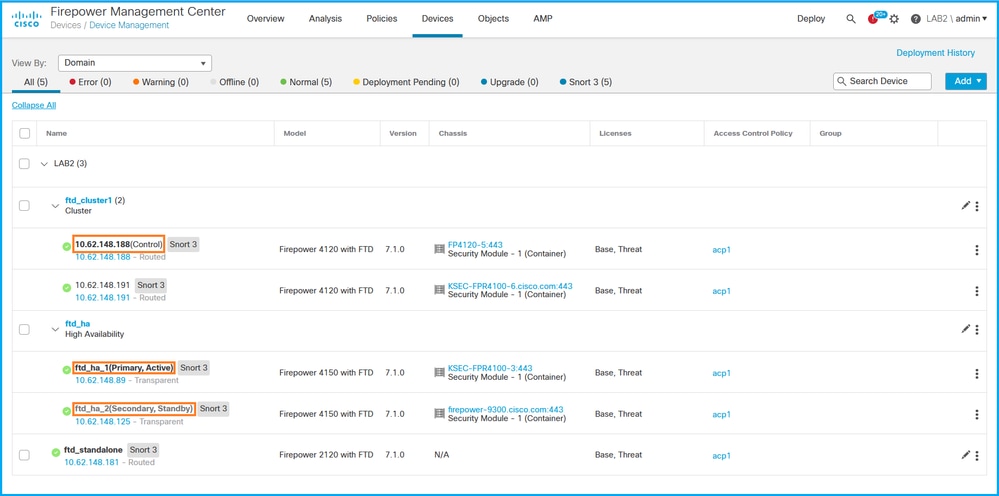
Note: In the case of a cluster, only the role of the control unit is shown.
FMC REST API
In these outputs, ftd_ha_1, ftd_ha_2, ftd_standalone, ftd_ha, ftc_cluster1 are user-configurable device names. These names do not refer to the actual high availability and scalability configuration or status.
Follow these steps to verify the FTD high availability and scalability configuration and status via FMC REST-API. Use a REST-API client. In this example, curl is used:
- Request an authentication token:
# curl -s -k -v -X POST 'https://192.0.2.1/api/fmc_platform/v1/auth/generatetoken' -H 'Authentication: Basic' -u 'admin:Cisco123' | grep -i X-auth-access-token

< X-auth-access-token: 5d817ef7-f12f-4dae-b0c0-cd742d3bd2eb
2. Identify the domain that contains the device. In most of the REST API queries the domain parameter is mandatory. Use the token in this query to retrieve the list of domains:
# curl -s -k -X 'GET'  'https://192.0.2.1/api/fmc_platform/v1/info/domain' -H 'accept: application/json'  -H 'X-auth-access-token: 5d817ef7-f12f-4dae-b0c0-cd742d3bd2eb' | python -m json.tool
{
   "items":
 [
         {
             "name": "Global",
             "type": "Domain",
             "uuid": "e276abec-e0f2-11e3-8169-6d9ed49b625f"
         },
         {
             "name": "Global/LAB2",
             "type": "Domain",
             "uuid": "84cc4afe-02bc-b80a-4b09-000000000000"
         },
...
3. Use the domain UUID to query the specific devicerecords and the specific device UUID:
# curl -s -k -X 'GET'  'https://192.0.2.1/api/fmc_config/v1/domain/84cc4afe-02bc-b80a-4b09-000000000000/devices/devicerecords' -H 'accept: application/json'  -H 'X-auth-access-token: 5d817ef7-f12f-4dae-b0c0-cd742d3bd2eb' | python -m json.tool
{
    "items": [
        {
            "id": "796eb8f8-d83b-11ec-941d-b9083eb612d8",
            "links": {
                "self": "https://192.0.2.1/api/fmc_config/v1/domain/84cc4afe-02bc-b80a-4b09-000000000000/devices/devicerecords/796eb8f8-d83b-11ec-941d-b9083eb612d8"
            },
            "name": "ftd_ha_1",
            "type": "Device"
        },
       ...
4. In order to verify the failover configuration, use the domain UUID and the device/container UUID from Step 3 in this query:
# curl -s -k -X GET 'https://192.0.2.1/api/fmc_config/v1/domain/84cc4afe-02bc-b80a-4b09-000000000000/devices/devicerecords/796eb8f8-d83b-11ec-941d-b9083eb612d8' -H 'X-auth-access-token: 5d817ef7-f12f-4dae-b0c0-cd742d3bd2eb' | python -m json.tool
...
        "containerDetails": {
            "id": "eec3ddfc-d842-11ec-a15e-986001c83f2f",
            "name": "ftd_ha",
            "type": "DeviceHAPair"
        },
...
5. In order to verify the failover status, use the domain UUID and the DeviceHAPair UUID from Step 4 in this query:
# curl -s -k -X GET 'https://192.0.2.1/api/fmc_config/v1/domain/84cc4afe-02bc-b80a-4b09-000000000000/devicehapairs/ftddevicehapairs/eec3ddfc-d842-11ec-a15e-986001c83f2f' -H 'X-auth-access-token: 5d817ef7-f12f-4dae-b0c0-cd742d3bd2eb' | python -m json.tool
...
        "primaryStatus": {
            "currentStatus": "Active",
            "device": {
                "id": "796eb8f8-d83b-11ec-941d-b9083eb612d8",
                "keepLocalEvents": false,
                "name": "ftd_ha_1"
            }
        },
        "secondaryStatus": {
            "currentStatus": "Standby",
            "device": {
                "id": "e60ca6d0-d83d-11ec-b407-cdc91a553663",
                "keepLocalEvents": false,
                "name": "ftd_ha_2"
            }
        }
...
6. In order to verify the cluster configuration, use the domain UUID and the device/container UUID from Step 3 in this query:
# curl -s -k -X GET 'https://192.0.2.1/api/fmc_config/v1/domain/84cc4afe-02bc-b80a-4b09-000000000000/devices/devicerecords/3344bc4a-d842-11ec-a995-817e361f7ea5' -H 'X-auth-access-token: 5d817ef7-f12f-4dae-b0c0-cd742d3bd2eb' | python -m json.tool
...
        "containerDetails": {
            "id": "8e6188c2-d844-11ec-bdd1-6e8d3e226370",
            "links": {
                "self": "https://192.0.2.1/api/fmc_config/v1/domain/84cc4afe-02bc-b80a-4b09-000000000000/deviceclusters/ftddevicecluster/8e6188c2-d844-11ec-bdd1-6e8d3e226370"
            },
            "name": "ftd_cluster1",
            "type": "DeviceCluster"
        },
...
- In order to verify the cluster status, use the domain UUID and the device/container UUID from Step 6 in this query:
# curl -s -k -X GET 'https://192.0.2.1/api/fmc_config/v1/domain/84cc4afe-02bc-b80a-4b09-000000000000/deviceclusters/ftddevicecluster/8e6188c2-d844-11ec-bdd1-6e8d3e226370' -H 'X-auth-access-token: 5d817ef7-f12f-4dae-b0c0-cd742d3bd2eb' | python -m json.tool
{
    "controlDevice": {
        "deviceDetails": {
            "id": "3344bc4a-d842-11ec-a995-817e361f7ea5",
            "name": "10.62.148.188",
            "type": "Device"
        }
    },
    "dataDevices": [
        {
            "deviceDetails": {
                "id": "a7ba63cc-d842-11ec-be51-f3efcd7cd5e5",
                "name": "10.62.148.191",
                "type": "Device"
            }
        }
    ],
    "id": "8e6188c2-d844-11ec-bdd1-6e8d3e226370",
    "name": "ftd_cluster1",
    "type": "DeviceCluster"
}
FDM UI
Follow the steps in the section.
FDM REST-API
Follow the steps in the section.
FCM UI
FCM UI is available on Firepower 4100/9300 and Firepower 2100 with ASA in platform mode.
Follow these steps to verify the FTD high availability and scalability status on the FCM UI:
1. In order to verify the FTD failover status, check the HA-ROLE attribute value on the Logical Devices page:

Note: The Standalone label next to the logical device identifier refers to the chassis logical device configuration, not the FTD failover configuration.
2. In order to verify the FTD cluster configuration and status, check the Clustered label and the CLUSTER-ROLE attribute value on the Logical Devices page:

FXOS CLI
The FTD high availability and scalability configuration and status verification on the FXOS CLI are available on Firepower 4100/9300.
Follow these steps to verify the FTD high availability and scalability configuration and status on the FXOS CLI:
1. Establish a console or SSH connection to the chassis.
2. In order to verify the FTD high availability status, run the scope ssa command, then run scope slot <x> to switch to the specific slot where the FTD runs and run the show app-instance expand command:
firepower # scope ssa
firepower /ssa # scope slot 1
firepower  /ssa/slot # show app-instance expand

Application Instance:
    App Name: ftd
    Identifier: ftd1
    Admin State: Enabled
    Oper State: Online
    Running Version: 7.1.0.90
    Startup Version: 7.1.0.90
    Deploy Type: Container
    Turbo Mode: No
    Profile Name: RP20
    Cluster State: Not Applicable
    Cluster Role: None

    App Attribute:
        App Attribute Key Value
        ----------------- -----
        firepower-mgmt-ip 192.0.2.5
        ha-lan-intf       Ethernet1/2
        ha-link-intf      Ethernet1/2
        ha-role           active
        mgmt-url          https://192.0.2.1/
        uuid              796eb8f8-d83b-11ec-941d-b9083eb612d8
...
3. In order to verify the FTD cluster configuration and status, run the scope ssa command, run the show logical-device <name> detail expand command, where the name is the logical device name, and the show app-instance command. Check the output for a specific slot:
firepower # scope ssa
firepower /ssa # show logical-device ftd_cluster1 detail expand

Logical Device:
    Name: ftd_cluster1
    Description:
    Slot ID: 1
    Mode: Clustered
    Oper State: Ok
    Template Name: ftd
    Error Msg:
    Switch Configuration Status: Ok
    Sync Data External Port Link State with FTD: Disabled
    Current Task:
…
firepower /ssa # show app-instance
App Name   Identifier Slot ID    Admin State Oper State       Running Version Startup Version Deploy Type Turbo Mode Profile Name Cluster State   Cluster Role
---------- ---------- ---------- ----------- ---------------- --------------- --------------- ----------- ---------- ------------ --------------- ------------
ftd        ftd_cluster1 1          Enabled     Online           7.1.0.90        7.1.0.90        Container   No         RP20         In Cluster      Master
FXOS REST API
FXOS REST-API is supported on Firepower 4100/9300.
Follow these steps to verify the FTD high availability and scalability configuration and status via FXOS REST-API request. Use a REST-API client. In this example, curl is used:
1. Request an authentication token:
# curl -k -X POST -H 'USERNAME: admin' -H 'PASSWORD: Cisco123'  'https://192.0.2.100/api/login'
{
    "refreshPeriod": "0",
    "token": "3dba916cdfb850c204b306a138cde9659ba997da4453cdc0c37ffb888816c94d"
}
2. In order to verify the FTD failover status, use the token and the slot ID in this query:
# curl -s -k -X GET -H 'Accept: application/json' -H 'token: 3dba916cdfb850c204b306a138cde9659ba997da4453cdc0c37ffb888816c94d' 'https://192.0.2.100/api/slot/1/app-inst'
...
{
    "smAppInstance": [
        {
            "adminState": "enabled",
            "appDn": "sec-svc/app-ftd-7.1.0.90",
            "appInstId": "ftd_001_JAD201200R43VLP1G3",
            "appName": "ftd",
            "clearLogData": "available",
            "clusterOperationalState": "not-applicable",
            "clusterRole": "none",
            "currentJobProgress": "100",
            "currentJobState": "succeeded",
            "currentJobType": "start",
            "deployType": "container",
            "dn": "slot/1/app-inst/ftd-ftd1",
            "errorMsg": "",
            "eventMsg": "",
            "executeCmd": "ok",
            "externallyUpgraded": "no",
            "fsmDescr": "",
            "fsmProgr": "100",
            "fsmRmtInvErrCode": "none",
            "fsmRmtInvErrDescr": "",
            "fsmRmtInvRslt": "",
            "fsmStageDescr": "",
            "fsmStatus": "nop",
            "fsmTry": "0",
            "hotfix": "",
            "identifier": "ftd1",
            "operationalState": "online",
            "reasonForDebundle": "",
            "resourceProfileName": "RP20",
            "runningVersion": "7.1.0.90",
            "smAppAttribute": [
                {
                    "key": "firepower-mgmt-ip",
                    "rn": "app-attribute-firepower-mgmt-ip",
                    "urllink": "https://192.0.2.100/api/slot/1/app/inst/ftd-ftd1/app/attribute-firepower-mgmt-ip",
                    "value": "192.0.2.5"
                },
                {
                    "key": "ha-link-intf",
                    "rn": "app-attribute-ha-link-intf",
                    "urllink": "https://192.0.2.100/api/slot/1/app/inst/ftd-ftd1/app/attribute-ha-link-intf",
                    "value": "Ethernet1/2"
                },
                {
                    "key": "ha-lan-intf",
                    "rn": "app-attribute-ha-lan-intf",
                    "urllink": "https://192.0.2.100/api/slot/1/app/inst/ftd-ftd1/app/attribute-ha-lan-intf",
                    "value": "Ethernet1/2"
                },
                {
                    "key": "mgmt-url",
                    "rn": "app-attribute-mgmt-url",
                    "urllink": "https://192.0.2.100/api/slot/1/app/inst/ftd-ftd1/app/attribute-mgmt-url",
                    "value": "https://192.0.2.1/"
                },
                {
                    "key": "ha-role",
                    "rn": "app-attribute-ha-role",
                    "urllink": "https://192.0.2.100/api/slot/1/app/inst/ftd-ftd1/app/attribute-ha-role",
                    "value": "active"
                },
                {
                    "key": "uuid",
                    "rn": "app-attribute-uuid",
                    "urllink": "https://192.0.2.100/api/slot/1/app/inst/ftd-ftd1/app/attribute-uuid",
                    "value": "796eb8f8-d83b-11ec-941d-b9083eb612d8"
                }
            ],
...
- In order to verify the FTD cluster configuration, use the logical device identifier in this query:
# curl -s -k -X GET -H 'Accept: application/json' -H 'token: 3dba916cdfb850c204b306a138cde9659ba997da4453cdc0c37ffb888816c94d' 'https://192.0.2.102/api/ld/ftd_cluster1'
{
    "smLogicalDevice": [
        {
            "description": "",
            "dn": "ld/ftd_cluster1",
            "errorMsg": "",
            "fsmDescr": "",
            "fsmProgr": "100",
            "fsmRmtInvErrCode": "none",
            "fsmRmtInvErrDescr": "",
            "fsmRmtInvRslt": "",
            "fsmStageDescr": "",
            "fsmStatus": "nop",
            "fsmTaskBits": "",
            "fsmTry": "0",
            "ldMode": "clustered",
            "linkStateSync": "disabled",
            "name": "ftd_cluster1",
            "operationalState": "ok",
            "slotId": "1",
            "smClusterBootstrap": [
                {
                    "cclNetwork": "10.173.0.0",
                    "chassisId": "1",
                    "gatewayv4": "0.0.0.0",
                    "gatewayv6": "::",
                    "key": "",
                    "mode": "spanned-etherchannel",
                    "name": "ftd_cluster1",
                    "netmaskv4": "0.0.0.0",
                    "poolEndv4": "0.0.0.0",
                    "poolEndv6": "::",
                    "poolStartv4": "0.0.0.0",
                    "poolStartv6": "::",
                    "prefixLength": "",
                    "rn": "cluster-bootstrap",
                    "siteId": "1",
                    "supportCclSubnet": "supported",
                    "updateTimestamp": "2022-05-20T13:38:21.872",
                    "urllink": "https://192.0.2.101/api/ld/ftd_cluster1/cluster-bootstrap",
                    "virtualIPv4": "0.0.0.0",
                    "virtualIPv6": "::"
                }
            ],
...
4. In order to verify the FTD cluster status, use this query:
# curl -s -k -X GET -H 'Accept: application/json' -H 'token: 3dba916cdfb850c204b306a138cde9659ba997da4453cdc0c37ffb888816c94d' 'https://192.0.2.102/api/slot/1/app-inst'
{
    "smAppInstance": [
        {
            "adminState": "enabled",
            "appDn": "sec-svc/app-ftd-7.1.0.90",
            "appInstId": "ftd_001_JAD19500BABIYA3OO58",
            "appName": "ftd",
            "clearLogData": "available",
            "clusterOperationalState": "in-cluster",
            "clusterRole": "master",
            "currentJobProgress": "100",
            "currentJobState": "succeeded",
            "currentJobType": "start",
            "deployType": "container",
            "dn": "slot/1/app-inst/ftd-ftd_cluster1",
            "errorMsg": "",
            "eventMsg": "",
            "executeCmd": "ok",
            "externallyUpgraded": "no",
            "fsmDescr": "",
            "fsmProgr": "100",
            "fsmRmtInvErrCode": "none",
            "fsmRmtInvErrDescr": "",
            "fsmRmtInvRslt": "",
            "fsmStageDescr": "",
            "fsmStatus": "nop",
            "fsmTry": "0",
            "hotfix": "",
            "identifier": "ftd_cluster1",
            "operationalState": "online",
            "reasonForDebundle": "",
            "resourceProfileName": "RP20",
            "runningVersion": "7.1.0.90",
...
FXOS Chassis show-tech File
The FTD high availability and scalability configuration and status can be verified in the Firepower 4100/9300 chassis show-tech file.
Follow these steps to verify the high availability and scalability configuration and status in the FXOS chassis show-tech file:
- For FXOS versions 2.7 and later, open the file sam_techsupportinfo in <name>_BC1_all.tar/FPRM_A_TechSupport.tar.gz/FPRM_A_TechSupport.tar
For earlier versions, open the file sam_techsupportinfo in FPRM_A_TechSupport.tar.gz/FPRM_A_TechSupport.tar.
2. In order to verify the failover status, check the value of the ha-role attribute value under the specific slot in the `show slot expand detail` section:
# pwd
/var/tmp/20220313201802_F241-01-11-FPR-2_BC1_all/FPRM_A_TechSupport/

# cat sam_techsupportinfo
...
`show slot expand detail`
Slot:
    Slot ID: 1
    Log Level: Info
    Admin State: Ok
    Oper State: Online
    Disk Format State: Ok
    Disk Format Status: 100%
    Clear Log Data: Available
    Error Msg:

    Application Instance:
        App Name: ftd
        Identifier: ftd1
        Admin State: Enabled
        Oper State: Online
        Running Version: 7.1.0.90
        Startup Version: 7.1.0.90
        Deploy Type: Container
        Turbo Mode: No
        Profile Name: RP20
        Hotfixes:
        Externally Upgraded: No
        Cluster State: Not Applicable
        Cluster Role: None
        Current Job Type: Start
        Current Job Progress: 100
        Current Job State: Succeeded
        Clear Log Data: Available
        Error Msg:
        Current Task:

        App Attribute:
            App Attribute Key: firepower-mgmt-ip
            Value: 10.62.148.89

            App Attribute Key: ha-lan-intf
            Value: Ethernet1/2

            App Attribute Key: ha-link-intf
            Value: Ethernet1/2

            App Attribute Key: ha-role
            Value: active

            App Attribute Key: mgmt-url
            Value: https://10.62.184.21/
3. In order to verify the FTD cluster configuration, check the value of the Mode attribute value under the specific slot in the `show logical-device detail expand` section:
`show logical-device detail expand`

Logical Device:
    Name: ftd_cluster1
    Description:
    Slot ID: 1
    Mode: Clustered
    Oper State: Ok
    Template Name: ftd
    Error Msg:
    Switch Configuration Status: Ok
    Sync Data External Port Link State with FTD: Disabled
    Current Task:

    Cluster Bootstrap:
        Name of the cluster: ftd_cluster1
        Mode: Spanned Etherchannel
        Chassis Id: 1
        Site Id: 1
        Key:
        Cluster Virtual IP: 0.0.0.0
        IPv4 Netmask: 0.0.0.0
        IPv4 Gateway: 0.0.0.0
        Pool Start IPv4 Address: 0.0.0.0
        Pool End IPv4 Address: 0.0.0.0
        Cluster Virtual IPv6 Address: ::
        IPv6 Prefix Length:
        IPv6 Gateway: ::
        Pool Start IPv6 Address: ::
        Pool End IPv6 Address: ::
        Last Updated Timestamp: 2022-05-20T13:38:21.872
        Cluster Control Link Network: 10.173.0.0
 ...
4. In order to verify the FTD cluster status, check the value of the Cluster State and Cluster Role attribute values under the specific slot in the `show slot expand detail` section:
`show slot expand detail`

Slot:
    Slot ID: 1
    Log Level: Info
    Admin State: Ok
    Oper State: Online
    Disk Format State: Ok
    Disk Format Status:
    Clear Log Data: Available
    Error Msg:

    Application Instance:
        App Name: ftd
        Identifier: ftd_cluster1
        Admin State: Enabled
        Oper State: Online
        Running Version: 7.1.0.90
        Startup Version: 7.1.0.90
        Deploy Type: Native
        Turbo Mode: No
        Profile Name:
        Hotfixes:
        Externally Upgraded: No
        Cluster State: In Cluster
        Cluster Role: Master
        Current Job Type: Start
        Current Job Progress: 100
        Current Job State: Succeeded
        Clear Log Data: Available
        Error Msg:
        Current Task:
ASA High Availability and Scalability
ASA high availability and scalability configuration and status can be verified with the use of these options:
- ASA CLI
- ASA SNMP poll
- ASA show-tech file
- FCM UI
- FXOS CLI
- FXOS REST-API
- FXOS chassis show-tech file
ASA CLI
Follow these steps to verify the ASA high availability and scalability configuration on the ASA CLI:
- Use these options to access the ASA CLI in accordance with the platform and deployment mode:
- Direct telnet/SSH access to ASA on Firepower 1000/3100 and Firepower 2100 in appliance mode
- Access from FXOS console CLI on Firepower 2100 in platform mode and connect to ASA via the connect asa command
- Access from FXOS CLI via commands (Firepower 4100/9300):
connect module <x> [console|telnet], where x is the slot ID, and then connect asa
- For virtual ASA, direct SSH access to ASA, or console access from the hypervisor or cloud UI
2. In order to verify the ASA failover configuration and status, run the show running-config failover and show failover state commands on the ASA CLI.
If the failover is not configured, this output is shown:
asa# show running-config failover
no failover
asa# show failover state
                  State          Last Failure Reason      Date/Time
 This host  -     Secondary
                  Disabled       None
 Other host -     Primary
                  Not Detected   None
 ====Configuration State===
 ====Communication State==
If the failover is configured, this output is shown:
asa# show running-config failover
failover
failover lan unit primary
failover lan interface failover-link Ethernet1/1
failover replication http
failover link failover-link Ethernet1/1
failover interface ip failover-link 10.30.35.2 255.255.255.0 standby 10.30.35.3

# show failover state
               State          Last Failure Reason      Date/Time
This host  -   Primary
               Active         None
Other host -   Secondary
               Standby Ready  Comm Failure             19:42:22 UTC May 21 2022
====Configuration State===
        Sync Done
====Communication State===
        Mac set
3. In order to verify the ASA cluster configuration and status, run the show running-config cluster and show cluster info commands on the CLI.
If the cluster is not configured, this output is shown:
asa# show running-config cluster
asa# show cluster info
Clustering is not configured
If the cluster is configured, this output is shown:
asa# show running-config cluster
cluster group asa_cluster1
 key *****
 local-unit unit-1-1
 cluster-interface Port-channel48.205 ip 10.174.1.1 255.255.0.0
 priority 9
 health-check holdtime 3
 health-check data-interface auto-rejoin 3 5 2
 health-check cluster-interface auto-rejoin unlimited 5 1
 health-check system auto-rejoin 3 5 2
 health-check monitor-interface debounce-time 500
 site-id 1
 no unit join-acceleration
 enable

asa# show cluster info
Cluster asa_cluster1: On
    Interface mode: spanned
Cluster Member Limit : 16
    This is "unit-1-1" in state MASTER
        ID        : 0
        Site ID   : 1
        Version   : 9.17(1)
        Serial No.: FLM2949C5232IT
        CCL IP    : 10.174.1.1
        CCL MAC   : 0015.c500.018f
        Module    : FPR4K-SM-24
...
ASA SNMP
Follow these steps to verify the ASA high availability and scalability configuration via SNMP:
- Ensure that SNMP is configured and enabled.
- In order to verify the failover configuration and status poll the OID .1.3.6.1.4.1.9.9.147.1.2.1.1.1.
If the failover is not configured, this output is shown:
# snmpwalk -v2c -c cisco123 -On 192.0.2.10 .1.3.6.1.4.1.9.9.147.1.2.1.1.1
SNMPv2-SMI::enterprises.9.9.147.1.2.1.1.1.2.4 = STRING: "Failover LAN Interface"
SNMPv2-SMI::enterprises.9.9.147.1.2.1.1.1.2.6 = STRING: "Primary unit"
SNMPv2-SMI::enterprises.9.9.147.1.2.1.1.1.2.7 = STRING: "Secondary unit (this device)"
SNMPv2-SMI::enterprises.9.9.147.1.2.1.1.1.3.4 = INTEGER: 3
SNMPv2-SMI::enterprises.9.9.147.1.2.1.1.1.3.6 = INTEGER: 3
SNMPv2-SMI::enterprises.9.9.147.1.2.1.1.1.3.7 = INTEGER: 3
SNMPv2-SMI::enterprises.9.9.147.1.2.1.1.1.4.4 = STRING: "not Configured"
SNMPv2-SMI::enterprises.9.9.147.1.2.1.1.1.4.6 = STRING: "Failover Off"
SNMPv2-SMI::enterprises.9.9.147.1.2.1.1.1.4.7 = STRING: "Failover Off"
If the failover is configured, this output is shown:
# snmpwalk -v2c -c cisco123 -On 192.0.2.10 .1.3.6.1.4.1.9.9.147.1.2.1.1.1
SNMPv2-SMI::enterprises.9.9.147.1.2.1.1.1.2.4 = STRING: "Failover LAN Interface"
SNMPv2-SMI::enterprises.9.9.147.1.2.1.1.1.2.6 = STRING: "Primary unit (this device)"     <-- This device is primary
SNMPv2-SMI::enterprises.9.9.147.1.2.1.1.1.2.7 = STRING: "Secondary unit"
SNMPv2-SMI::enterprises.9.9.147.1.2.1.1.1.3.4 = INTEGER: 2
SNMPv2-SMI::enterprises.9.9.147.1.2.1.1.1.3.6 = INTEGER: 9
SNMPv2-SMI::enterprises.9.9.147.1.2.1.1.1.3.7 = INTEGER: 10
SNMPv2-SMI::enterprises.9.9.147.1.2.1.1.1.4.4 = STRING: "fover Ethernet1/2"
SNMPv2-SMI::enterprises.9.9.147.1.2.1.1.1.4.6 = STRING: "Active unit"                    <-- Primary device is active
SNMPv2-SMI::enterprises.9.9.147.1.2.1.1.1.4.7 = STRING: "Standby unit"
3. In order to verify the cluster configuration and status, poll the OID 1.3.6.1.4.1.9.9.491.1.8.1.
If the cluster is not configured, this output is shown:
# snmpwalk -v2c -c cisco123 192.0.2.12 .1.3.6.1.4.1.9.9.491.1.8.1
SNMPv2-SMI::enterprises.9.9.491.1.8.1.1.0 = INTEGER: 0
If the cluster is configured, but not enabled, this output is shown:
# snmpwalk -v2c -c cisco123 -On 192.0.2.12 .1.3.6.1.4.1.9.9.491.1.8.1
.1.3.6.1.4.1.9.9.491.1.8.1.1.0 = INTEGER: 0              <-- Cluster status, disabled
.1.3.6.1.4.1.9.9.491.1.8.1.2.0 = INTEGER: 1
.1.3.6.1.4.1.9.9.491.1.8.1.3.0 = INTEGER: 0              <-- Cluster unit state, disabled
.1.3.6.1.4.1.9.9.491.1.8.1.4.0 = INTEGER: 11
.1.3.6.1.4.1.9.9.491.1.8.1.5.0 = STRING: "asa_cluster1"  <-- Cluster group name
.1.3.6.1.4.1.9.9.491.1.8.1.6.0 = STRING: "unit-1-1"      <-- Cluster unit name
.1.3.6.1.4.1.9.9.491.1.8.1.7.0 = INTEGER: 0              <-- Cluster unit ID
.1.3.6.1.4.1.9.9.491.1.8.1.8.0 = INTEGER: 1              <-- Cluster side ID
...
If the cluster is configured, enabled and operationally up, this output is shown:
# snmpwalk -v2c -c cisco123 -On 192.0.2.12 .1.3.6.1.4.1.9.9.491.1.8.1
.1.3.6.1.4.1.9.9.491.1.8.1.1.0 = INTEGER: 1              <-- Cluster status, enabled
.1.3.6.1.4.1.9.9.491.1.8.1.2.0 = INTEGER: 1
.1.3.6.1.4.1.9.9.491.1.8.1.3.0 = INTEGER: 16             <-- Cluster unit state, control unit
.1.3.6.1.4.1.9.9.491.1.8.1.4.0 = INTEGER: 10
.1.3.6.1.4.1.9.9.491.1.8.1.5.0 = STRING: "asa_cluster1"  <-- Cluster group name
.1.3.6.1.4.1.9.9.491.1.8.1.6.0 = STRING: "unit-1-1"      <-- Cluster unit name
.1.3.6.1.4.1.9.9.491.1.8.1.7.0 = INTEGER: 0              <-- Cluster unit ID
.1.3.6.1.4.1.9.9.491.1.8.1.8.0 = INTEGER: 1              <-- Cluster side ID
...
For more information about the OID descriptions refer to the CISCO-UNIFIED-FIREWALL-MIB.
ASA show-tech File
1. In order to verify the ASA failover configuration and status, check the show failover section.
If the failover is not configured, this output is shown:
------------------ show failover ------------------

Failover Off
Failover unit Secondary
Failover LAN Interface: not Configured
Reconnect timeout 0:00:00
Unit Poll frequency 1 seconds, holdtime 15 seconds
Interface Poll frequency 5 seconds, holdtime 25 seconds
Interface Policy 1
Monitored Interfaces 3 of 1292 maximum
MAC Address Move Notification Interval not set
If the failover is configured, this output is shown:
------------------ show failover ------------------

Failover On
Failover unit Primary
Failover LAN Interface: fover Ethernet1/2 (up)
Reconnect timeout 0:00:00
Unit Poll frequency 1 seconds, holdtime 15 seconds
Interface Poll frequency 5 seconds, holdtime 25 seconds
Interface Policy 1
Monitored Interfaces 1 of 1291 maximum
MAC Address Move Notification Interval not set
failover replication http
Version: Ours 9.17(1), Mate 9.17(1)
Serial Number: Ours FLM2006EN9AB11, Mate FLM2006EQZY02
Last Failover at: 13:45:46 UTC May 20 2022
        This host: Primary - Active
                Active time: 161681 (sec)
                slot 0: UCSB-B200-M3-U hw/sw rev (0.0/9.17(1)) status (Up Sys)
        Other host: Secondary - Standby Ready
                Active time: 0 (sec)
                slot 0: UCSB-B200-M3-U hw/sw rev (0.0/9.17(1)) status (Up Sys)
...
2. In order to verify the cluster configuration and status, check the show cluster info section.
If the cluster is not configured, this output is shown:
------------------ show cluster info ------------------
Clustering is not configured
If the cluster is configured and enabled, this output is shown:
------------------ show cluster info ------------------
Cluster asa_cluster1: On
     Interface mode: spanned
 Cluster Member Limit : 16
     This is "unit-1-1" in state MASTER
         ID        : 0
         Site ID   : 1
         Version   : 9.17(1)
         Serial No.: FLM2949C5232IT
         CCL IP    : 10.174.1.1
         CCL MAC   : 0015.c500.018f
         Module    : FPR4K-SM-24
...
FCM UI
Follow the steps in the section.
FXOS CLI
Follow the steps in the section.
FXOS REST API
Follow the steps in the section.
FXOS Chassis show-tech File
Follow the steps in the section.
Verify the Firewall mode
FTD Firewall mode
The firewall mode refers to a routed or transparent firewall configuration.
The FTD firewall mode can be verified with the use of these options:
- FTD CLI
- FTD show-tech
- FMC UI
- FMC REST-API
- FCM UI
- FXOS CLI
- FXOS REST-API
- FXOS chassis show-tech file
Note: FDM does not support transparent mode.
FTD CLI
Follow these steps to verify the FTD firewall mode on the FTD CLI:
1. Use these options to access the FTD CLI in accordance with the platform and deployment mode:
- Direct SSH access to FTD - all platforms
- Access from the FXOS console CLI (Firepower 1000/2100/3100) via command connect ftd
- Access from the FXOS CLI via commands (Firepower 4100/9300):
connect module <x> [console|telnet], where x is the slot ID, and then
connect ftd [instance], where the instance is relevant only for multi-instance deployment.
- For virtual FTDs, direct SSH access to FTD, or console access from the hypervisor or cloud UI
2. In order to verify the firewall mode, run the show firewall command on the CLI:
> show firewall
Firewall mode: Transparent
FTD Troubleshoot File
Follow these steps to verify the FTD firewall mode in the FTD troubleshoot file:
1. Open the troubleshoot file and navigate to the folder <filename>-troubleshoot .tar/results-<date>--xxxxxx/command-outputs.
2. Open the file usr-local-sf-bin-sfcli.pl show_tech_support asa_lina_cli_util.output:
# pwd
/ngfw/var/common/results-05-22-2022--102758/command-outputs

# cat 'usr-local-sf-bin-sfcli.pl show_tech_support asa_lina_cli_util.output'
3. In order to verify the FTD firewall mode, check the show firewall section:
------------------ show firewall ------------------
Firewall mode: Transparent
FMC UI
Follow these steps to verify the FTD firewall mode on the FMC UI:
1. Choose Devices > Device Management:

2. Check the labels Routed or Transparent:
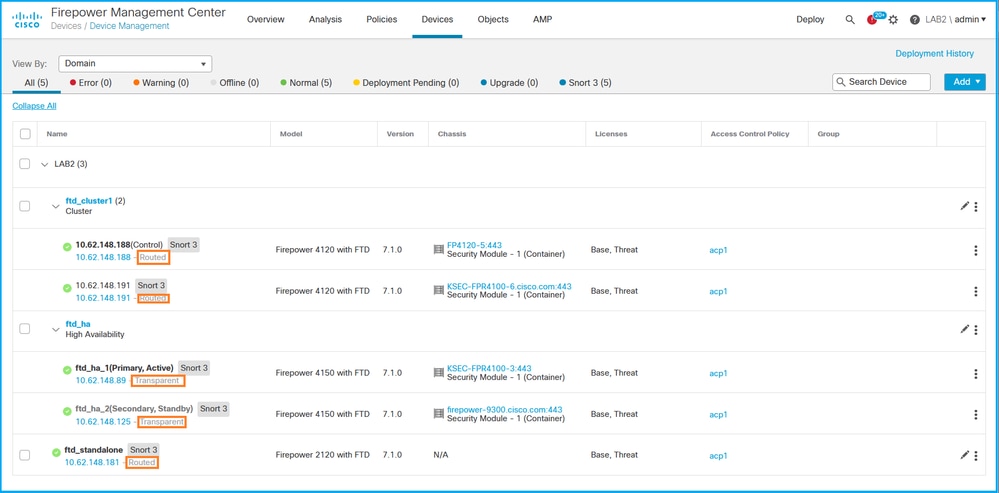
FMC REST API
Follow these steps to verify the FTD firewall mode via FMC REST-API. Use a REST-API client. In this example, curl is used:
- Request an authentication token:
# curl -s -k -v -X POST 'https://192.0.2.1/api/fmc_platform/v1/auth/generatetoken' -H 'Authentication: Basic' -u 'admin:Cisco123' | grep -i X-auth-access-token

< X-auth-access-token: 5d817ef7-f12f-4dae-b0c0-cd742d3bd2eb
2. Identify the domain that contains the device. In most of the REST API queries the domain parameter is mandatory. Use the token in this query to retrieve the list of domains:
# curl -s -k -X 'GET'  'https://192.0.2.1/api/fmc_platform/v1/info/domain' -H 'accept: application/json'  -H 'X-auth-access-token: 5d817ef7-f12f-4dae-b0c0-cd742d3bd2eb' | python -m json.tool
{
   "items":
 [
         {
             "name": "Global",
             "type": "Domain",
             "uuid": "e276abec-e0f2-11e3-8169-6d9ed49b625f"
         },
         {
             "name": "Global/LAB2",
             "type": "Domain",
             "uuid": "84cc4afe-02bc-b80a-4b09-000000000000"
         },
...
3. Use the domain UUID to query the specific devicerecords and the specific device UUID:
# curl -s -k -X 'GET'  'https://192.0.2.1/api/fmc_config/v1/domain/84cc4afe-02bc-b80a-4b09-000000000000/devices/devicerecords' -H 'accept: application/json'  -H 'X-auth-access-token: 5d817ef7-f12f-4dae-b0c0-cd742d3bd2eb' | python -m json.tool
{
    "items": [
        {
            "id": "796eb8f8-d83b-11ec-941d-b9083eb612d8",
            "links": {
                "self": "https://192.0.2.1/api/fmc_config/v1/domain/84cc4afe-02bc-b80a-4b09-000000000000/devices/devicerecords/796eb8f8-d83b-11ec-941d-b9083eb612d8"
            },
            "name": "ftd_ha_1",
            "type": "Device"
        },
        ...
4. Use the domain UUID and the device/container UUID from Step 3 in this query, and check the value of ftdMode:
# curl -s -k -X 'GET'  'https://192.0.2.1./api/fmc_config/v1/domain/84cc4afe-02bc-b80a-4b09-000000000000/devices/devicerecords/796eb8f8-d83b-11ec-941d-b9083eb612d8' -H 'accept: application/json'  -H 'X-auth-access-token: 5d817ef7-f12f-4dae-b0c0-cd742d3bd2eb' | python -m json.tool
...
{
    "accessPolicy": {
        "id": "00505691-3a23-0ed3-0006-536940224514",
        "name": "acp1",
        "type": "AccessPolicy"
    },
    "advanced": {
        "enableOGS": false
    },
    "description": "NOT SUPPORTED",
    "ftdMode": "ROUTED",
...
FCM UI
The firewall mode can be verified for FTD on Firepower 4100/9300.
Follow these steps to verify the FTD firewall mode on the FCM UI:
1. Edit the logical device on the Logical Devices page:

2. Click on the application icon, and check the Firewall Mode in the Settings tab:
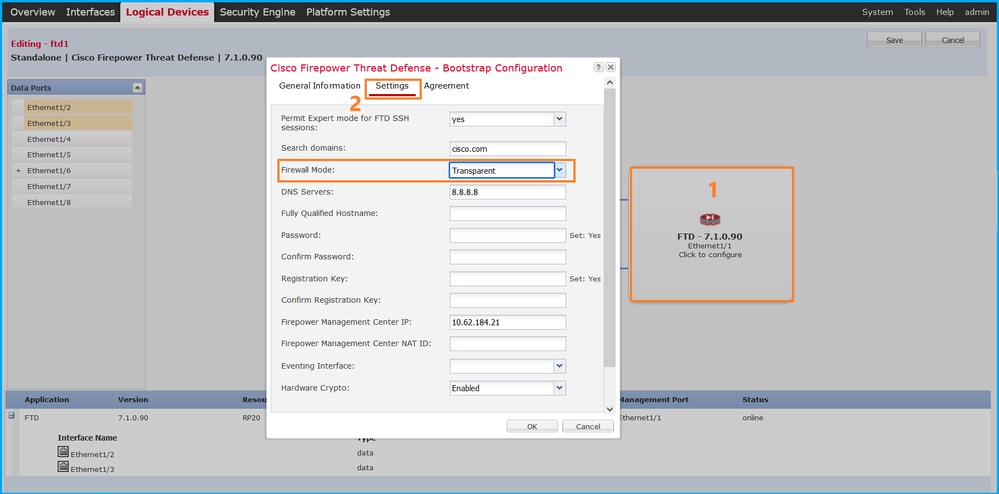
FXOS CLI
The firewall mode can be verified for FTD on Firepower 4100/9300.
Follow these steps to verify the FTD firewall mode on the FXOS CLI:
- Establish a console or SSH connection to the chassis.
- Switch to the scope ssa, then switch to the specific logical-device, run the show mgmt-bootstrap expand command, and check the FIREWALL_MODE attribute value:
firepower# scope ssa
firepower /ssa # scope logical-device ftd_cluster1
firepower /ssa/logical-device # show mgmt-bootstrap expand

Management Configuration:
    App Name: ftd

    Secret Bootstrap Key:
        Key                       Value
        ------------------------- -----
        PASSWORD
        REGISTRATION_KEY

    IP v4:
        Slot ID    Management Sub Type IP Address      Netmask         Gateway         Last Updated Timestamp
        ---------- ------------------- --------------- --------------- --------------- ----------------------
                 1 Firepower           10.62.148.188   255.255.255.128 10.62.148.129   2022-05-20T13:50:06.238

    Bootstrap Key:
        Key                       Value
        ------------------------- -----
        DNS_SERVERS               192.0.2.250
        FIREPOWER_MANAGER_IP      10.62.184.21
        FIREWALL_MODE             routed
        PERMIT_EXPERT_MODE        yes
        SEARCH_DOMAINS            cisco.com
...
FXOS REST API
FXOS REST-API is supported on Firepower 4100/9300.
Follow these steps to verify the FTD firewall mode via FXOS REST-API request. Use a REST-API client. In this example, curl is used:
- Request an authentication token:
# curl -k -X POST -H 'USERNAME: admin' -H 'PASSWORD: Cisco123'  https://192.0.2.100/api/ld/ftd_cluster1
{
    "refreshPeriod": "0",
    "token": "3dba916cdfb850c204b306a138cde9659ba997da4453cdc0c37ffb888816c94d"
}
2. Use the logical device identifier in this query and check the value of the FIREWALL_MODE key:
# curl -s -k -X GET -H 'Accept: application/json' -H 'token: 3dba916cdfb850c204b306a138cde9659ba997da4453cdc0c37ffb888816c94d' https://192.0.2.100/api/ld/ftd_cluster1
...
                        {
                            "key": "FIREWALL_MODE",
                            "rn": "key-FIREWALL_MODE",
                            "updateTimestamp": "2022-05-20T13:28:37.093",
                            "urllink": "https://192.0.2.100/api/ld/ftd_cluster1/mgmt-bootstrap/ftd/key/FIREWALL_MODE",
                            "value": "routed"
                        },
...
FXOS Chassis show-tech File
The firewall mode for FTD can be verified in the show-tech file of Firepower 4100/9300.
Follow these steps to verify the FTD firewall mode in the FXOS chassis show-tech file:
- For FXOS versions 2.7 and later, open the file sam_techsupportinfo in <name>_BC1_all.tar/ FPRM_A_TechSupport.tar.gz/FPRM_A_TechSupport.tar
For earlier versions, open the file sam_techsupportinfo in FPRM_A_TechSupport.tar.gz/ FPRM_A_TechSupport.tar.
- Check the `show logical-device detail expand` section under the specific identifier and the slot:
# pwd
/var/tmp/20220313201802_F241-01-11-FPR-2_BC1_all/FPRM_A_TechSupport/

# cat sam_techsupportinfo
...
`show logical-device detail expand`
Logical Device:
    Name: ftd_cluster1
    Description:
    Slot ID: 1
    Mode: Clustered
    Oper State: Ok
    Template Name: ftd
    Error Msg:
    Switch Configuration Status: Ok
    Sync Data External Port Link State with FTD: Disabled
    Current Task:
...
        Bootstrap Key:
            Key: DNS_SERVERS
            Value: 192.0.2.250
            Last Updated Timestamp: 2022-05-20T13:28:37.093

            Key: FIREPOWER_MANAGER_IP
            Value: 10.62.184.21
            Last Updated Timestamp: 2022-05-20T13:28:37.093

            Key: FIREWALL_MODE
            Value: routed
             Last Updated Timestamp: 2022-05-20T13:28:37.093
...
ASA Firewall Mode
The ASA firewall mode can be verified with the use of these options:
- ASA CLI
- ASA show-tech
- FCM UI
- FXOS CLI
- FXOS REST-API
- FXOS chassis show-tech file
ASA CLI
Follow these steps to verify the ASA firewall mode on the ASA CLI:
- Use these options to access the ASA CLI in accordance with the platform and deployment mode:
- Direct telnet/SSH access to ASA on Firepower 1000/3100 and Firepower 2100 in appliance mode
- Access from FXOS console CLI on Firepower 2100 in platform mode and connect to ASA via the connect asa command
- Access from FXOS CLI via commands (Firepower 4100/9300):
connect module <x> [console|telnet], where x is the slot ID, and then connect asa
- For virtual ASA, direct SSH access to ASA, or console access from the hypervisor or cloud UI
2. Run the show firewall command on the CLI:
asa# show firewall
Firewall mode: Routed
ASA show-tech File
In order to verify ASA firewall mode, check the show firewall section:
------------------ show firewall ------------------
Firewall mode: Routed
FCM UI
Follow the steps in the section.
FXOS CLI
Follow the steps in the section.
FXOS REST API
Follow the steps in the section.
FXOS Chassis show-tech File
Follow the steps in the section.
Verify Instance Deployment type
There are 2 application instance deployment types:
- Native instance - A native instance uses all the resources (CPU, RAM, and disk space) of the security module/engine, so you can only install one native instance.
- Container instance - A container instance uses a subset of resources of the security module/engine. Multi-instance capability is only supported for the FTD managed by FMC; it is not supported for the ASA or the FTD managed by FDM.
Container mode instance configuration is supported only for FTD on Firepower 4100/9300.
The instance deployment type can be verified with the use of these options:
- FTD CLI
- FTD Show-tech
- FMC UI
- FMC REST-API
- FCM UI
- FXOS CLI
- FXOS REST-API
- FXOS chassis show-tech file
FTD CLI
Follow these steps to verify the FTD instance deployment type on the FTD CLI:
- Use these options to access the FTD CLI in accordance with the platform and deployment mode:
- Direct SSH access to FTD - all platforms
- Access from the FXOS CLI via commands (Firepower 4100/9300):
connect module <x> [console|telnet], where x is the slot ID, and then connect ftd [instance], where the instance is relevant only for multi-instance deployment.
- Run the show version system command and check the line with the string SSP Slot Number. If the Container exists in this line, the FTD runs in a container mode:
> show version system
-------------------[ firepower ]--------------------
Model                     : Cisco Firepower 4120 Threat Defense (76) Version 7.1.0 (Build 90)
UUID                      : 3344bc4a-d842-11ec-a995-817e361f7ea5
VDB version               : 346
----------------------------------------------------

Cisco Adaptive Security Appliance Software Version 9.17(1)
SSP Operating System Version 2.11(1.154)

Compiled on Tue 30-Nov-21 18:38 GMT by builders
System image file is "disk0:/fxos-lfbff-k8.2.11.1.154.SPA"
Config file at boot was "startup-config"

firepower up 2 days 19 hours
Start-up time 3 secs

SSP Slot Number: 1 (Container)
…
FTD Troubleshoot file
Follow these steps to verify the FTD instance deployment type in the FTD troubleshoot file:
- Open the troubleshoot file and navigate to the folder <filename>-troubleshoot .tar/results-<date>--xxxxxx/command-outputs.
- Open the file usr-local-sf-bin-sfcli.pl show_tech_support asa_lina_cli_util.output:
# pwd
/ngfw/var/common/results-05-22-2022--102758/command-outputs
# cat 'usr-local-sf-bin-sfcli.pl show_tech_support asa_lina_cli_util.output'
- Check the line with the string SSP Slot Number. If the Container exists in this line, the FTD runs in a container mode:
-------------------[ firepower ]--------------------
Model                     : Cisco Firepower 4120 Threat Defense (76) Version 7.1.0 (Build 90)
UUID                      : 3344bc4a-d842-11ec-a995-817e361f7ea5
VDB version               : 346
----------------------------------------------------

Cisco Adaptive Security Appliance Software Version 9.17(1)
SSP Operating System Version 2.11(1.154)

Compiled on Tue 30-Nov-21 18:38 GMT by builders
System image file is "disk0:/fxos-lfbff-k8.2.11.1.154.SPA"
Config file at boot was "startup-config"

firepower up 2 days 19 hours
Start-up time 3 secs

SSP Slot Number: 1 (Container)
…
FMC UI
Follow these steps to verify the FTD instance deployment type on the FMC UI:
- Choose Devices > Device Management:
- Check the Chassis column. If the Container exists in the line, then FTD runs in container mode.
FMC REST-API
Follow these steps to verify the FTD instance deployment type via FMC REST-API. Use a REST-API client. In this example, curl is used:
- Request an authentication token:
# curl -s -k -v -X POST 'https://192.0.2.1/api/fmc_platform/v1/auth/generatetoken' -H 'Authentication: Basic' -u 'admin:Cisco123' | grep -i X-auth-access-token

< X-auth-access-token: 5d817ef7-f12f-4dae-b0c0-cd742d3bd2eb
2. Identify the domain that contains the device. In most of the REST API queries the domain parameter is mandatory. Use the token in this query to retrieve the list of domains:
# curl -s -k -X 'GET'  'https://192.0.2.1/api/fmc_platform/v1/info/domain' -H 'accept: application/json'  -H 'X-auth-access-token: 5d817ef7-f12f-4dae-b0c0-cd742d3bd2eb' | python -m json.tool
{
   "items":
 [
         {
             "name": "Global",
             "type": "Domain",
             "uuid": "e276abec-e0f2-11e3-8169-6d9ed49b625f"
         },
         {
             "name": "Global/LAB2",
             "type": "Domain",
             "uuid": "84cc4afe-02bc-b80a-4b09-000000000000"
         },
...
3. Use the domain UUID to query the specific devicerecords and the specific device UUID:
# curl -s -k -X 'GET'  'https://192.0.2.1/api/fmc_config/v1/domain/84cc4afe-02bc-b80a-4b09-000000000000/devices/devicerecords' -H 'accept: application/json'  -H 'X-auth-access-token: 5d817ef7-f12f-4dae-b0c0-cd742d3bd2eb' | python -m json.tool
{
    "items": [
        {
            "id": "796eb8f8-d83b-11ec-941d-b9083eb612d8",
            "links": {
                "self": "https://192.0.2.1/api/fmc_config/v1/domain/84cc4afe-02bc-b80a-4b09-000000000000/devices/devicerecords/796eb8f8-d83b-11ec-941d-b9083eb612d8"
            },
            "name": "ftd_ha_1",
            "type": "Device"
        },
...
4. Use the domain UUID and the device/container UUID from Step 3 in this query and check the value of isMultiInstance:
# curl -s -k -X 'GET'  'https://192.0.2.1./api/fmc_config/v1/domain/84cc4afe-02bc-b80a-4b09-000000000000/devices/devicerecords/796eb8f8-d83b-11ec-941d-b9083eb612d8' -H 'accept: application/json'  -H 'X-auth-access-token: 5d817ef7-f12f-4dae-b0c0-cd742d3bd2eb' | python -m json.tool
...
            "name": "ftd_cluster1",
            "isMultiInstance": true,
...
FCM UI
In order to verify the FTD instance deployment type, check the value of the Resource Profile attribute in Logical Devices. If the value is not empty, then the FTD runs in container mode:

FXOS CLI
Follow these steps to verify the FTD instance deployment type on the FXOS CLI:
- Establish a console or SSH connection to the chassis.
- Switch to the scope ssa and run the show app-instance command, then check the Deploy Type column of the specific FTD based on the slot and the identifier:
firepower # scope ssa
firepower /ssa # show app-instance
App Name   Identifier Slot ID    Admin State Oper State       Running Version Startup Version Deploy Type Turbo Mode Profile Name Cluster State   Cluster Role
---------- ---------- ---------- ----------- ---------------- --------------- --------------- ----------- ---------- ------------ --------------- ------------
ftd        ftd_cluster1 1          Enabled     Online           7.1.0.90        7.1.0.90        Container   No         RP20         In Cluster      Master
FXOS REST API
Follow these steps to verify the FTD instance deployment type via an FXOS REST-API request. Use a REST-API client. In this example, curl is used:
- Request an authentication token:
# curl -k -X POST -H 'USERNAME: admin' -H 'PASSWORD: Cisco123'  'https://10.62.148.88/api/login'
{
    "refreshPeriod": "0",
    "token": "3dba916cdfb850c204b306a138cde9659ba997da4453cdc0c37ffb888816c94d"
}
2. Specify the token, the slot ID in this query, and check the value of deployType:
# curl -s -k -X GET -H 'Accept: application/json' -H 'token: 3dba916cdfb850c204b306a138cde9659ba997da4453cdc0c37ffb888816c94d' https://192.0.2.100/api/slot/1/app-inst
…
{
    "smAppInstance": [
        {
            "adminState": "enabled",
            "appDn": "sec-svc/app-ftd-7.1.0.90",
            "appInstId": "ftd_001_JAD201200R43VLP1G3",
            "appName": "ftd",
            "clearLogData": "available",
            "clusterOperationalState": "not-applicable",
            "clusterRole": "none",
            "currentJobProgress": "100",
            "currentJobState": "succeeded",
            "currentJobType": "start",
            "deployType": "container",
...
FXOS Chassis show-tech File
Follow these steps to verify the FTD firewall mode in the FXOS chassis show-tech file:
- For FXOS versions 2.7 and later, open the file sam_techsupportinfo in <name>_BC1_all.tar/ FPRM_A_TechSupport.tar.gz/FPRM_A_TechSupport.tar
For earlier versions, open the file sam_techsupportinfo in FPRM_A_TechSupport.tar.gz/ FPRM_A_TechSupport.tar.
- Check the `show slot expand detail` section for the specific slot and the identifier:
# pwd
/var/tmp/20220313201802_F241-01-11-FPR-2_BC1_all/FPRM_A_TechSupport/

# cat sam_techsupportinfo
...
`show slot expand detail`

Slot:
    Slot ID: 1
    Log Level: Info
    Admin State: Ok
    Oper State: Online
    Disk Format State: Ok
    Disk Format Status: 100%
    Clear Log Data: Available
    Error Msg:

    Application Instance:
        App Name: ftd
        Identifier: ftd_cluster1
        Admin State: Enabled
        Oper State: Online
        Running Version: 7.1.0.90
        Startup Version: 7.1.0.90
        Deploy Type: Container
Verify ASA Context Mode
ASA supports single and multi-context modes. FTD does not support multi-context mode.
The context type can be verified with the use of these options:
- ASA CLI
- ASA show-tech
ASA CLI
Follow these steps to verify the ASA context mode on the ASA CLI:
- Use these options to access the ASA CLI in accordance with the platform and deployment mode:
- Direct telnet/SSH access to ASA on Firepower 1000/3100 and Firepower 2100 in appliance mode
- Access from FXOS console CLI on Firepower 2100 in platform mode and connect to ASA via the connect asa command
- Access from FXOS CLI via commands (Firepower 4100/9300):
connect module <x> [console|telnet], where x is the slot ID, and then connect asa
- For virtual ASA, direct SSH access to ASA, or console access from the hypervisor or cloud UI
2. Run the show mode command on the CLI:
ASA# show mode
Security context mode: multiple

ASA# show mode
Security context mode: single
ASA show-tech File
Follow these steps to verify the ASA context mode in the ASA show-tech file:
1. Check the show context detail section in the show-tech file. In this case, the context mode is multiple since there are multiple contexts:
------------------ show context detail ------------------

Context "system", is a system resource
  Config URL: startup-config
  Real Interfaces:
  Mapped Interfaces: Ethernet1/1, Ethernet1/10, Ethernet1/11,
     Ethernet1/12, Ethernet1/13, Ethernet1/14, Ethernet1/15,
     Ethernet1/16, Ethernet1/2, Ethernet1/3, Ethernet1/4, Ethernet1/5,
     Ethernet1/6, Ethernet1/7, Ethernet1/8, Ethernet1/9, Ethernet2/1,
     Ethernet2/2, Ethernet2/3, Ethernet2/4, Ethernet2/5, Ethernet2/6,
     Ethernet2/7, Ethernet2/8, Internal-Data0/1, Internal-Data1/1,
     Management1/1
  Class: default, Flags: 0x00000819, ID: 0

Context "admin", has been created
  Config URL: disk0:/admin.cfg
  Real Interfaces: Ethernet1/1, Ethernet1/2, Management1/1
  Mapped Interfaces: Ethernet1/1, Ethernet1/2, Management1/1
  Real IPS Sensors:
  Mapped IPS Sensors:
  Class: default, Flags: 0x00000813, ID: 1

Context "null", is a system resource
  Config URL: ... null ...
  Real Interfaces:
  Mapped Interfaces:
  Real IPS Sensors:
  Mapped IPS Sensors:
  Class: default, Flags: 0x00000809, ID: 507
Verify the Firepower 2100 Mode with ASA
Firepower 2100 with ASA can run in one of these modes:
-
Platform mode - basic operating parameters and hardware interface settings are configured in FXOS. These settings include interfaces admin state change, EtherChannel configuration, NTP, image management, and more. FCM web interface or FXOS CLI can be used for FXOS configuration.
-
Appliance mode (the default) - Appliance mode allows users to configure all policies in the ASA. Only advanced commands are available from the FXOS CLI.
Firepower 2100 mode with ASA be verified with the use of these options:
- ASA CLI
- FXOS CLI
- FXOS show-tech
ASA CLI
Follow these steps to verify the Firepower 2100 mode with ASA on the ASA CLI:
1. Use telnet/SSH to access the ASA on Firepower 2100.
2. Run the show fxos mode command on the CLI:
ciscoasa(config)# show fxos mode
Mode is currently set to plaftorm
Appliance mode:
ciscoasa(config)# show fxos mode
Mode is currently set to appliance
Note: In multi-context mode, the show fxos mode command is available in the system or the admin context.
FXOS CLI
Follow these steps to verify the Firepower 2100 mode with ASA on the FXOS CLI:
1. Use telnet/SSH to access the ASA on Firepower 2100.
2. Run the connect fxos command:
ciscoasa/admin(config)# connect fxos
Configuring session.
.
Connecting to FXOS.
...
Connected to FXOS. Escape character sequence is 'CTRL-^X'.
Note: In multi-context mode, the connect fxos command is available in the admin context.
3. Run the show fxos-mode command:
firepower-2140# show fxos mode
Mode is currently set to plaftorm
Appliance mode:
firepower-2140#show fxos mode
Mode is currently set to appliance
FXOS show-tech File
Follow these steps to verify the Firepower 2100 mode with ASA in the FXOS chassis show-tech file:
1. Open file tech_support_brief in <name>_FPRM.tar.gz/<name>_FPRM.tar
2. Check the `show fxos-mode` section:
# pwd
/var/tmp/fp2k-1_FPRM/
# cat tech_support_brief
...
`show fxos-mode`
Mode is currently set to platform
Appliance mode:
# pwd
/var/tmp/fp2k-1_FPRM/
# cat tech_support_brief
...
`show fxos-mode`
Mode is currently set to appliance
Known Issues
Cisco bug ID CSCwb94424  ENH: Add a CLISH command for FMC HA configuration verification
Cisco bug ID CSCvn31622  ENH: Add FXOS SNMP OIDs to poll logical device and app-instance configuration
Cisco bug ID CSCwb97767  ENH: Add OID for verification of FTD instance deployment type
Cisco bug ID CSCwb97772  ENH: Include output of 'show fxos mode' in show-tech of ASA on Firepower 2100
Cisco bug ID CSCwb97751  OID 1.3.6.1.4.1.9.9.491.1.6.1.1 for transparent firewall mode verification is not available
Related Information
- Secure Firewall Management Center REST API Quick Start Guide, Version 7.1
- Configure SNMP on Firepower NGFW Appliances
- Cisco Firepower Threat Defense REST API Guide
- Cisco FXOS REST API Reference
- Cisco ASA Compatibility
- Firepower 1000/2100 and Secure Firewall 3100 ASA and FXOS Bundle Versions
- Bundled Components
- Firepower Troubleshoot File Generation Procedures
- Cisco Firepower 2100 Getting Started Guide
- Cisco Firepower Threat Defense Compatibility Guide
Revision History
| Revision | Publish Date | Comments |
|---|---|---|
2.0 |
08-Aug-2024 |
Reformatting, punctuation, and title case on alt text. |
1.0 |
26-May-2022 |
Initial Release |
Contributed by Cisco Engineers
- Ilkin GasimovCustomer Delivery Engineering Technical Leader
- Mikis ZafeiroudisCustomer Delivery Engineering Technical Leader
Contact Cisco
- Open a Support Case

- (Requires a Cisco Service Contract)
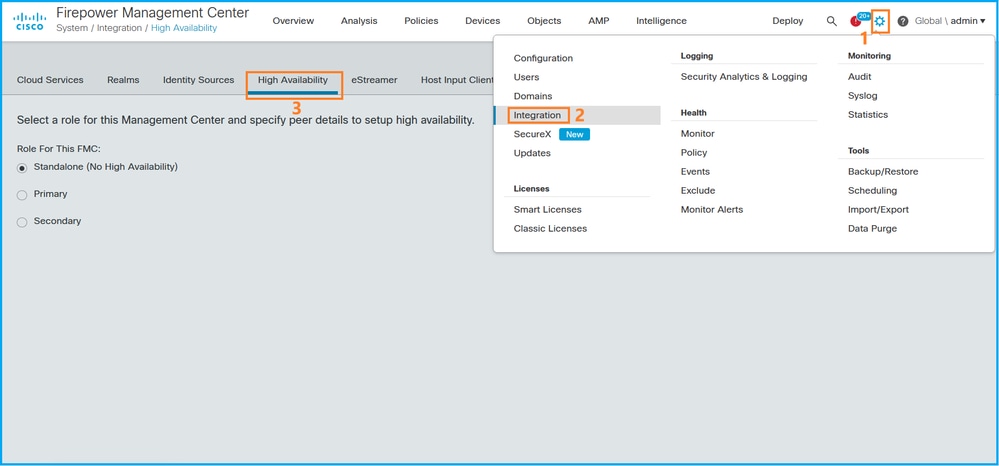
 Feedback