Introduction
This document describes how to configure Cisco Identity Services Engine (ISE) 3.2 integration with Splunk over Data Connect to retrieve reporting data from the ISE database directly. You can create your own queries and craft your own reports thanks to it.
Prerequisites
Requirements
Cisco recommends that you have knowledge of these topics:
- Cisco ISE 3.2
- Basic knowledge about Oracle queries
- Splunk
Components Used
The information in this document is based on these software and hardware versions:
- Cisco ISE 3.2
- Splunk 9.0.0
The information in this document was created from the devices in a specific lab environment. All of the devices used in this document started with a cleared (default) configuration. If your network is live, ensure that you understand the potential impact of any command.
Configure
Configurations
Step 1. Configure ISE Data Connect Settings
1. Enable Data Connect
On ISE, navigate to Administration > System > Settings > Data Connectand toggle the button against Data Connect. Enter the password and click on Save .
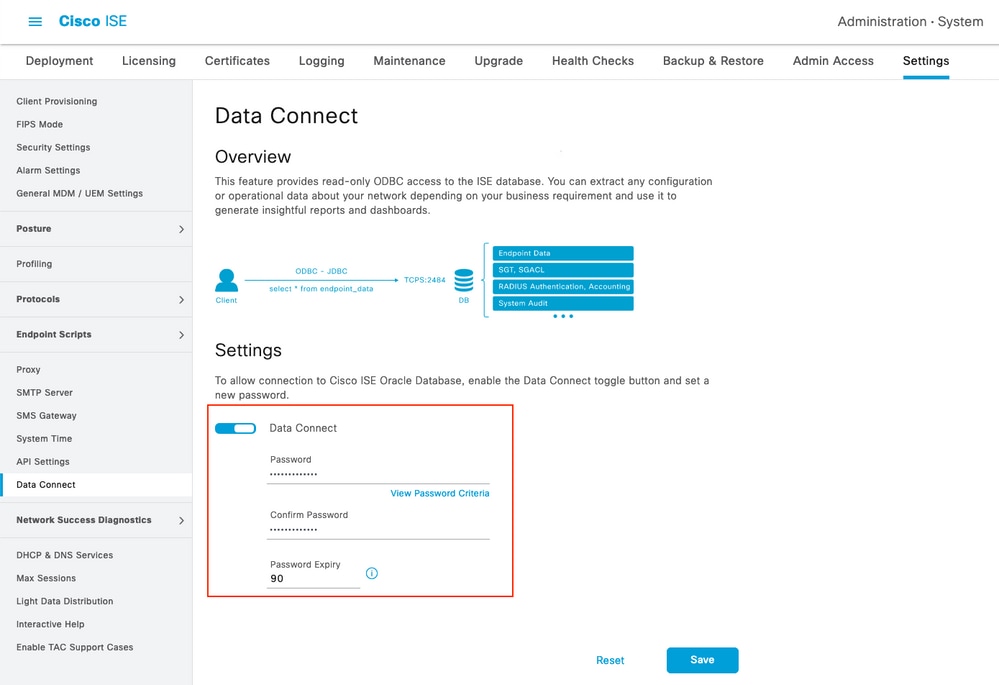
Make a note of Data Connect settings, which include User Name, Hostname, Port, and Service Name .Data Connect by default is enabled on Secondary MNT in a distributed deployment, more information about failover scenarios can be found in the Administrator Guide.
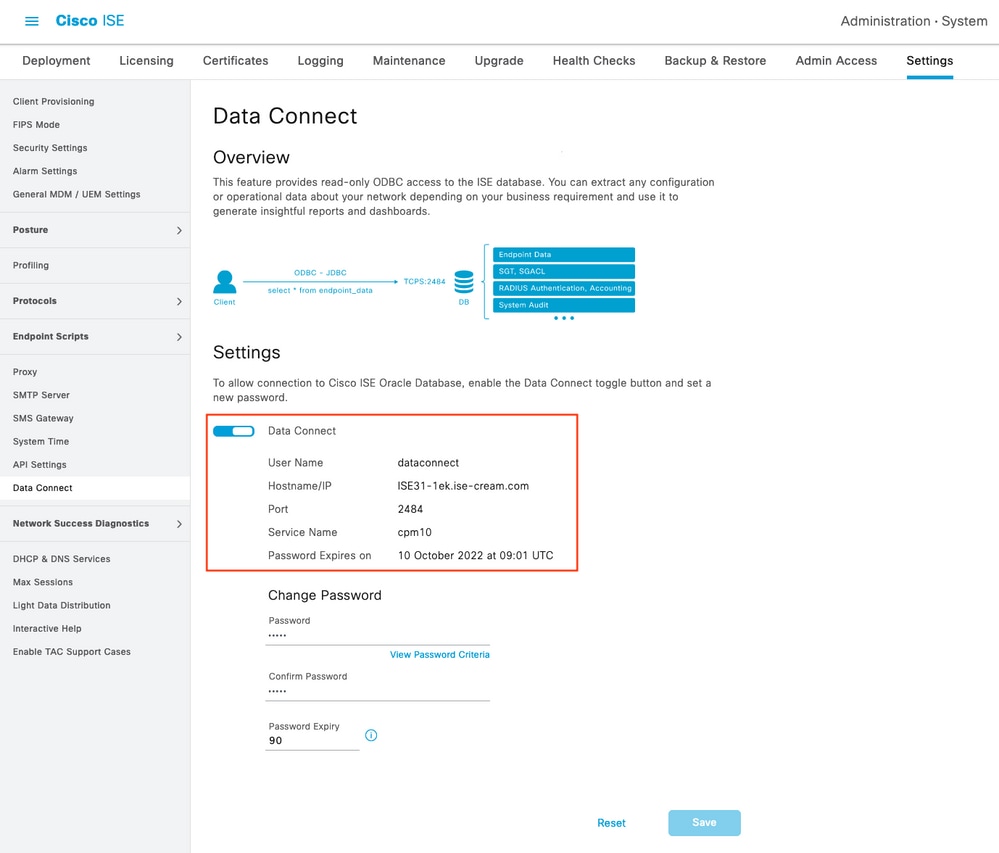
2. Export Data Connect Certificate
Operation in Step 1.triggered the creation of the Data Connect Certificate. It needs to be trusted by the clients who query ISE over Data Connect.
In order to export the certificate, navigate to Administration > System > Settings > Cetificate Management > Trusted Certificates,select Certificate with Data Connect Certificate Friendly Name and click on Export .

The certificate is exported in PEM format.

Step 2. Configure Splunk
Note: Splunk installation is outside the scope of this document.
1. Install Splunk DB Connect App
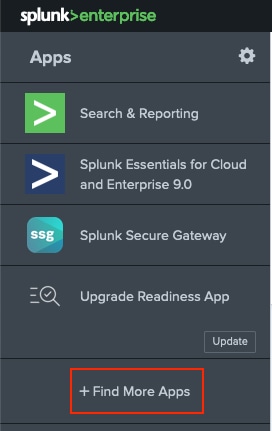
Click on + Find More Apps from the main menu.
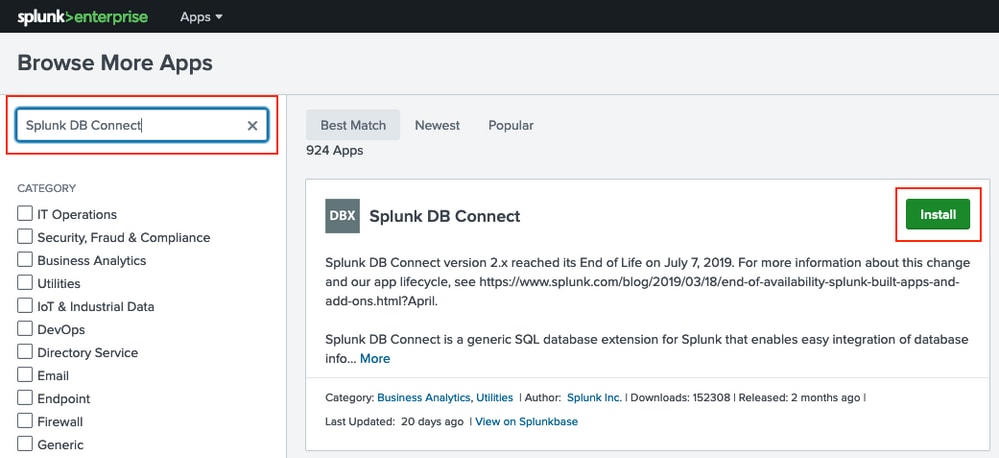
Enter Splunk DB Connect in the search menu and click on Installagainst Splunk DB Connect App as shown in the image.
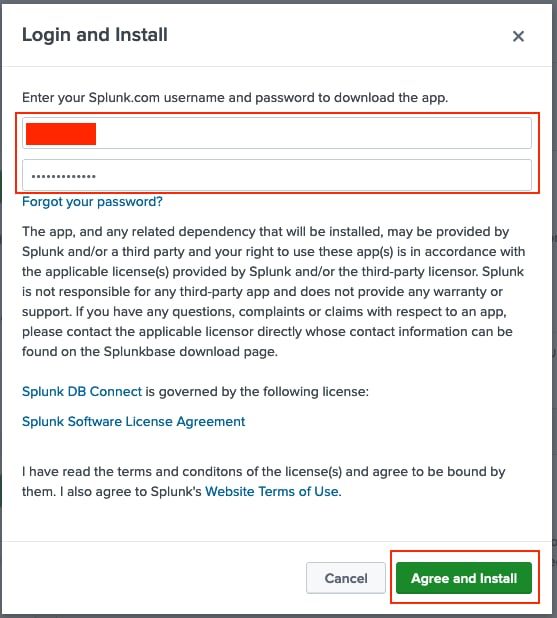
Enter Splunk credentials in order to install the App. Click on Agree and Install as shown in the image.
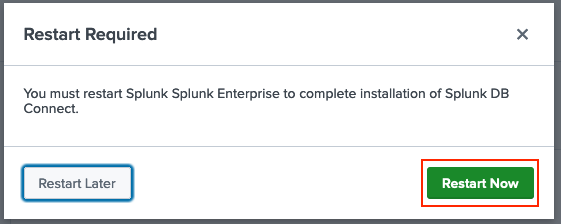
App Installation requires the restart, click on Restart Now.
2. Install Oracle Drivers
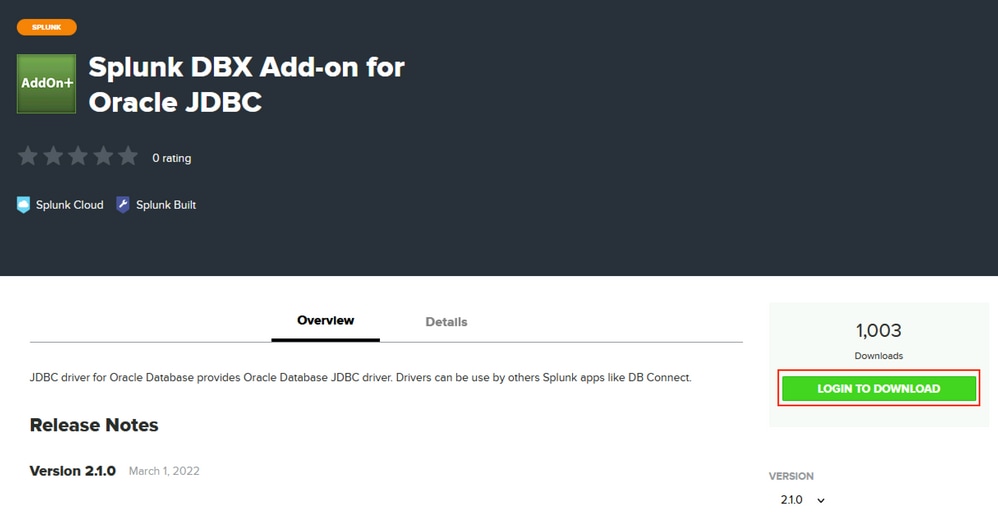
As per Splunk Documentation, JDBC drivers must be installed. Install the Oracle driver through the Splunk add-ons for DB Connect. Click on Login to Download as shown in the image.
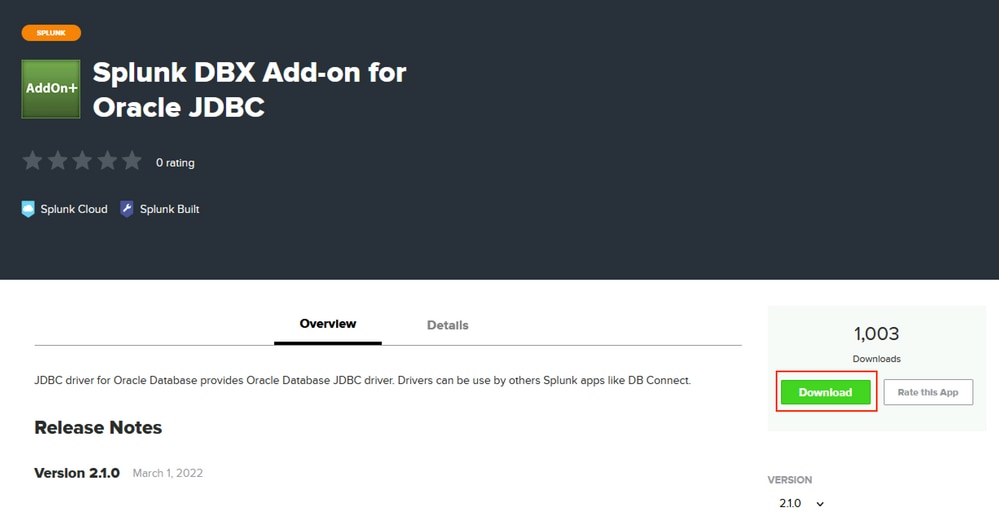
Click on Download.
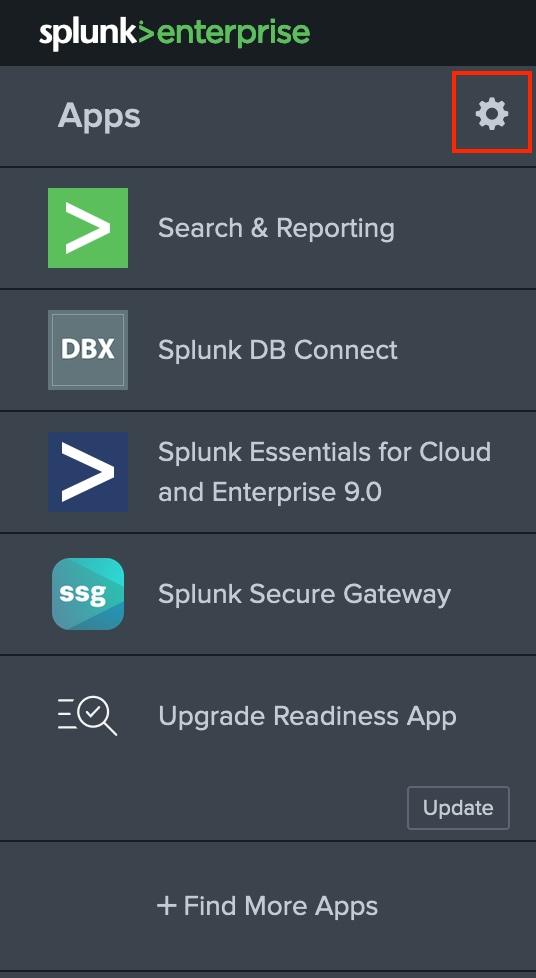
From the Home menu, click on the Gear icon next to Apps as shown in the image.
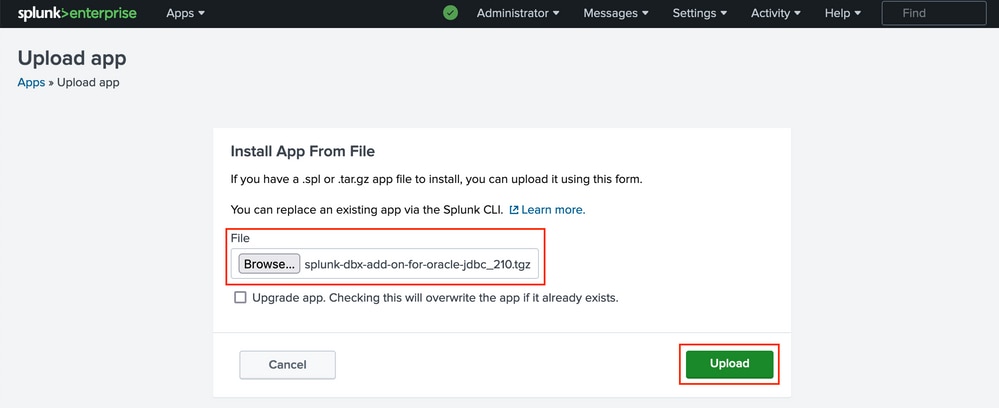
Click on Install App from File.

Select File downloaded earlier and click Uploadas shown in the image.
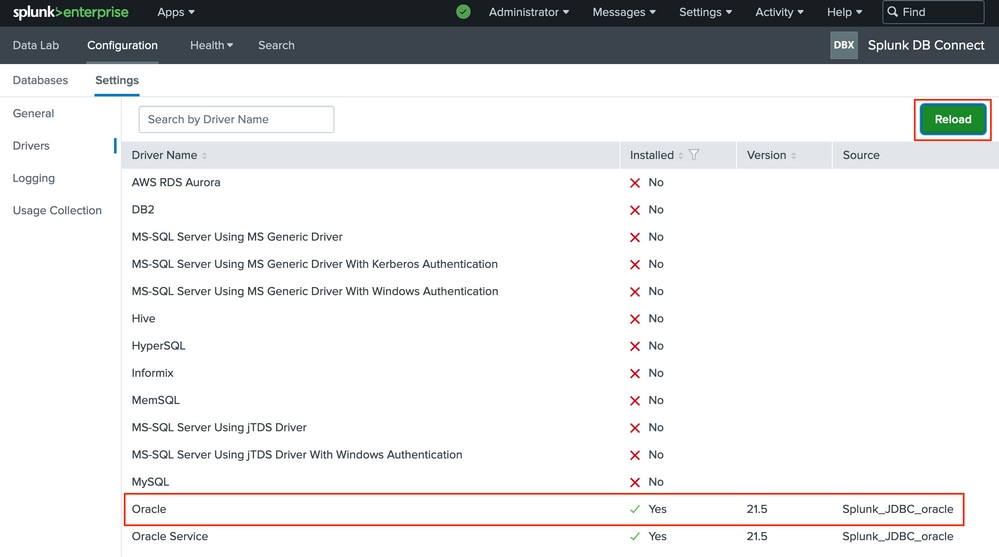
Navigate to Apps > Splunk DB Connect > Configuration > Settings > Driversclick on Reload.Oracle driver must appear as Installed.
3. Configure Splunk DB Connect App Identity
Note: In order for Splunk DB Connect App to work Java (SE) must be installed. For the purpose of this App Java (SE), 11 is installed.
C:\Users\Administrator>java --version
java 11.0.15.1 2022-04-22 LTS
Java(TM) SE Runtime Environment 18.9 (build 11.0.15.1+2-LTS-10)
Java HotSpot(TM) 64-Bit Server VM 18.9 (build 11.0.15.1+2-LTS-10, mixed mode)

C:\Users\Administrator>
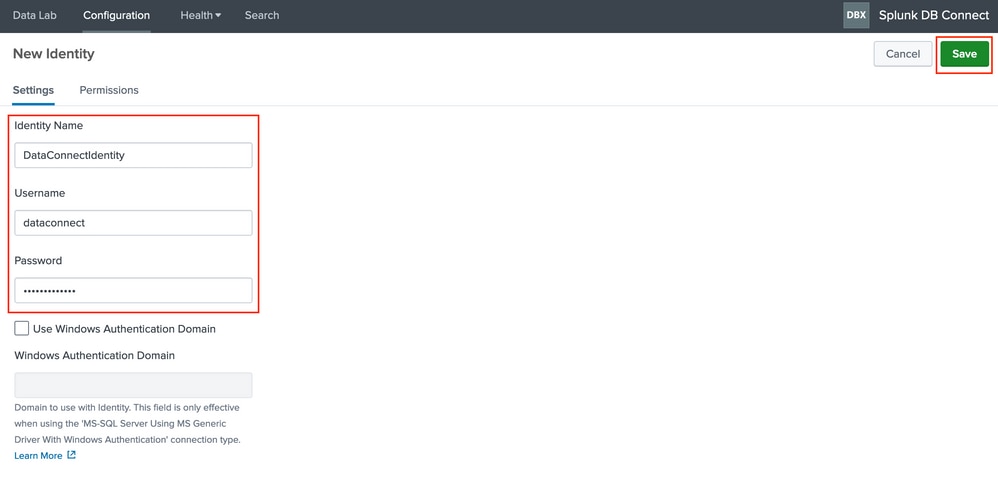
Navigate to Apps > Splunk DB Connect > Configuration > Databases > Identities and click on New Identity.

Configure the Identity Name (arbitrary value), Username (dataconnect) and Password from Step 1. and click on Save.
4. Configure Splunk DB Connect App Connection
Navigate to Apps > Splunk DB Connect > Configuration > Databases > Connections and then click on New Connection.

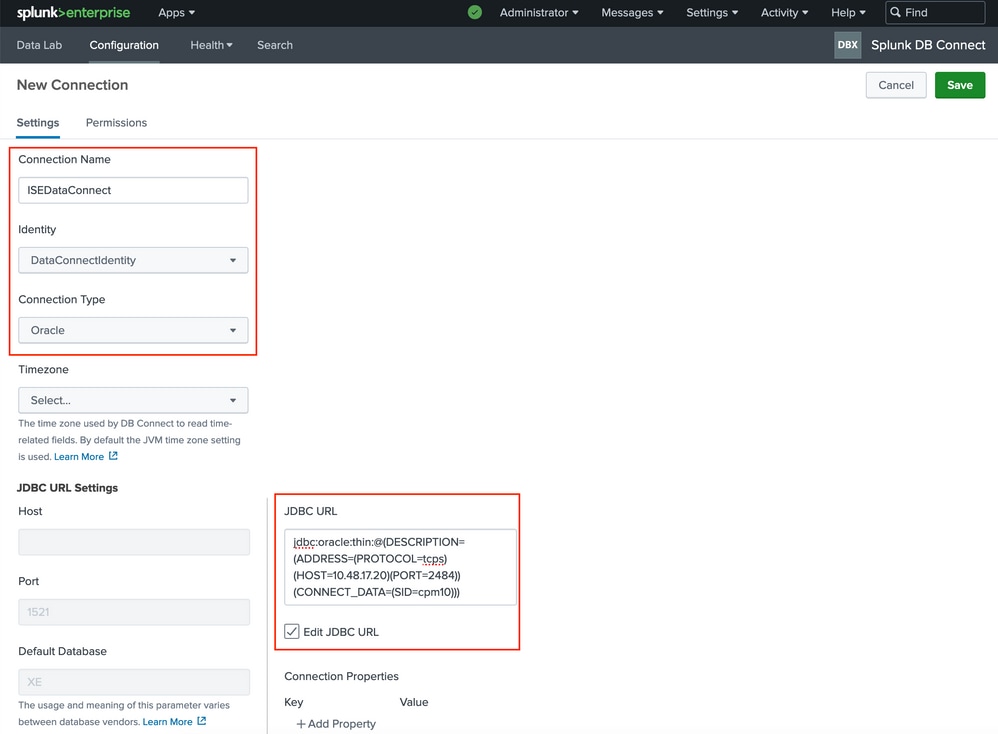
Configure the Connection Name (arbitrary value). Select Identity from Configure Splunk DB Connect App Identitystep. Select Connection Type as Oracle. Mark the checkbox against the Edit JDBC URL and paste the value:
jdbc:oracle:thin:@(DESCRIPTION=(ADDRESS=(PROTOCOL=tcps)(HOST=10.48.17.20)(PORT=2484))(CONNECT_DATA=(SID=cpm10)))
The HOST must be replaced with the IP address of the MNT Node from the step Enable Data Connect as shown in the image.
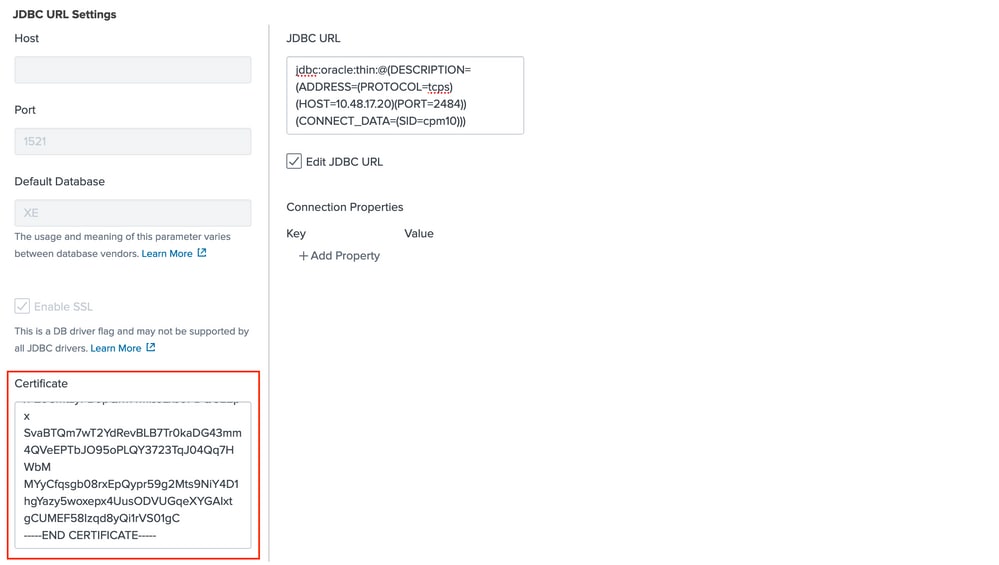
Scroll down to the Certificate section and paste the content of DataConnectCertificate.pem certificate file and click Save as shown in the image.
5. Configure Splunk DB Connect Inputs
Navigate to Apps > Splunk DB Connect > Data Lab > Inputs andclick New Input.

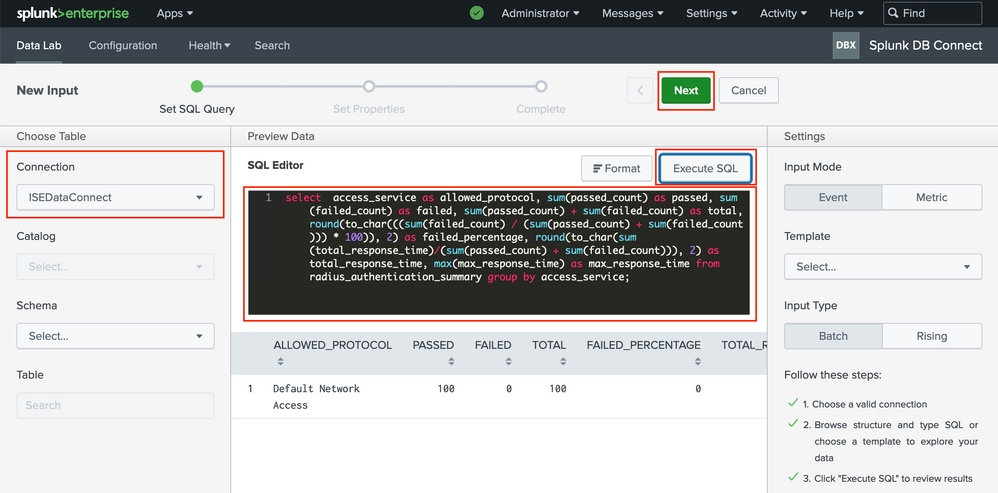
Select Connection configured in Step Configure Splunk DB Connect App Connection .Enter the query you would like to use for the polling, in this example Authentication by ISE Node query is used:
select access_service as allowed_protocol, sum(passed_count) as passed, sum(failed_count) as failed, sum(passed_count) + sum(failed_count) as total, round(to_char(((sum(failed_count) / (sum(passed_count) + sum(failed_count))) * 100)), 2) as failed_percentage, round(to_char(sum(total_response_time)/(sum(passed_count) + sum(failed_count))), 2) as total_response_time, max(max_response_time) as max_response_time from radius_authentication_summary group by access_service;
Click Execute SQL to ensure that the query works, it is also required to proceed further. Click on Next as shown in the image.
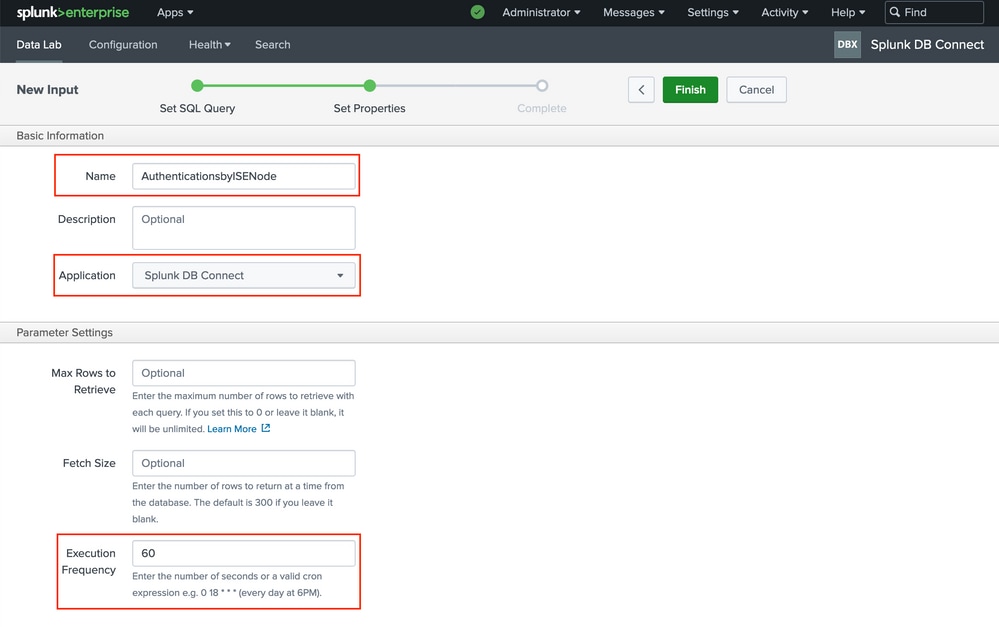
Configure the Input Name(arbitrary value). Select Application as Splunk DB Connect. Set the Execution Frequency (how often the query is sent towards ISE).
Configure the Source Type and Input.

Verify
Use this section in order to confirm that your configuration works properly.
In order to verify and visualize the data from responses, navigate to Apps > Splunk DB Connect > Data Lab > Inputs. Click on Find Events.

From the Events menu, you can navigate to Visualization.
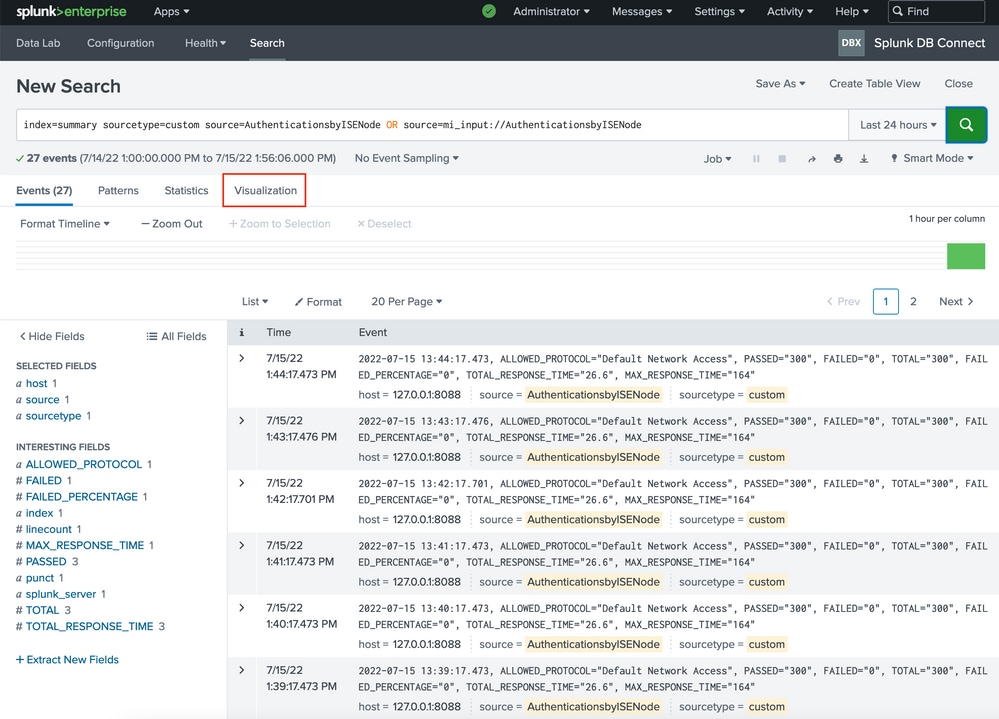
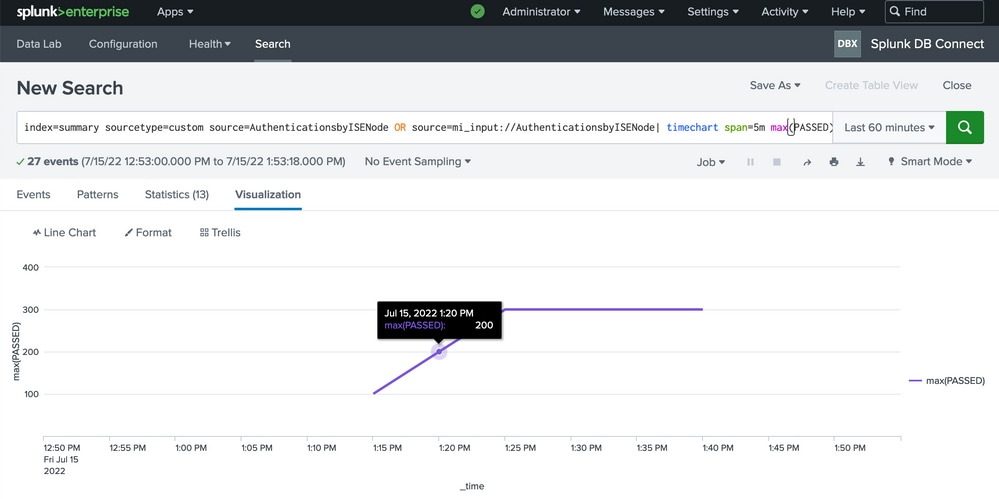
You can adjust the Search menu and select the Visualization of your choice. The query in the example uses timechart and builds the graph based on maximum passed authentication attempts.
index=summary sourcetype=custom source=AuthenticationsbyISENode OR source=mi_input://AuthenticationsbyISENode| timechart span=5m max(PASSED)
Troubleshoot
There is currently no specific troubleshooting information available for this configuration.


 Feedback