Introduction
This document describes how to troubleshoot and catch errors while they are occurring by running show logging commands through the CLI.
Prerequisites
Requirements
Cisco recommends that you have knowledge of these topics:
- Identity Services Engine (ISE).
- Command Line Interface (CLI).
Components Used
The information in this document is based on Identity Services Engine (ISE) 3.3 version.
The information in this document was created from the devices in a specific lab environment. All of the devices used in this document started with a cleared (default) configuration. If your network is live, ensure that you understand the potential impact of any command.
Background Information
ISE leverages a specific structure to store log files, which are detailed in this article. To achieve this, use the CLI to perform real-time error detection by running show logging commands.
Problem Statement
Cisco Identity Services Engine (ISE) maintains folders for storing local log messages. Depending on the nature of the issue, you can utilize two primary show logging commands to diagnose and troubleshoot:
1- System Folder
The System Folder displays system syslogs, allowing you to view live errors. This logging feature helps you identify system-related issues, such as problems with ISE services.
How to Access System Folder:
You can access this folder from the CLI by using this commands:
• show logging system <LogFile>
Example of Available System Folders:
SSPT33A/admin#show logging system
    5105179 Jul 17 2024 20:09:49  ade/ADE.log
      29542 Jan 02 2024 16:36:28  anaconda/anaconda.log
    1012889 Jan 02 2024 16:36:28  anaconda/syslog
        564 Jan 02 2024 17:07:06  boot.log
    1416192 Jul 06 2024 13:57:25  btmp
     292292 Jul 17 2024 20:09:07  lastlog
          0 Jan 02 2024 16:31:58  maillog
    4623022 Jul 17 2024 20:11:43  messages
     548756 Jul 01 2024 23:50:00  sa/sa01
    4173362 Jul 17 2024 20:11:11  secure
          0 Jan 02 2024 16:31:58  spooler
      16896 Jul 17 2024 19:38:55  wtmp
SSPT33A/admin#
Example: Information about ISE application service - show logging system ade/ADE.log tail

Note: To break logging run, please simply press Ctrl + C once.
2- Logging Folder
The Logging Folder displays application syslogs, allowing you to view live errors. This logging feature helps you identify issues related to specific features, such as communication issues, Posture, Guest services, Profiling, and so on.
Before you start
Most of the time when you are replicating an issue, your first need to set proper components at the debug or trace level. Navigate to Operation > Troubleshoot > Debug Wizard > Debug Log Configuration , select the node, click on the log level under the Component Name , select the Log Level that you require, then click Save.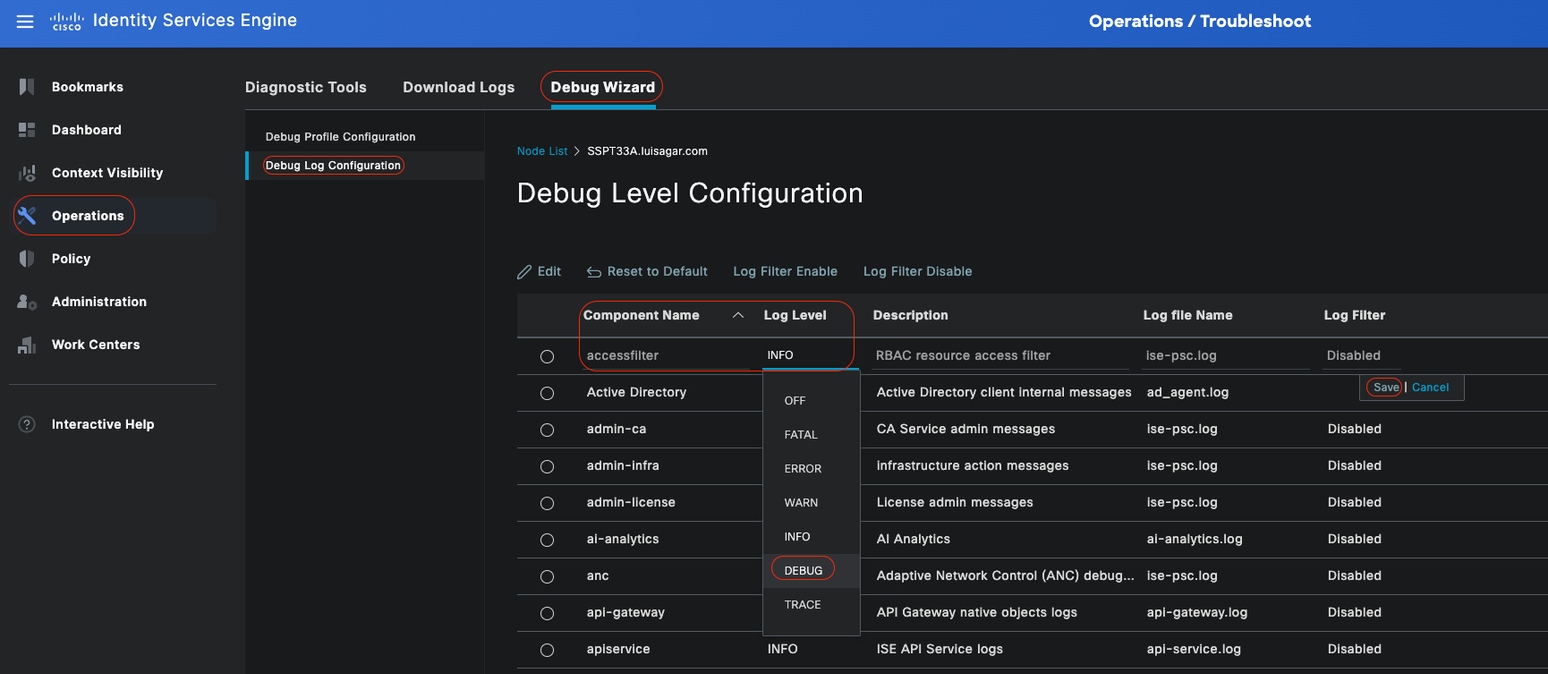 Setting Component

Note: Take into consideration, you need to set components levels back to default after recreating issue.

Warning: Enabling debug logging for runtime-aaa, runtime-logging, and runtime-config significantly impacts system performance. These logs must not be set to debug for more than 15 minutes to avoid performance degradation.
Debug Profile Configuration
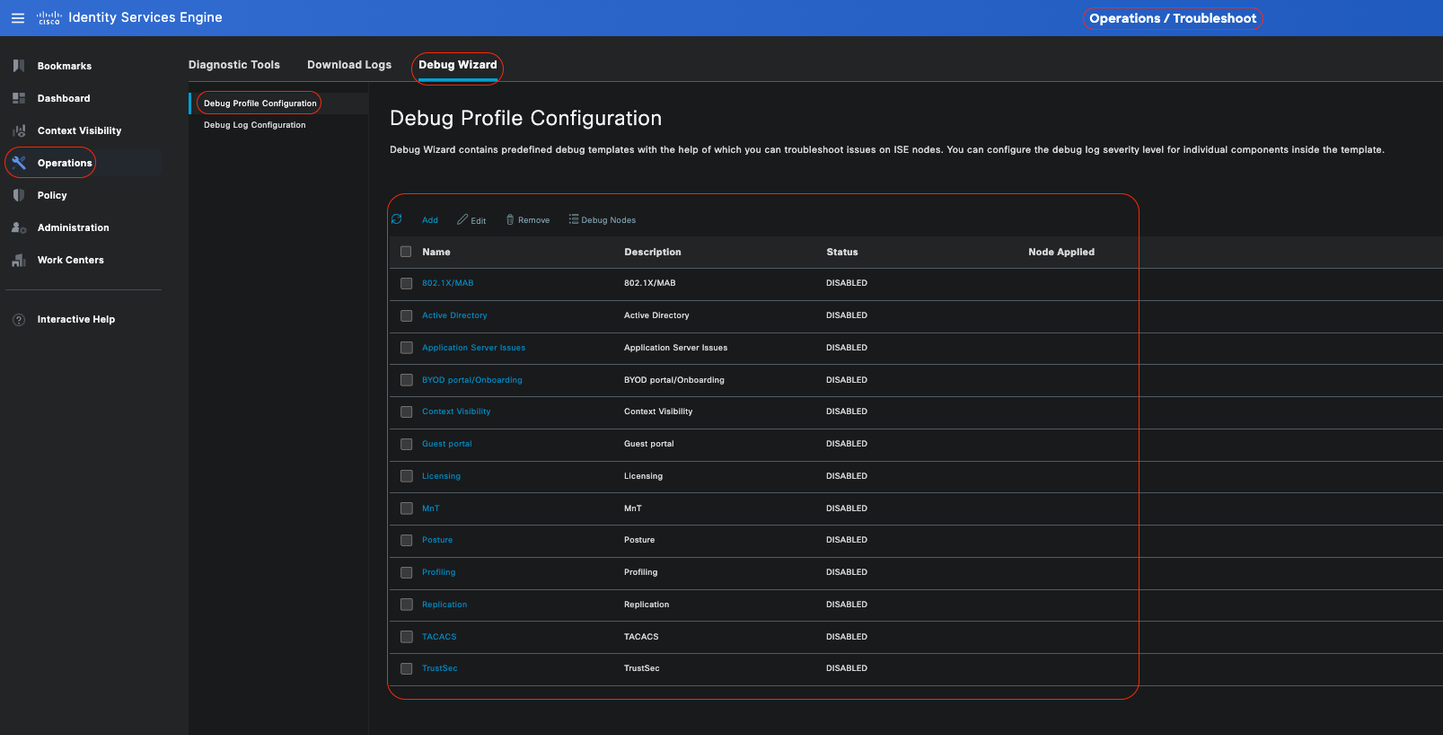
Debug Wizard contains predefined debug templates with the help of which you can troubleshoot issues on ISE nodes. You can configure the debug log severity level for individual components inside the template. It provides predefined debug templates that simplify the process of setting up detailed logging for various components.
These templates are designed to address common troubleshooting scenarios, making it easier for administrators to quickly configure and activate the necessary debug settings.
To use or configure a template, you can go to Operation > Troubleshoot > Debug Wizard > Debug Profile Configuration:
 Debug Profile Configuration
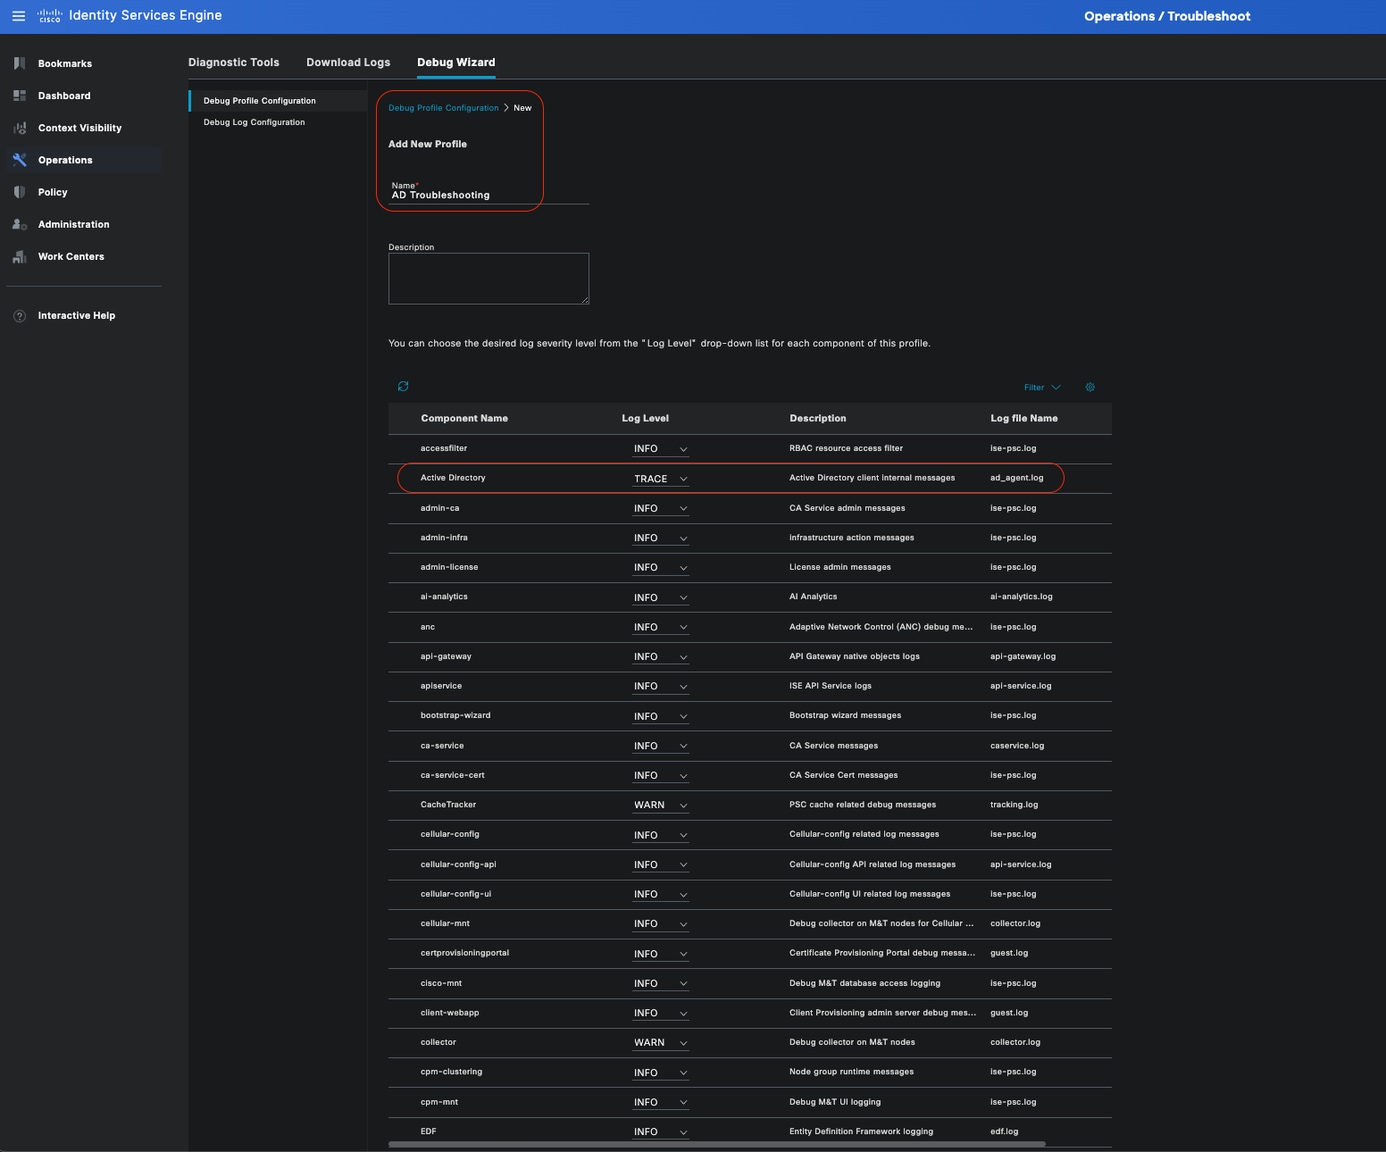
There are already some predefined templates, or click on Add to build your own.
 Adding new template
Enable a template
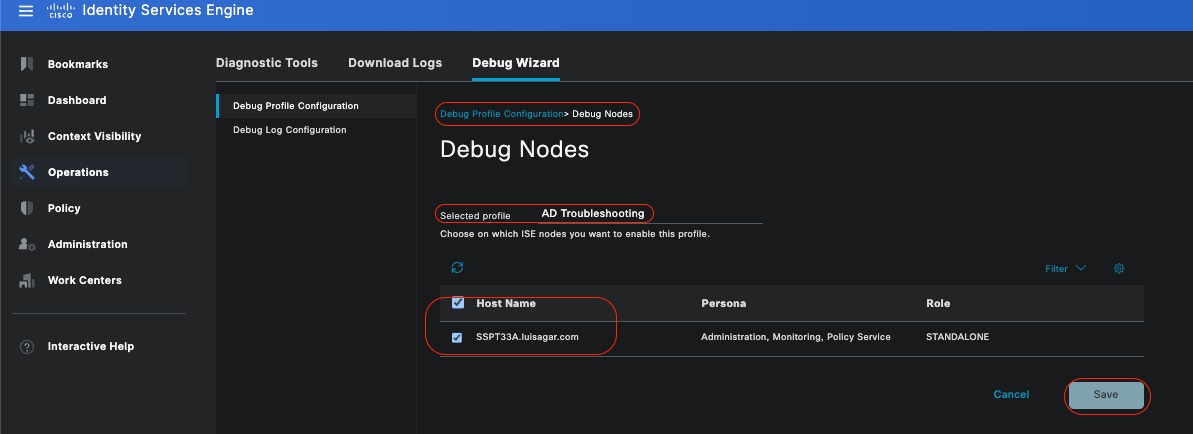
By enabling a template, the component level that you have modified take effect. Select Template, and click on Debug Nodes. Select the node you want to apply the template to then click Save:
 Debug Nodes
Now, the template must have the node assigned to it:
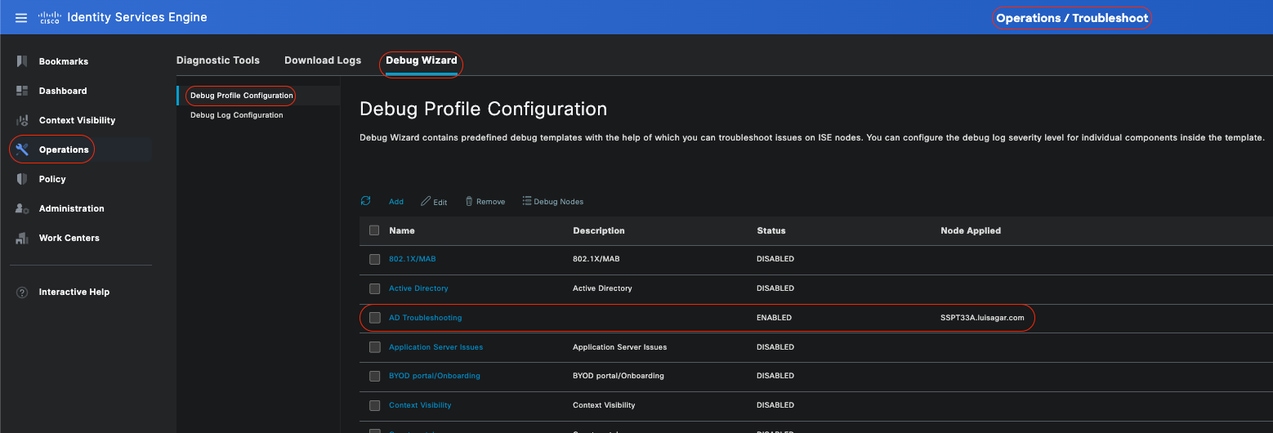 Verifying

Note: None of the component levels take effect until you use the template on a specific node.
Disable Debug Profile template, Select the template. Click Debug Nodes. Uncheck the node where template is applied to, and click Save:
 Disabling Template
Set components levels back to default
Navigate to Operation > Troubleshoot > Debug Wizard > Debug Log Configuration . Select the node. Click Reset toDefault, then Yes.
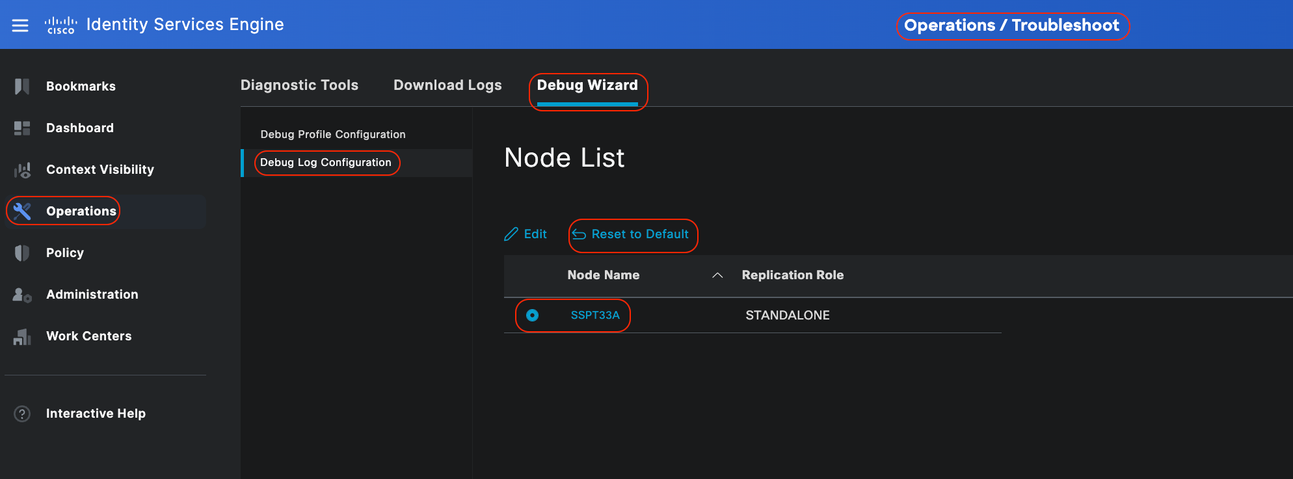 Reset to Default

Warning: if you use the Reset to Default option while a Debug Profile template is enabled, the Debug Profiletemplate remains enabled, but the components return to their default settings, causing a mismatch. It is important not to use the Reset to Default option if there are Debug Profile templates enabled.
For more detailed information and specific examples, refer to the official Cisco documentation as this document provides a comprehensive matrix of components and debug logs: Troubleshoot and Enable Debugs on ISE
How to Access Logging Folder:
You can access this folder from the CLI by using this commands:
• show logging application <logfile>
Some available system folders
SSPT33A/admin#show logging application
      11947 Jul 18 2024 12:20:28  ad_agent.log
      96501 Jul 18 2024 13:29:33  collector.log
     116751 Jul 18 2024 13:30:00  guest.log
     196958 Jul 18 2024 13:01:20  ise-elasticsearch.log
    5136021 Jul 18 2024 13:31:24  ise-psc.log
     172755 Jul 18 2024 13:29:04  profiler.log
   10596813 Jul 18 2024 13:31:10  prrt-server.log
      28496 Jul 18 2024 12:37:04  redis.log
       3489 Jul 18 2024 12:36:44  replication.log
Example: Information about ISE Guest service - show logging application profiler.log tail
Example: Information about ISE Guest service - show logging application guest.log tail
Beside looking for a specific message, use a key-word to look for it. Example: Information about ISE - show logging application localStore/iseLocalStore.log | include 70000\ NOTICE\
SSPT33A/admin#show logging application localStore/iseLocalStore.log | include 70000\ NOTICE\
2024-07-18 00:03:28.668 -05:00 0000423187 70000 NOTICE System-Stats: ISE Utilization, ConfigVersionId=14667, SysStatsUtilizationCpu=5.41%, SysStatsUtilizationNetwork=eth0: rcvd = 2052\; sent = 4062 \;rcvd_dropped = 0\; sent_dropped = 0, SysStatsUtilizationNetwork=cni-podman1: rcvd = 1577511\; sent = 115782 \;rcvd_dropped = 0\; sent_dropped = 0, SysStatsUtilizationNetwork=veth2f590a1a: rcvd =
2024-07-18 00:08:46.369 -05:00 0000423194 70000 NOTICE System-Stats: ISE Utilization, ConfigVersionId=14667, SysStatsUtilizationCpu=1.36%, SysStatsUtilizationNetwork=eth0: rcvd = 1959\; sent = 3012 \;rcvd_dropped = 0\; sent_dropped = 0, SysStatsUtilizationNetwork=cni-podman1: rcvd = 1576019\; sent = 114411 \;rcvd_dropped = 0\; sent_dropped = 0, SysStatsUtilizationNetwork=veth2f590a1a: rcvd = SysStatsUtilizationDiskSpace=8% /opt, SysStatsUtilizationDiskSpace=1% /mnt/encpart, SysStatsUtilizationDiskSpace=8% /opt/podman/containers/storage/overlay, AverageRadiusRequestLatency=0, AverageTacacsRequestLatency=0, DeltaRadiusRequestCount=0, DeltaTacacsRequestCount=0, SysStatsUtilizationLoadAvg=0.40, SysStatsCpuCount=16, SysStatsProcessMemoryMB=18082, ActiveSessionCount=0,

Note: This command show logging application localStore/iseLocalStore.log | include 70000\ NOTICE\ does not work depending on your patch level or ISE release (earlier). You can alternatively run this command show logging application localStore/iseLocalStore.log | include "70000 NOTICE"

Note: To break logging, please simply press Ctrl + C once.
Breaking down command
SSPT33A/admin#show logging application guest.log | include portalwebaction
Explanation:
show: This command is used to display information.logging: Refers to logs or log files.application: Specifies the application or process whose logs you want to view.- guest.log: Specifies the log file named guest.log.
- include: This part of the command filters the output to include only lines that match a specific pattern or keyword.
- portalwebaction: The keyword or pattern to search for within the output of the previous command (
show logging application guest.log).
Find needed file
If you are unsure of the specific log name , you can filter to see further options. This is an example, click enter to see output:
ise3-3a/admin#show logging application | include pxgrid
   14059847 Jul 18 2024 20:46:09  pxgrid/pxgrid-server.log
    5367398 Jul 12 2024 23:59:39  pxgrid/pxgrid-server.log.2024-07-12-1
   16261440 Jul 13 2024 23:59:44  pxgrid/pxgrid-server.log.2024-07-13-1
   16261440 Jul 14 2024 23:59:49  pxgrid/pxgrid-server.log.2024-07-14-1
   16261794 Jul 15 2024 23:59:53  pxgrid/pxgrid-server.log.2024-07-15-1
   16261625 Jul 16 2024 23:59:58  pxgrid/pxgrid-server.log.2024-07-16-1
   16261479 Jul 17 2024 23:59:45  pxgrid/pxgrid-server.log.2024-07-17-1
          0 Jul 12 2024 15:42:36  pxgrid/pxgrid_dbsync_summary.log
          0 Jul 12 2024 15:42:36  pxgrid/pxgrid_internal_dbsync_summary.log
      16744 Jul 15 2024 20:45:49  pxgriddirect-connector.log
       2841 Jul 15 2024 20:45:44  pxgriddirect-service.log
       6277 Jul 12 2024 16:33:53  pxgriddirect-service.log.2024-07-12-1
ise3-3a/admin#


 Feedback