Introduction
This document describes the different types of scans of a Windows connector.
Prerequisites
The prerequisites for this document are:
- Windows Endpoint
- Secure Endpoint (CSE) version v.8.0.1.21164 or later
- Access to Secure Endpoint Console
Requirements
There are no specific requirements for this document.
Components Used
The information in this document is based on these software and hardware versions:
- Secure Endpoint Console
- Windows 10 Endpoint
- Secure Endpoint version v.8.0.1.21164
The information in this document was created from the devices in a specific lab environment. All of the devices used in this document started with a cleared (default) configuration. If your network is live, ensure that you understand the potential impact of any command.
Background Information
The scans were tested on a lab environment with Policy set to debug.
Flash scan on install was enabled via Connector download.
The scans were executed from the Secure Client GUI and from the Scheduler.
Full Scan
This log demonstrates when a Full scan is requested from the CSE Graphic User Interface (GUI).
 Scan from User Interface
Here, the ScanInitiator process begins the Scan process.
(1407343, +0 ms) Aug 23 18:06:01 [9568]: ScanInitiator::RequestScan: Attempting to start scan: dConnected: TRUE, FileName: , Options: 0, PID: 0, Type: 5
You can see that Full Scan is the type of Scan triggered on the GUI as shown in the image.
Next, you have the Security Identifier (SID), which is a value of variable length assigned to this particular event, this Security Identifier helps you track the scan in the logs.
 Publish Event
You can match this with the event from the CSE console.
 Console event
Next, in the logs, you can see this:
 Publish Succeeded
This means that the event has been successfully published to the CSE Cloud.
Then, the next action is actually to perform the scan:
 Scan start
As you can notice, the SID is the same, so you are under the stream of SID 1407343.
These are the steps that the connector performs when a Threat is detected during the Scan.
Step 1. The connector tells you the File that caused the detection, in this example, it is caused by Hacksantana Trainer GLS.
 File detected
Step 2. The event is published to the CSE console with the Threat Detection name and the path where it is found.
 Detection name
 Threat event publish
After the scan finishes, you can take a look at the Event viewer, for a summary of the Scan.
 Event viewer
Flash Scan
Flash scans are quick, they take from seconds to minutes to finish.
In this example, you can see when the Scan starts, and like previously, a SID is given, this time, with a value of 2458015.
 Flash scan start
The next action is to publish the event to the CSE cloud.

When the Scan finishes, the Event is published to the cloud.
 Scan Finish Publish
The event can be seen in the Windows Event viewer. As you can notice, the information is the same as the information presented in the logs.
 JSON Event
Scheduled Scans
When it comes to Scheduled scans, you must be aware of a set of aspects.
After a Scan is scheduled, a change in the Serial number occurs.
Here, the test policy does not have any Scheduled Scans.
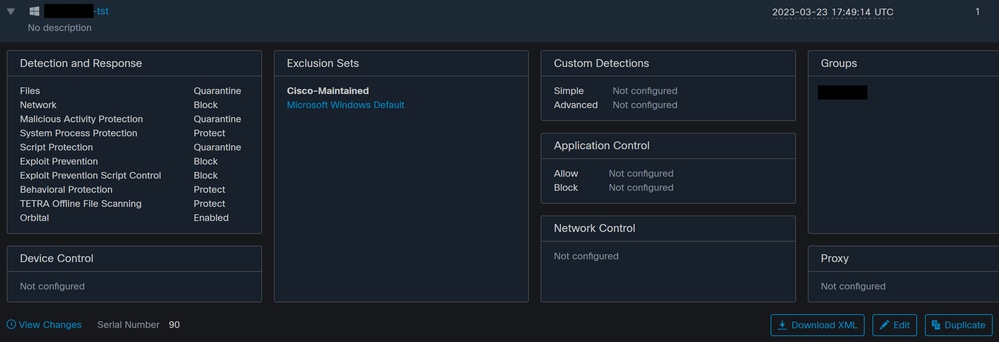 Policy Serial Number
If you want to schedule a Scan, click Edit.
Navigate to Advanced Settings > Scheduled Scans.
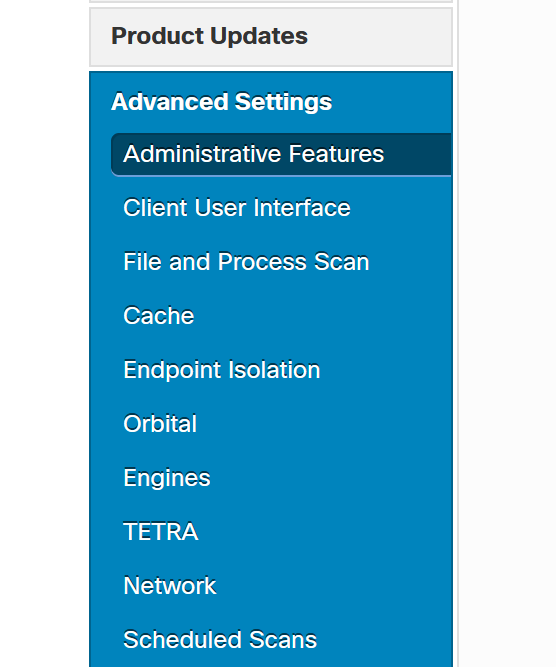 Advanced Settings
Click New.
 New Scan Configuration
The options are:
- Scan Interval
- Scan Time
- Scan Type
After you have configured your Scan, click Add.
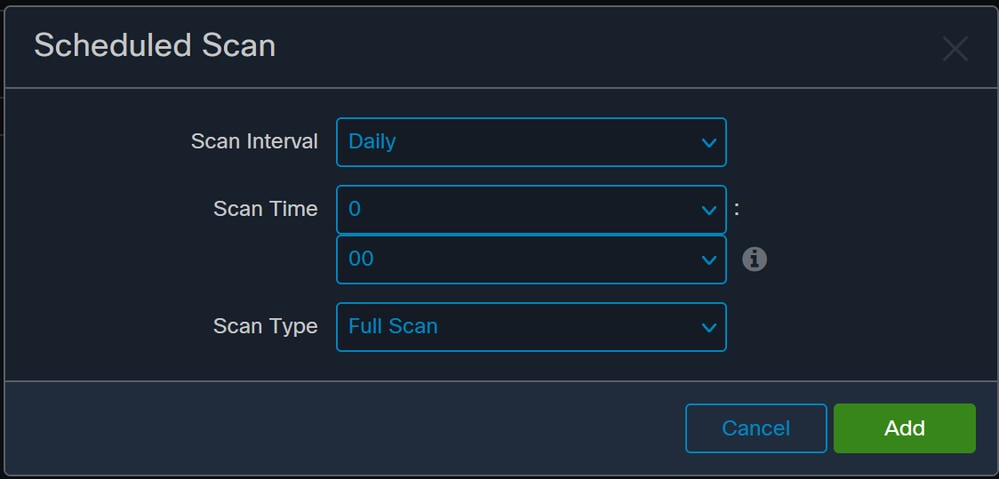 Scheduled Scan Configuration
Save your policy changes, a pop-up appears that confirms your changes.
 Pop-Up
 Serial Number change
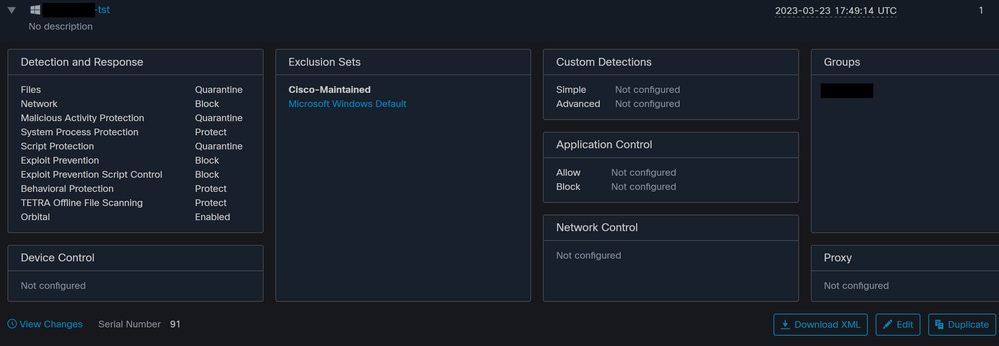 Serial Number change
The scan is configured in the Policy, in this example, two scans are configured scans, a Flash scan and a Full Scan.
 Policy XML
They are added to a Scheduler in HistoryDB. The characters next to the <scheduled> tag are the Process ID (PID) that identify the Scan.
 Process ID
As shown in the image, it is queued.
 Scan Queued
You can search in the logs for the scan, and notice whether the scan can run now or not. If it can, the scan executes.
 Scan can Execute
You can see that the options for the scan are loaded and the ScanInitiator process requests the Scan to begin.

Then, the Process Scan::ScanThreadProcess starts the Scan.

Similar to previous events, it needs to be published in the CSE cloud. The logs can tell you the type of Scan, which in this case is Flash.
 Publish Event of Scheduled Scan
You can Navigate to Event Viewer > App and Services Registries.
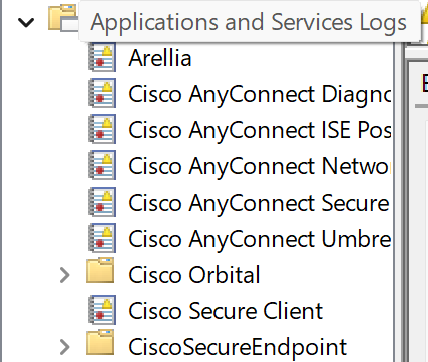 Application and Services Logs
Search for Cisco Secure Endpoint, and open Cloud and Events. Each tab gives you a different view.
Events:
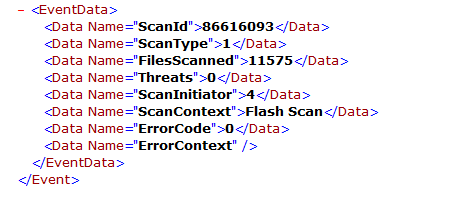 Event View
Cloud:
 Cloud View
Once the Scan finishes, you can see the event published to the cloud.
 Scan Finish Publish
Scheduled Full Scan
The Windows event viewer shows Event Scan Started, as shown in the image.

Once it finishes, you can compare the published event.

You can see this in the event viewer from Windows.
 Event Viewer
Other Scans
When it comes to custom or rootkit scans, the main difference as you have noticed is the Scan Type in the Event viewer or in the logs.
Troubleshoot
When a Schedule Scan does not occur:
- Ensure that the endpoint is available by the time the Scan is meant to occur.
- Ensure the Scan is scheduled in the Policy. If you do not see it, trigger a Policy Sync.


 Feedback