Introduction
This document describes how to Enable Debug on the Endpoint from Cisco Secure Endpoint Console.
Prerequisites
Requirements
Before you begin, ensure you have:
- Administrative access to the Cisco Secure Endpoint for Endpoints console.
- The endpoint you wish to take debug is already registered in Cisco Secure Endpoint
Components Used
The information used in the document is based on these software versions:
- Cisco Secure Endpoint Console version 5.4.20240718
- Cisco Secure Endpoint Connector 6.3.7 and later
- Microsoft Windows Operative System
The information in this document was created from the devices in a specific lab environment. All of the devices used in this document started with a cleared (default) configuration. If your network is live, ensure that you understand the potential impact of any command.
Background Information
The generated diagnostic data can be provided to the Cisco Technical Assistance Center (TAC) for further analysis.
The diagnostic data includes information such as:
- Resource utilization (disk, CPU, and memory)
- Connector-specific logs
- Connector configuration information
Problem
Enable Debug on Endpoint from Cisco Secure Endpoint Console is required during one of the these scenarios.
Scenario 1: If you reboot the device, enable Debug mode from the IP Tray interface or it does not survive reboot. In case bootup debug logs are required, you can enable Debug mode from the policy configuration in the Secure Endpoint console.
Scenario 2: If you experience performance issues with the Cisco Secure Endpoint Connector on a device, enabling Debug mode can help gather detailed logs for analysis.
Scenario 3: When troubleshooting specific issues with the Secure Endpoint Connector, detailed logs can provide insights into the root cause of the problem.
Configure
Complete these steps to successfully enabled debug mode on the specified endpoint through the Secure Endpoint Console.
Step 1: Identify the Endpoint to be Moved to Debug
- Log in to Cisco Secure Endpoint console. From the main dashboard, navigate to the Management section.
- Navigate to Management > Computers.
- Identify and note the endpoint that requires debug mode.
Step 2: Duplicate the Existing Policy
- Navigate to Management > Policies.
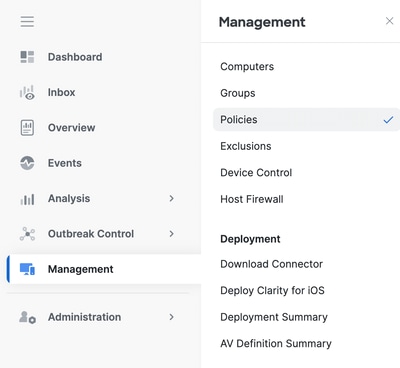
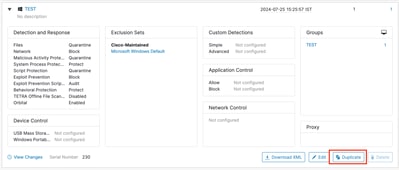
2. Locate the policy currently applied to the identified endpoint.
3. Click the policy to expand the policy window.
4. Click Duplicate to create a copy of the existing policy.
Step 3: Configure the Log Level to Debug this Policy
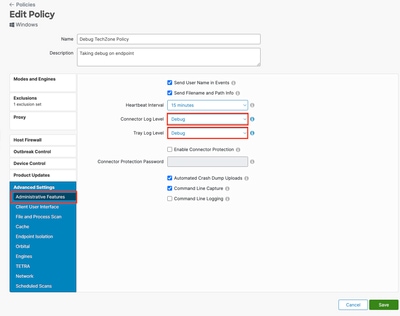
- Select and expand the duplicated policy window.
- Click Edit and rename the policy (For example, Debug TechZone Policy).
- Click Advanced Settings.
- Select Administrative Features from the sidebar.
- Set both the Connector Log Level and Tray Log Level to Debug.
- Click Save to save the changes.
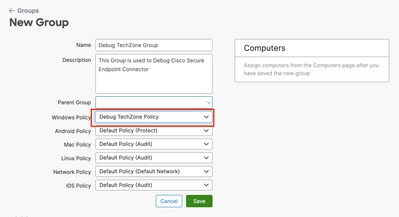
Step 4: Create New Group and Link that New Policy
- Navigate to Management > Groups.
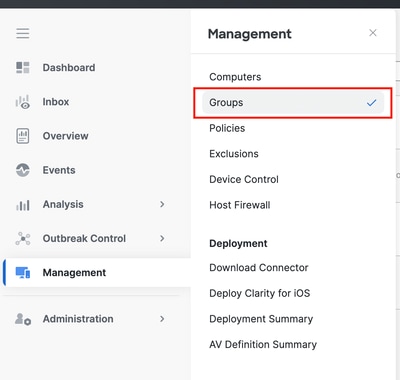
2. Click Create Group near the top-right side of your screen.
3. Enter a name for the group (For example, Debug TechZone Group.)
4. Change the Policy from the default to the newly created debug policy.
5. Click Save.
Step 5: Move the Identified Endpoint to this New Group
1. Navigate back to Management > Computers.
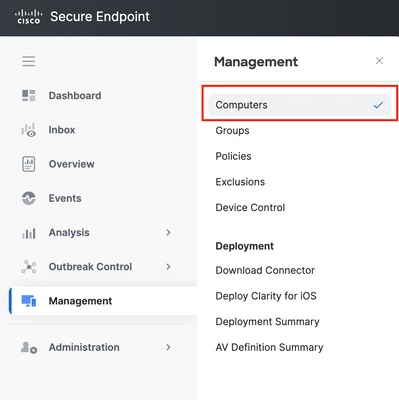
2. Select the identified endpoint from the list.
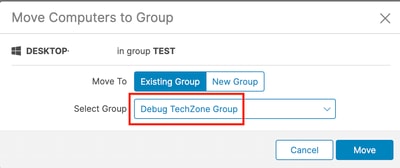
3. Click Move to Group.

4. Select the newly created group from the Select Group drop-down menu.
5. Click Move to move the selected endpoint into the new group.
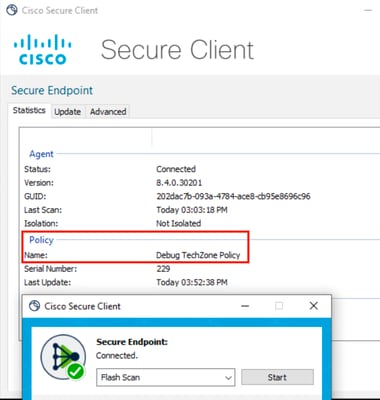
Step 6: Verify the Endpoint in Computer's Page and in Connector UI
- Ensure the endpoint is listed under the new group in the Computers page.
- On the endpoint, open the Secure Endpoint connector UI.
- Verify that the new debug policy is applied by checking the Secure Endpoint icon in the menu bar.

Note: Debug mode can only be enabled if a Cisco Technical Support Engineer requests this data. Keeping debug mode enabled for an extended period can fill up disk space quickly and can prevent the connector Log and Tray Log data from being gathered in the Support Diagnostic file due to excessive file size.
Contact Cisco support for further assistance.
Cisco Worldwide Support Contacts


 Feedback