Introduction
This document describes the Snort 3 Rule and CPU Profiling feature added on FMC 7.6.
Prerequisites
Requirements
Cisco recommends that you have knowledge of these topics:
• Knowledge of Snort 3
• Secure Firepower Management Center (FMC)
• Secure Firepower Threat Defense (FTD)
Components Used
The information in this document is based on these software and hardware versions:
- This document applies to all Firepower platforms
- Secure Firewall Threat Defence Virtual (FTD) running software version 7.6.0
- Secure Firewall Management Center Virtual (FMC) running software version 7.6.0
The information in this document was created from the devices in a specific lab environment. All of the devices used in this document started with a cleared (default) configuration. If your network is live, ensure that you understand the potential impact of any command.
Feature Overview
- Rule and CPU profiling already existed in Snort but was accessible only through the FTD CLI. The goal of this feature is to extend profiling capabilities and make it more straightforward.
- Enable debug intrusion rule performance issues and tweak the rule configurations on their own before reaching out to TAC for troubleshooting help.
- Understand which modules have unsatisfactory performance when Snort 3 is consuming high CPU.
- Create a user-friendly way to debug and fine tune Intrusion and Network Analysis policies for better performance.
Profiling
- Both Rule Profiling and CPU Profiling run on the FTD and their results are stored on device and pulled by FMC.
- You can run multiple profiling sessions simultaneously on different devices.
- You can run the Rules Profiling and CPU Profiling at the same time.
- In case of High Availability, profiling can only be launched on the device that is Active at the start of the session.
For clustered setups, profiling can be run on each node in the cluster.
- If a deployment is triggered while there is a profiling session in progress, a warning is displayed to the user.
If the user choses to ignore the warning and deploy, this cancels the current profiling session and the profiler result shows a message regarding this.
A new profiling session needs to be started without being interrupted by a deployment to get the actual profiling results.
Rule Profiler
- Snort 3 Rule profiler collects data on the amount of time spent processing a set of Snort 3 intrusion rules, thereby highlighting potential issues, showing rules with unsatisfactory performance.
- Rule Profiler displays the 100 IPS rules which took the most time to check.
- Triggering Rule Profiler does not require Snort 3 reload or restart.
- Rule Profiling results are saved in JSON format in /ngfw/var/sf/sync/snort_profiling/ directory and synchronised on the FMC.
- Rule profiler lays within the Snort 3 and inspects traffic with the Snort 3 intrusion detection mechanism; enabling Rule profiling does not have any noticeable impact on performance.
Operate Rule Profiling
- Traffic must be flowing through the device
- Start Rule Profiling by picking a device, then clicking on the Start button
- Starting a profiling session creates a task that can be monitored in Notifications under Tasks
- The default duration of a Rule Profiling session is 120 minutes
- The Rule Profiling session can be stopped sooner, before completion, by pressing on the Stop button
- The results can be viewed in the GUI and downloaded
- The Profiling History displays the previous profiling sessions results. The user can inspect a specific profiling result by clicking on a card from the Profiling History left side panel.
Snort 3 Profiling Menu
The Profiling page can be accessed from the Devices > Snort 3 Profiling menu. The page contains both Rule and CPU profiling, divided into two tabs.
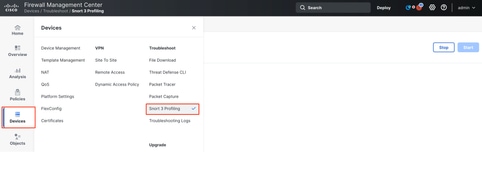 Devices
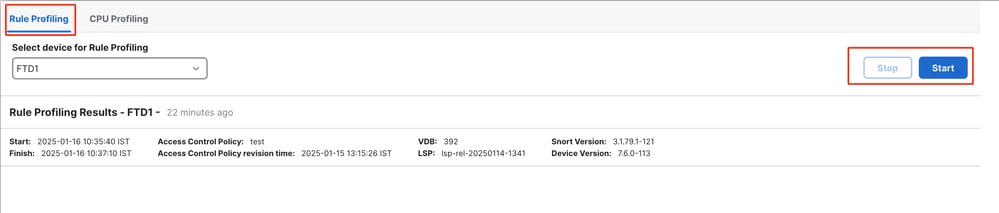
Start Rule Profiling
To start a rule profiling session, click Start. The session is automatically stopped after 120 minutes.
A user cannot configure the length of the profiling session but can stop it before the two hours has elapsed.
 Rule Profiling
 Running
After the rule profiling session is started, a task is created. This can be checked in Notifications > Tasks.
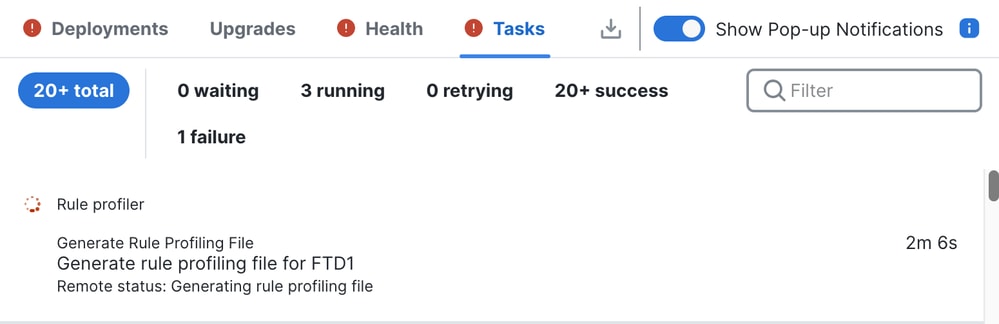 Tasks
Tasks
To stop a rule profiling session that is in progress, in case you need to interrupt it before the automatic stop, click Stop and confirm.
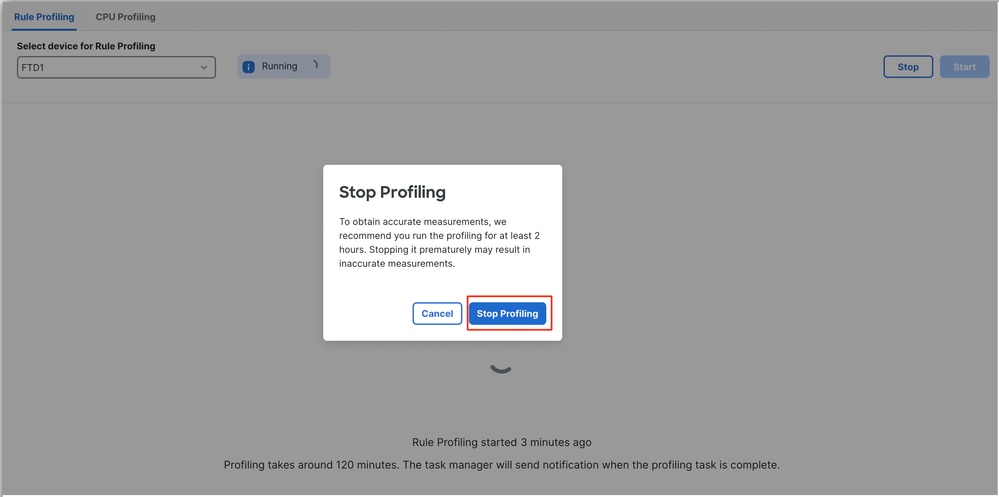 Stop Profiling
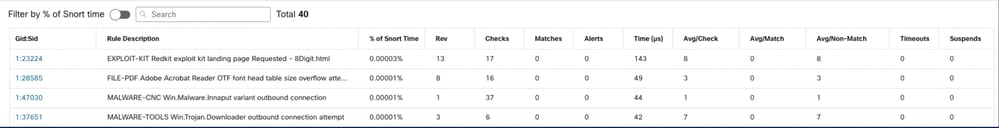
After you select a device, the latest profiling result is automatically displayed in the Rule Profiling Results section.
The table contains statistics for rules that took the most time to process sorted in descending order by the total time (in microseconds (μs) they took.consumed.
 Results
Rule Profiler Results
Rule profiler output for an IPS rule includes these fields:
- % of Snort time - Time spent processing the rule, relative to the time of Snort 3 operation
- Checks - Number of times the IPS rule was executed
- Matches - Number of times the IPS rule fully matched
- Alerts - Number of times the IPS rule triggered an IPS alert
- Time (μs) - Time in microseconds Snort spent on checking the IPS rule
- Avg/Check - Average time Snort spent on one check of the rule
- Avg/Match - Average time Snort spent on one check which resulted in a match
- Avg/Non-Match - Average time Snort spent on one check which did not result in a match
- Timeouts - Number of times rule exceeded the Rule Handling - Threshold configured in the Latency-Based Performance Settings of the AC policy
- Suspends - Number of times the rule was suspended due to some consecutive Threshold Violations
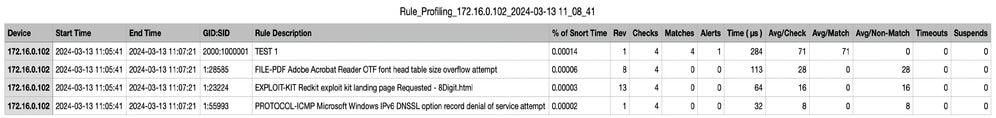
Download the Results
- The user can download the profiling result (“snapshot”) by clicking on the "Download Snapshot" button. The downloaded file is in .csv format and contains all the fields from the profiling results page.
- Extract from the snapshot .csv file:
Device,Start Time,End Time,GID:SID,Rule Description,% of Snort Time,Rev,Checks,Matches,Alerts,Time ( μs ),Avg/Check,Avg/Match,Avg/Non-Match,Timeouts,Suspends 172.16.0.102,2024-03-13 11:05:41,2024-03-13 11:07:21,2000:1000001,TEST 1,0.00014,1,4,4,1,284,71,71,0,0,0
Snapshot .csv file view:
 Snapshot
CPU Profiling
Snort 3 CPU Profiler Overview
- CPU profiler profiles the CPU time taken by modules/inspectors of Snort 3 to process packets in a given time interval. It gives insight on how much CPU each module is consuming, with respect to total CPU consumed by Snort 3 process.
- Using CPU Profiler does not require reloading the configuration or restarting Snort 3, thus avoiding downtime.
- CPU Profiler result displays processing time taken by all modules during last profiling session.
- CPU Profiling results are saved in JSON format under /ngfw/var/sf/sync/cpu_profiling/ directory and synchronised on the FMC /var/sf/peers/<device UUID>/sync/cpu_profiling directory.
- A new Snort 3 profiling page was added in FMC UI
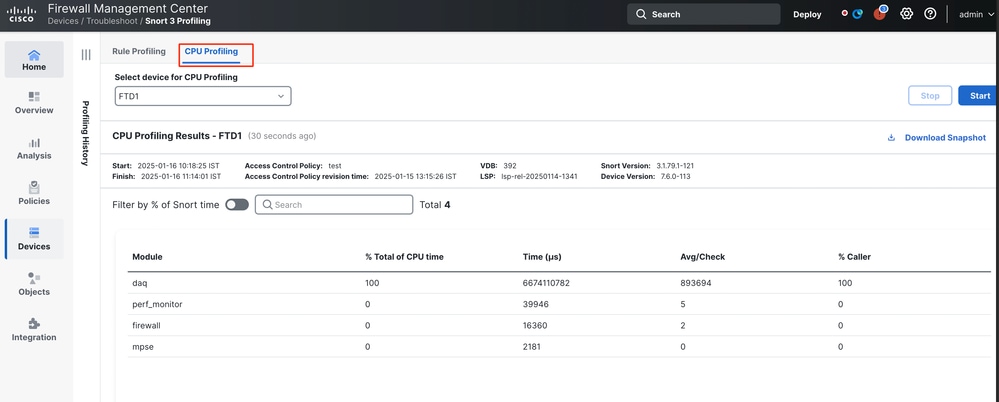
- This page can be accessed from the Devices > Snort 3 Profiling menu > CPU Profiling tab
- Use Download Snapshot on the CPU profiling tab to download a snapshot of profiling results in CSV format.
CPU Profiling Tab
The CPU Profiling page is accessed from the Devices > Snort 3 Profiling menu > CPU Profiling tab.
It contains a device selector, Start/Stop buttons, Download Snapshot button, a profiling results section, and a Profiling History section on the left side that is expanded when clicking on it.
 Cpu Profiling
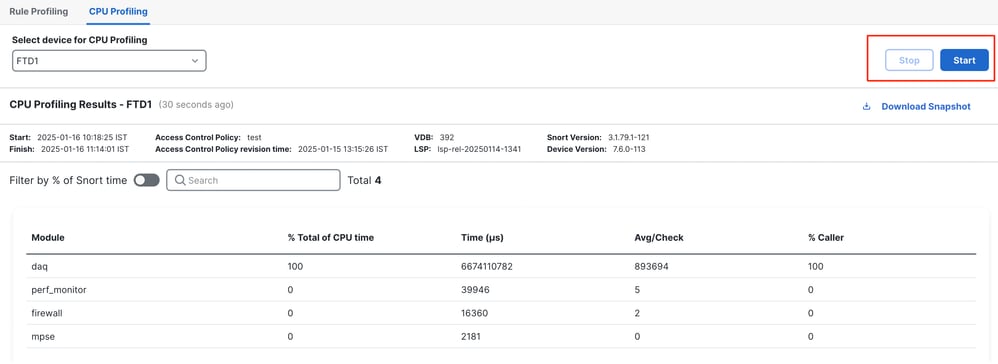
To start a CPU profiling session, click Start. This page is shown when the session is started.
 Start
Start
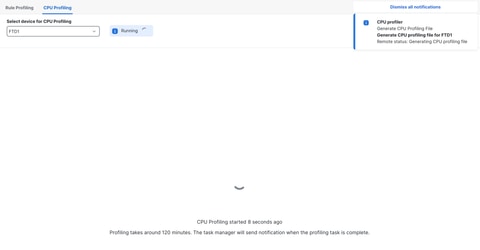 Running
After the CPU profiling session is started, a task is created. This can be checked in Notifications > Tasks.
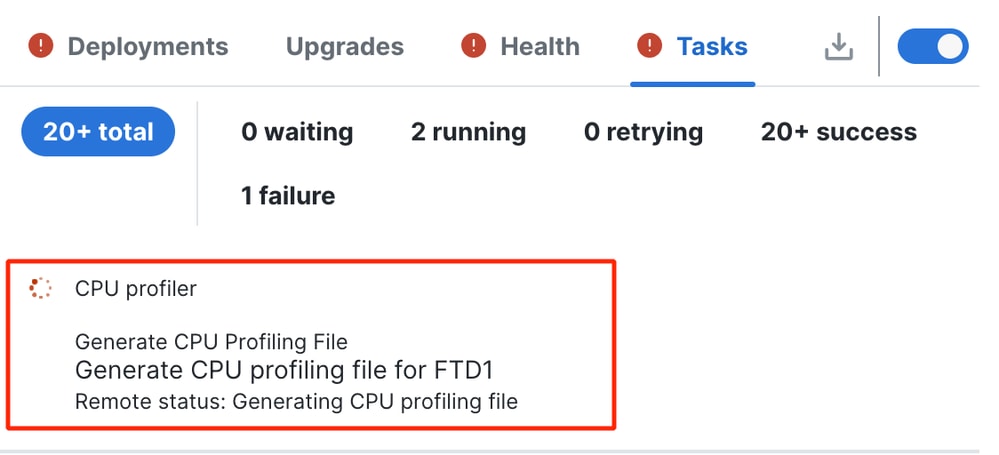 Tasks
Tasks
- To stop a CPU profiling session that is in progress, click Stop.
- A confirmation dialog appears. click Stop Profiling.
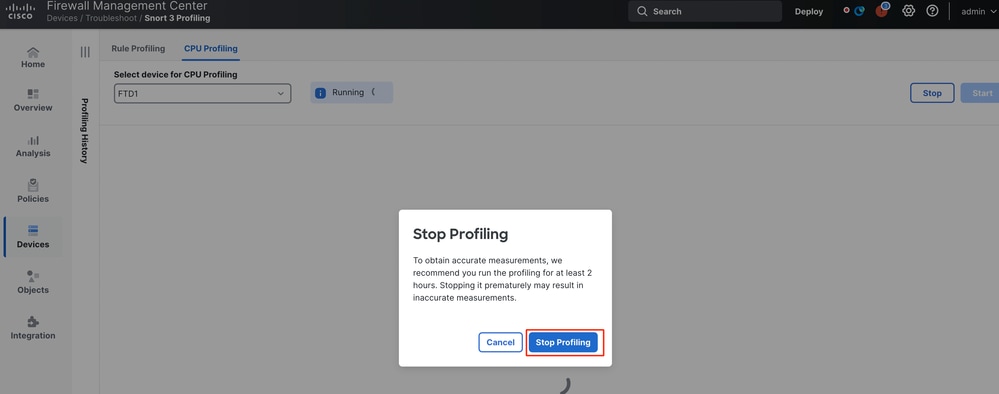 Stop Running
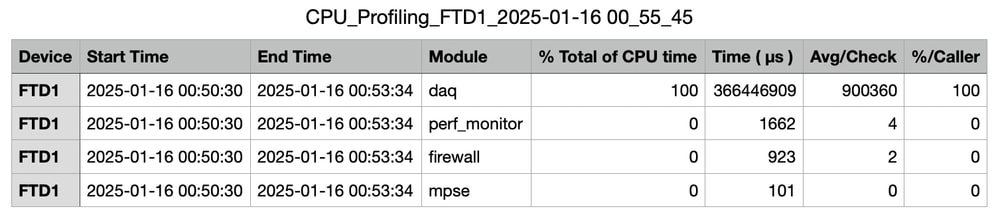
The latest profiling result is displayed in the CPU Profiling Results section.
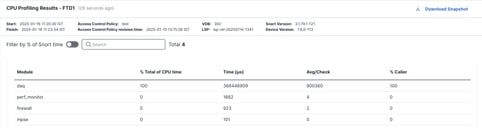 Results
CPU Profiler Results Explained
- "Module" column denotes the name of the module/inspector.
- "% Total of CPU Time" column denotes the percentage of time taken by module with respect to overall time taken by Snort 3 in processing traffic. If this value is considerably larger than that of other modules, then module is contributing more to unsatisfactory performance of Snort 3.
- "Time (μs)" represents the total time in micro seconds taken by each module.
- "Avg/Check" represents the average time taken by the module for each time the module is invoked.
- "% Caller" denotes the time taken by submodule (if configured) with respect to main module. It is mainly used for developer debugging purposes.
CPU Profiler Result - Download Snapshot
- The user can download the profiling result snapshot by clicking Download Snapshot. The downloaded file is in .csv format and contains all the fields from the profiling results page as shown in this example.
- Extract from the snapshot .csv file:
 Snapshot
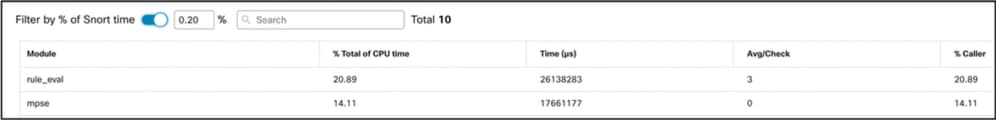
CPU Profiling Result Filtering
Profiling results can be filtered using:
- "Filter by % of Snort time" - allows you to filter out modules whose execution took more than n% of the profiling time.
- Search - allows you to do a text search through any field present in the results table.
Any column except "Module" can be sorted by clicking on its header.
 Results
 Feedback