Introduction
This document describes how to identify and analyze failover events for Secure Firewall Threat Defense on Secure Firewall Management Center GUI.
Prerequisites
Requirements
Cisco recommends that you have knowledge of these topics:
- High Availability (HA) Setup for Cisco Secure Firewall Threat Defense (FTD)
- Basic Usability of the Cisco Firewall Management Center (FMC)
Components Used
The information in this document is based on these software and hardware versions:
- Cisco FMC v7.2.5
- Cisco Firepower 9300 Series v7.2.5
The information in this document was created from the devices in a specific lab environment. All of the devices used in this document started with a cleared (default) configuration. If your network is live, ensure that you understand the potential impact of any command.
Background Information
The FMC is not only the administrative center for Firepower devices, beyond management, and configuration options, it also provides a graphical interface that helps to analyze logs and events in real and past time.
When speaking about failover, the interface has new improvements that help to analyze failover events in order to understand the failures.
Failover Events on FMC
Step 1. Health Policy Configuration
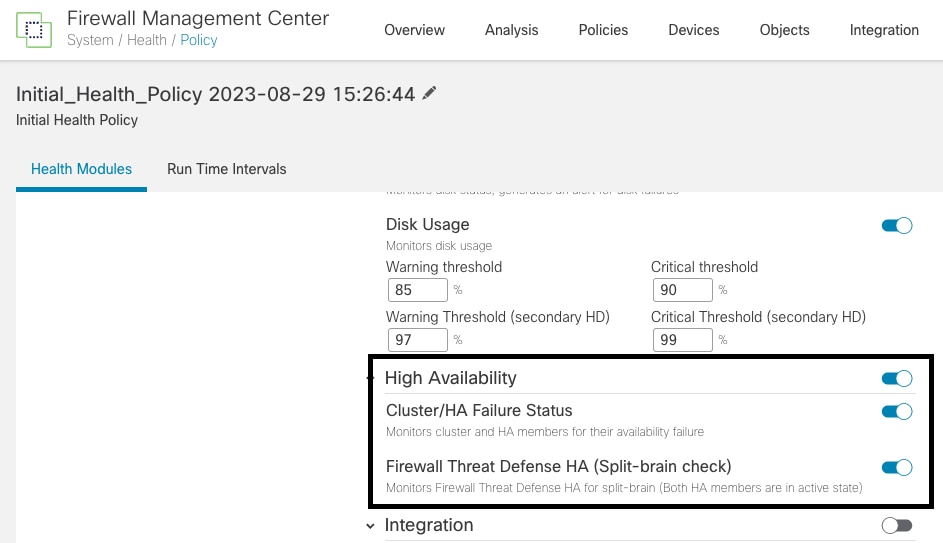
The module Cluster/HA Failure Status is enabled by default on the Health Policy but additionally, you can enable the Split-brain check option.
In order to enable the options for HA in the health policy, navigate to System > Health > Policy > Firewall Threat Defense Health Policy > High Avilability.
This image describes the HA configuration of the Health Policy:
 High Availability Health Settings
Step 2. Policy Assignment
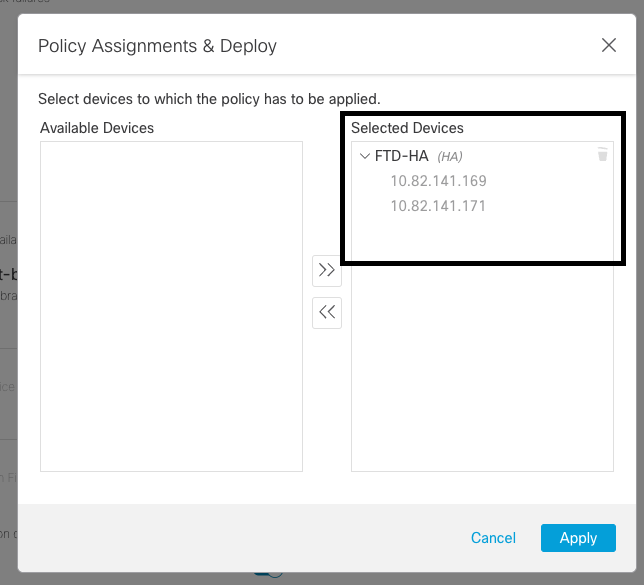
Ensure the Health Policy is assigned to the HA pairs you want to monitor from the FMC.
In order to assign the policy, navigate to System > Health > Policy > Firewall Threat Defense Health Policy > Policy Assignments & Deploy.
This image shows how to assign the health policy to the HA pair:
 HA assigment
Once the policy has been assigned and saved, automatically the FMC applies it to the FTD.
Step 3. Failover Events Alerts
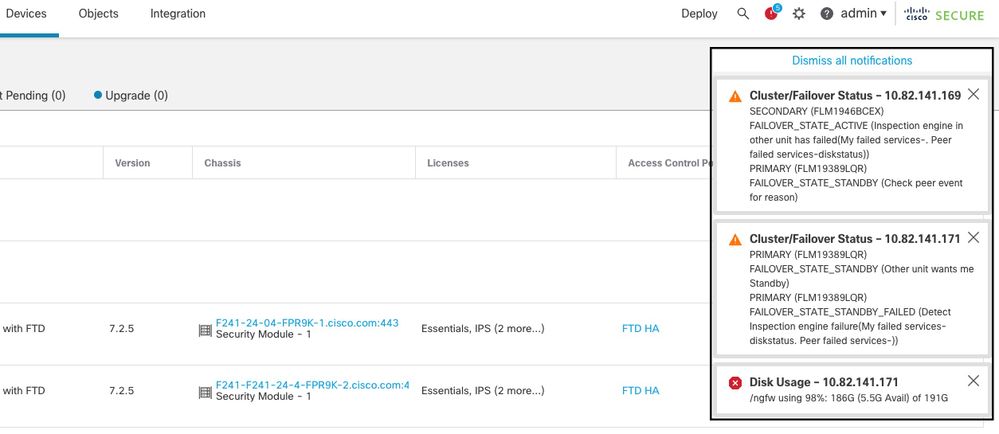
Depending on the configuration of the HA, once a failover event is triggered, the pop-up alerts that describe the failover failure are shown.
This image shows the failover alerts generated:
 Failover Alerts
You can also navigate to Notifications > Health in order to visualize the failover health alerts.
This image shows the failover alerts under notifications:
 HA Notifications
Step 4. Historical Failover Events
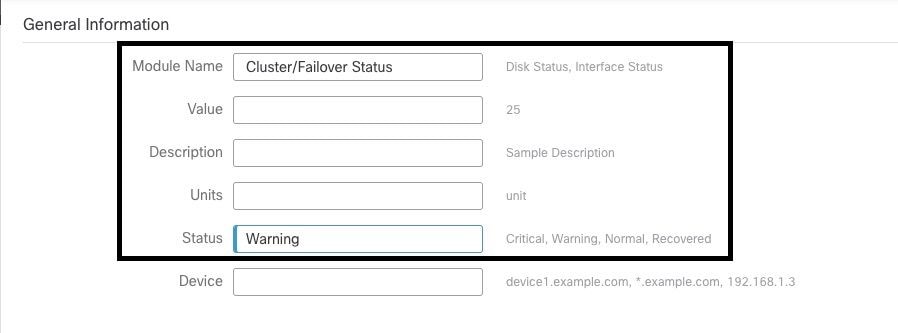
The FMC provides a way to visualize failover events that occurred in the past. In order to filter the events, navigate to System > Health > Events > Edit Search and specify the Module Name as Cluster/Failover Status. Additionally, the filter can be applied based on the Status.
This image shows how to filter failover events:
 Failover filter messages
You can adjust the time settings in order to display the events for a specific date and time. In order to modify the time settings, navigate to System > Health > Events > Time.
This image shows how to edit the time settings:
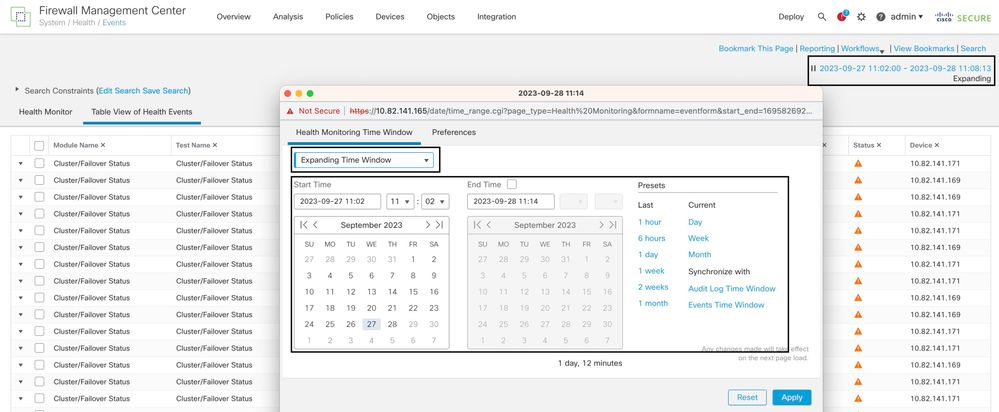 Time filter
Once the events have been identified, in order to confirm the reason for the event, point the cursor under Description.
This image shows how the reason for the failover can be seen.
 failover details
Step 5. High Availability Dashboard
Another way to monitor the failover can be found under System > Health Montitor > Select Active or Standby Unit.
The HA monitor provides information about the status of the HA and State Link, Monitored Interfaces, ROL, and the status of the alerts on each unit.
This image shows the HA Monitor:
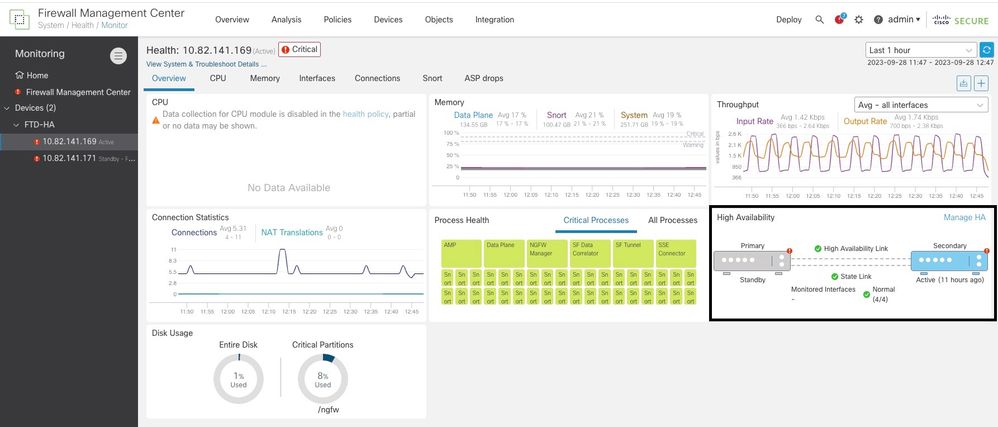 Health graphics
In order to visualize the alerts, navigate to System > Health Montitor > Select Active or Standby Unit > Select the Alerts.
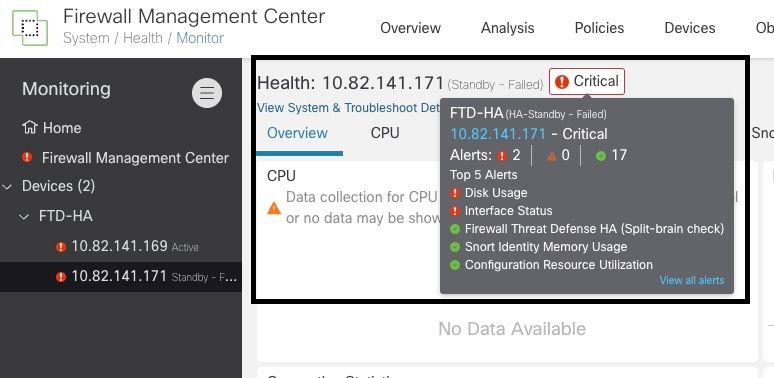 Alerts
In order to get more details of the alerts, choose View all alerts > see more.
This image shows the disk status that caused the failover:
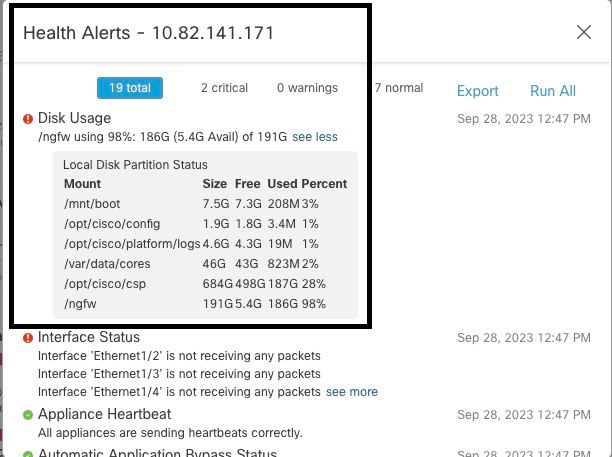 alert details
Step 6. Threat Defense CLI
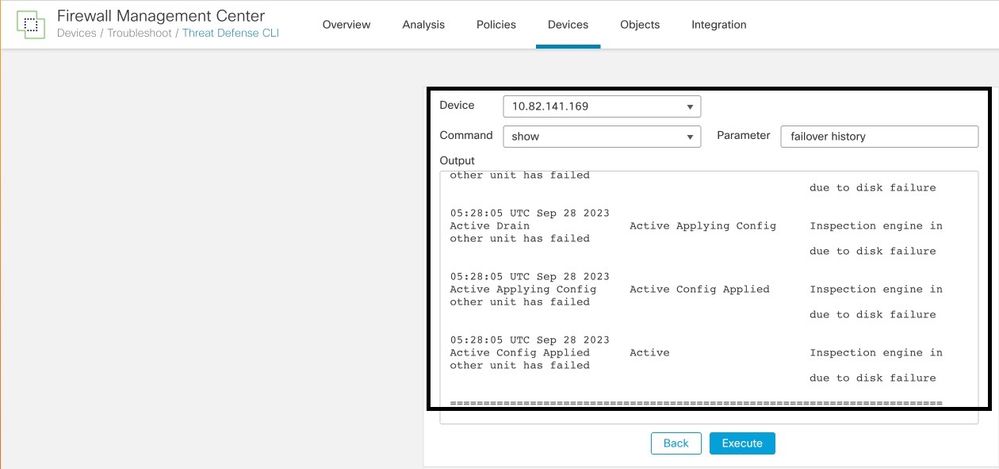
Finally, in order to collect additional information on FMC, you can navigate to Devices > Troubleshoot > Threat Defense CLI. Configure the parameters like Device and the command to be executed and click Execute.
This image shows an example of the command show failover history that can be executed on the FMC where you can identify the failure of failover.
 failover history
Related Information


 Feedback