Introduction
This document describes how to configure managed devices to send diagnostic syslog messages to FMC and view them in the Unified Event Viewer.
Prerequisites
Requirements
Cisco recommends that you have knowledge of these topics:
• Syslog Messages
• Firepower Management Center (FMC)
• Firepower Threat Defense (FTD)
Components Used
The information in this document is based on these software and hardware versions:
• This document applies to all Firepower platforms.
• Secure Firewall Threat Defense Virtual (FTD) which runs software version 7.6.0
• Secure Firewall Management Center Virtual (FMC) which runs software version 7.6.0
The information in this document was created from the devices in a specific lab environment. All of the devices used in this document started with a cleared (default) configuration. If your network is live, ensure that you understand the potential impact of any command.
Feature Overview
In Secure Firewall 7.6, a new Troubleshoot event type is added in the Unified Event Viewer table. The platform settings syslog logging configuration has been extended and it supports sending LINA generated diagnostic syslog messages to the FMC instead of just VPN logs. This feature can be configured on any FTD running a software version compatible with FMC 7.6.0. cdFMC is not supported because cdFMC does not have analytics tools.
- The All Logs option is limited to emergency, alert, and critical log levels due to event volume.
- These Troubleshooting Logs show any syslog sent from the device to the FMC (VPN or other).
- The troubleshoot logs flow to the FMC and are visible in the Unified Event View and under Devices > Troubleshoot > Troubleshooting Logs.
Configure
Navigate to FMC Devices > Platform Settings and click Edit icon at the top right corner of the policy.
 Platform Settings Policy
Move to Syslog > Logging Setup. You can see three options under Logging to Secure Firewall Management Center.
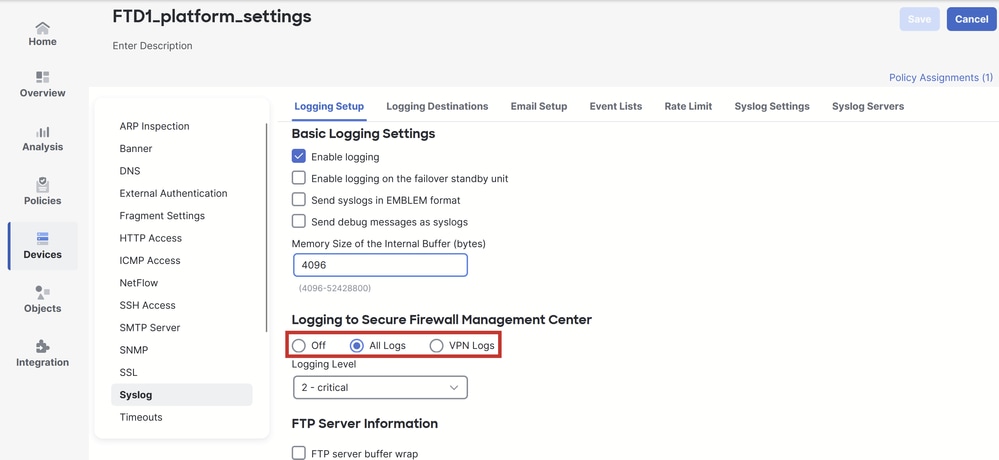 Three Logging Options
If you pick All Logs, you can select any one of the three logging levels available: emergencies, alerts, and critical and send all diagnostic syslog messages to FMC (including VPN).
 Available Logging Levels
If you pick VPN Logs, all logging levels are available and one of those can be selected.
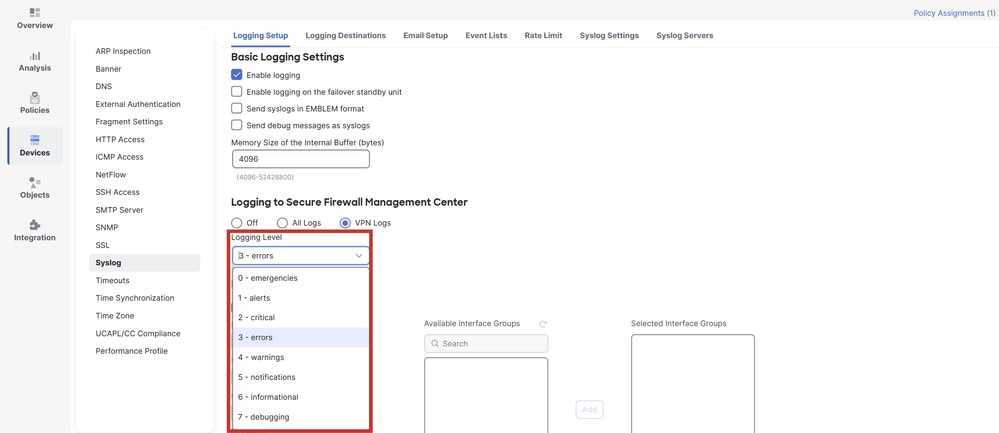 Available Logging Levels

Note: When you configure a device with site-to-site or remote access VPN, it automatically enables sending VPN syslogs to the management center by default. You can change it to All Logs to send all syslogs besides VPN logs to FMC.
These logs can be accessed from Devices > Troubleshoot > Troubleshooting Logs.
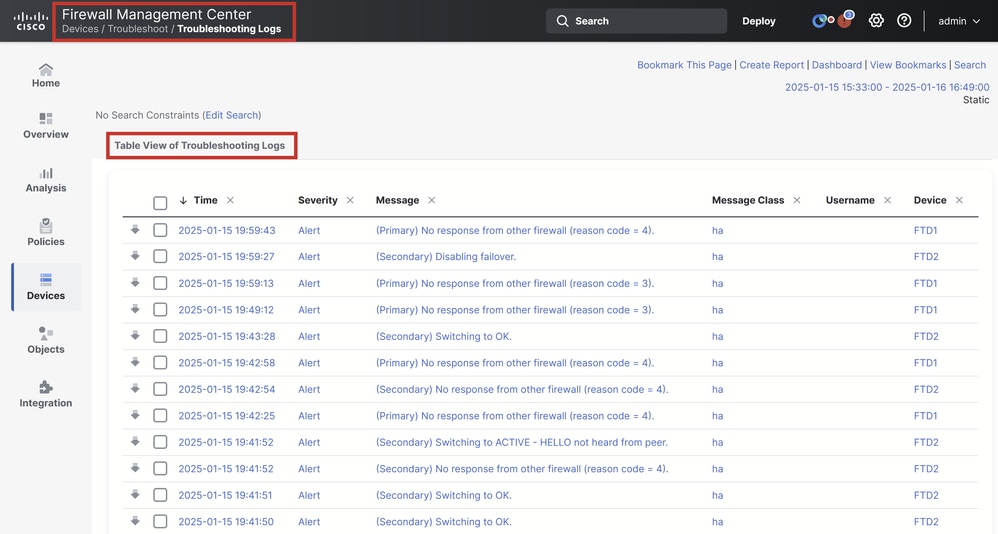 Table View of Troubleshooting Logs
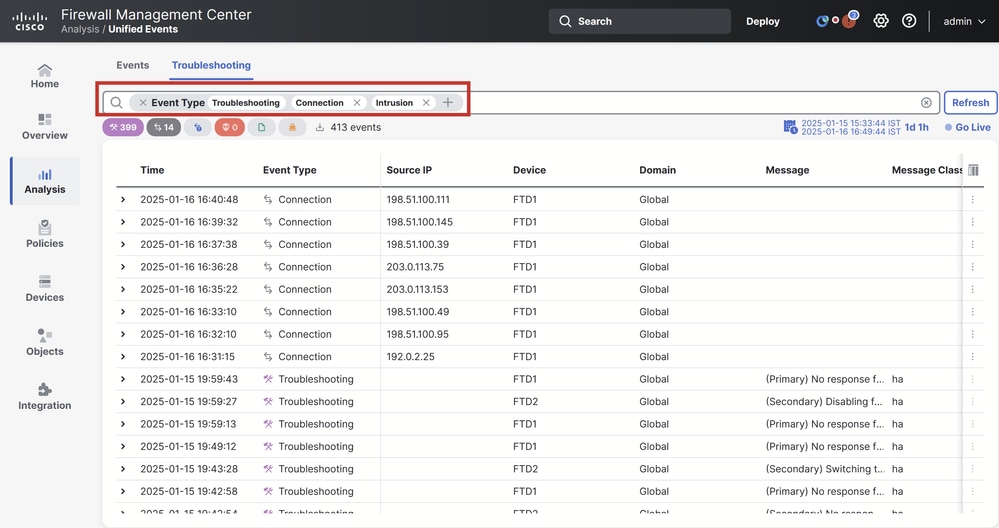
A new Troubleshooting view tab is now available on the Unified Event Viewer page. To view these events, navigate to Analysis > Unified Events > Troubleshooting.
 Troubleshooting View
A new event type is visible within the table once you switch to this tab. It cannot be added or removed from the view like the other types since it is central to the Troubleshooting view.
 Troubleshooting Event Type
Other event types can still be added and removed from this Troubleshooting view. This allows you to view diagnostic logs alongside other event data.
 Other Event Types
Verify the Configuration
Once the the configuration is done from the FMC GUI, it can be verified from the FTD CLI by running the commands show running-config logging and show logging in either CLISH or LINA mode.
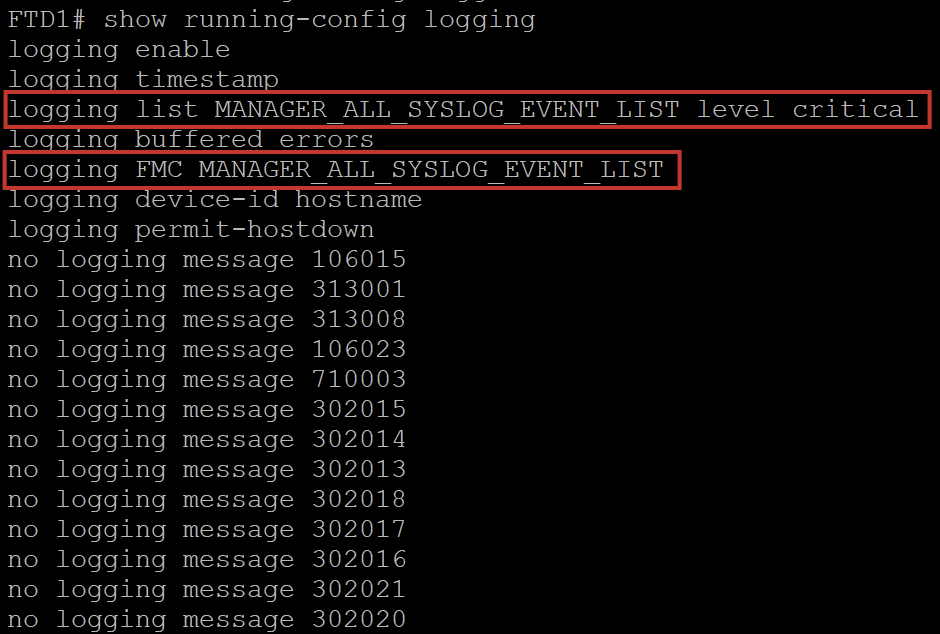 FTD CLI Command
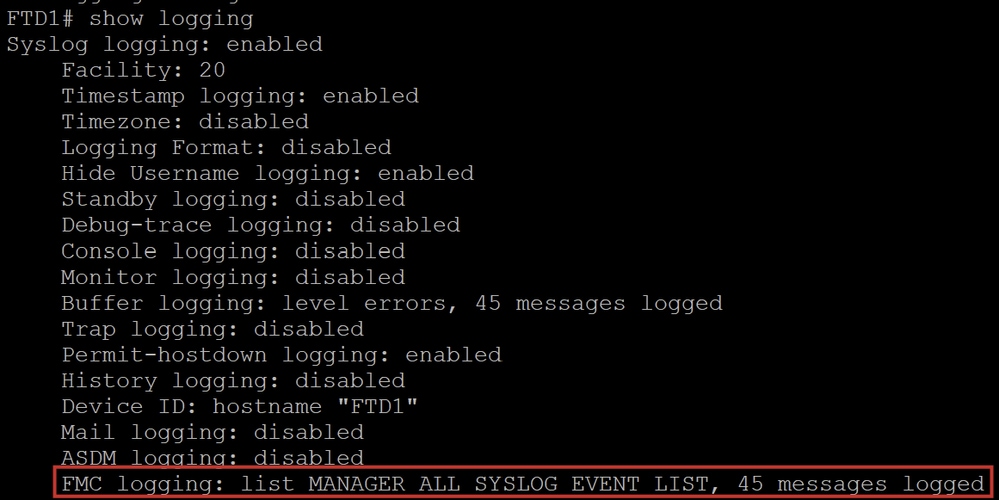 FTD CLI Command
 Feedback