Introduction
In the Secure Malware Analytics (SMA) Appliance, we do not offer SNMP protocol to monitor the appliance resource usage, instead, the appliance offersPrometheus.
This document will outline how to configure a remote Prometheus instance and useGrafanato visualize the data pulled from the appliance.
Prerequisites
Download and install the following tools to your local machine/server:
Requirements
- Secure Malware Analytics (SMA) Appliance Software Version 2.18 and above
- Windows Machine
- Admin access to Appliance Admin(Opadmin) Console
- Secure Malware Analytics (SMA) Appliance Opadmin SSL Certificate Trusted by the local machine
Components Used
Configure
For this document, We have used a Windows 11 Pro as a remote host where we installed Prometheus and Grafana. These tools are also available for Linux or MacOS.
1. Generate API key in Secure Malware Analytics (SMA) Appliance to access metrics
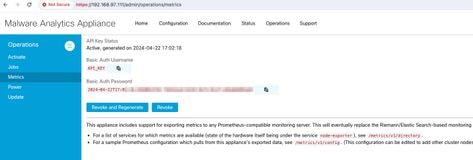
Login to SMA Appliance Opadmin. Generate API Key for Metrics from Opadmin > Operation > Metrics

2. A Basic Auth Username and Password will be generated which we will need to use in Remote Prometheus config.
3. Install and Configure Prometheus
Follow the instructions provided by Prometheus user guides to install your instance if you're using Linux or MacOS. For this document, we have installed Prometheus on a Windows 11 machine, and for the installation process, we followed thisYoutube video.
4. Create a config file with the name prometheus.ymlwith the following content -
scrape_configs:
  - job_name: metrics
    scheme: https
    file_sd_configs:
      - files:
        - 'targets.json'

    relabel_configs:
      - source_labels: [__address__]
        regex:  '[^/]+(/.*)'            # capture '/...' part
        target_label: __metrics_path__  # change metrics path
      - source_labels: [__address__]
        regex:  '([^/]+)/.*'            # capture host:port
        target_label: __address__       # change target
    basic_auth:
      username: "API_KEY"
      password: "2024-04-22T15:32:14.082689318Z xxxxxxxx-xxxx-xxxx-xxxx-xxxxxxxxxxxx"
5. in basic_auth section use the Basic Auth Username and Password generated in Step 1.
6. Pull the configuration of services you will be able to pull metrics from by entering the following in the UI after logging into Opadmin -
https://<opadmin IP>/metrics/v1/config
You will get something like -
[{"labels":{"service":"classifier"},"targets":["192.168.97.111:443/metrics/v1/service/classifier"]},{"labels":{"service":"dictator"},"targets":["192.168.97.111:443/metrics/v1/service/dictator"]},{"labels":{"service":"fav2"},"targets":["192.168.97.111:443/metrics/v1/service/fav2"]},{"labels":{"service":"monbox"},"targets":["192.168.97.111:443/metrics/v1/service/monbox"]},{"labels":{"service":"node-exporter"},"targets":["192.168.97.111:443/metrics/v1/service/node-exporter"]},{"labels":{"service":"observer"},"targets":["192.168.97.111:443/metrics/v1/service/observer"]},{"labels":{"service":"supervisor"},"targets":["192.168.97.111:443/metrics/v1/service/supervisor"]},{"labels":{"service":"ven-entrance"},"targets":["192.168.97.111:443/metrics/v1/service/ven-entrance"]}]
Here 192.168.97.111 is Admin IP for my SMA appliance.
7. Create a file with the name targets.json and copy the above content into that file.
8. Copy prometheus.yml and targets.json to the Prometheus directory (follow installation guides), For Windows, I have created a Folder in C:\ drive and extracted the Prometheus installation files there. Then copied prometheus.yml and targets.json to that same folder.

9. Start Prometheus
Start Prometheus. For Windows execute prometheus.exe from the command line.
C:\Prometheus\prometheus-2.51.2.windows-amd64\prometheus-2.51.2.windows-amd64>prometheus.exe
This will start the Prometheus and start pulling the metrics from the SMA appliance. Note: Do not close the command line or Prometheus will shut down.
10. To check if your local Prometheus instance is able to pull metric from SMA Appliance load Prometheus UI - `http://localhost:9090/`
11. Go to Status > Targets - http://localhost:9090/targets?search=
Within a few minutes you should see all targets and status UP .

12. Install and Configure Grafana
Download the Grafana executable from Grafana Labs. Install Granafa, and follow the instructions provided by the installer.
13. After installing Grafana access UI in the browser -http://localhost:3000/
Go to Home > Connections > Data sources - `http://localhost:3000/connections/datasources`
SelectAdd New Datasource and SelectPrometheus from the list. Enter the `http://localhost:9090/` as the Prometheus Server URL

At the bottom of that page selectSave & test. After a successful test, we can create a Dashboard.
14. Create Grafana Dashboard
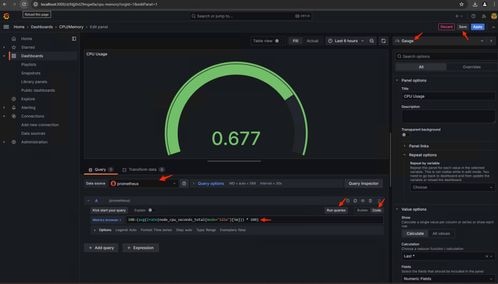
Go toDashboards in Grafana UI , SelectCreate Dashboard>Add visulization. SelectPrometheus Data Source.
In Query builder selectCodeinput, Select Type of Visualization (I selected Gauge)
Enter the following query forCPU Utilization-
100-(avg(irate(node_cpu_seconds_total{mode="idle"}[5m])) * 100)
15. Click on Run Queriesand you should see a visualization of CPU Usage like this -
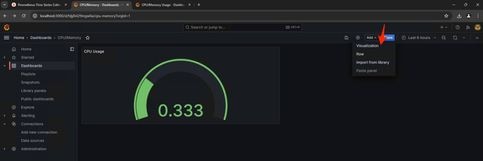
16. Save the panel, name the Dashboard, and Save. Add another Visualization for Memory Usage -
17. For Memory Utilization use the following query
(node_memory_MemTotal_bytes - node_memory_MemAvailable_bytes) / (1024*1024*1024)
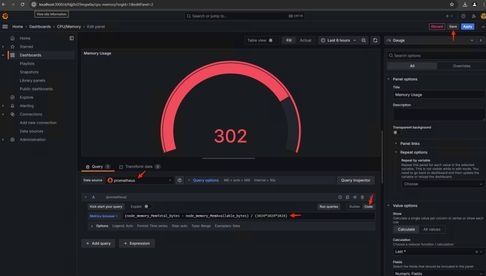
18. Save the changes, and you should have a dashboard like this -

19. Other Hardware and Software metrics are available, For the details click on the links provided inOpadmin> Metrics page

Grafana Dashboard Template
There are many Grafana Dashboard templates available for Node Exporter on the Grafana website. One of them is - Node Exporter Full
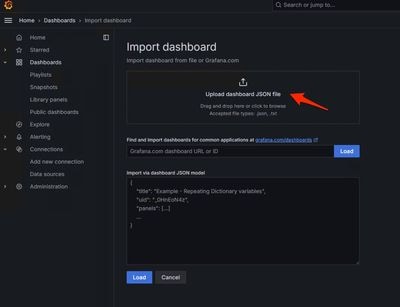
1. To import this dashboard to your Grafana instance Download the JSON, import the JSON file in Grafana

2. Upload the JSON file and Select thePrometheusdata source

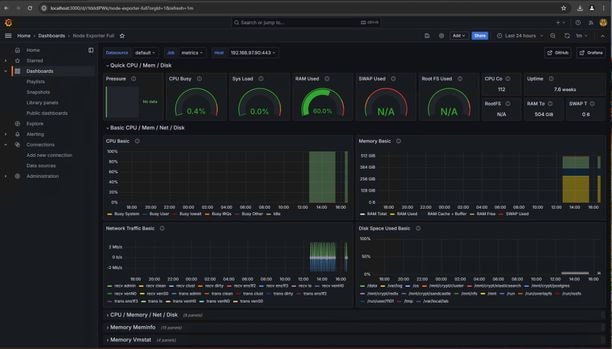
3. This will create a dashboard with a lot of hardware information (not all panel metrics are available)-
Troubleshoot
If the Prometheus failed to connect and pull metric from the SMA appliance, you will see the error in Status > Targets - http://localhost:9090/targets?search=
If there is anyError, that needs to be fixed before it can pull the data. Common issue is SSL certificate of the SMA appliance Opadmin is not being trusted by the local machine. Make sure to create an SMA Admin Certificate with IP and DNS SAN, and add the Signing Root CA to the local machine's trust store.


 Feedback