Introduction
This document describes how to troubleshoot Netflow Telemetry Ingest in Secure Network Analytics (SNA).
Prerequisites
- Cisco SNA knowledge
- NetFlow/IPFIX knowledge
Requirements
- Secure Network Analytics in 7.5.0 or newer
- Flow Collector in 7.5.0 or newer
- CLI access as sysadmin to the Flow Collector
- Admin UI access as admin to the Flow Collector
Configuration Guides
Components Used
- SNA Manager and Flow Collector on 7.5.0
- Wireshark Software
The information in this document was created from the devices in a specific lab environment. All of the devices used in this document started with a cleared (default) configuration. If your network is live, ensure that you understand the potential impact of any command.
Background information
The Flow Collector is a SNA appliance in charge of collect, process and store flows that are sent to Secure Network Analytics. For NetFlow version 9 or IPFIX, several fields could be included on NetFlow/IPFIX template to add more information related to network traffic, however, there are 9 specific fields that must be included in NetFlow/IPFIX template for the Flow Collector to process those Flows. Flow Collector does not process incoming flows which includes a non-valid template, therefore SNA does not display flow information of those exporters under Web UI or Desktop Client.
Required Fields
Next fields must be included on NetFlow/IPFIX template for Telemetry ingest. Ensure that these 9 fields are included on NetFlow/IPFIX template, in order for Secure Network Analytics to process incoming flows.
- Source IP Address
- Destination IP Address
- Source Port
- Destination Port
- Layer 3 Protocol
- Bytes Count
- Packet count
- Flow Start Time
- Flow End Time

Note: More fields could be included on NetFlow/IPFIX configuration, however the previous fields are the minimum requirements of Secure Network Analytics for Telemetry Ingest.
Troubleshoot Process
Verify NetFlow/IPFIX Telemetry Ingest
To confirm if the SNA Flow Collector receives and inserts NetFlow/IPFIX telemetry from the exporters:
- Log in to SNA Flow Collector Admin UI with admin credentials: https://<Flow Collector IP Address>/swa/login.html
- On the left panel, navigate to Support > Browse Files
- Navigate to the next folder: sw > today > logs
- Click on the sw.log file to download it to your local machine and open it on a text editor.
- Search for these lines at the bottom of the log, this summary is created each five minutes:
18:45:00 I-sch-t: process_5_min_period: begin
18:45:00 I-sch-t: process_5_min_period: periods(177)
18:45:00 S-per-t: Performance Period 177
18:45:00 S-per-t: 	Engine status Status normal
18:45:00 S-per-t: 	Processed 6948 flows at 24 fps this period
18:45:00 S-per-t: 	Processed 4226 biflows at 15 fps this period
18:45:00 S-per-t: 	Dropped 0 flows this period
18:45:00 S-per-t: 	Discarded 4358 flows this period due to insufficient template data
18:45:00 S-per-t: 	Processed 1838743 flows at 35 fps today
18:45:00 S-per-t: 	Dropped 0 flows today
18:45:00 S-per-t: 	Discarded 11069 flows today due to insufficient template data
18:45:00 S-per-t: 	Process instance 0 processed 3372 flows at 12 fps this period
18:45:00 S-per-t: 	Process instance 0 processed 2066 biflows at 7 fps this period
18:45:00 S-per-t: 	Process instance 1 processed 3576 flows at 12 fps this period
18:45:00 S-per-t: 	Process instance 1 processed 2160 biflows at 8 fps this period
18:45:00 S-per-t: 	Inserted 2048 flow stats at 7 fps this period
18:45:00 S-per-t: 	Inserted 2013 interface stats at 7 fps this period
18:45:00 S-per-t: 	Inserted 470932 flow stats at 9 fps today
18:45:00 S-per-t: 	Inserted 678994 interface stats at 13 fps today

Note: Line 8 indicates that there are flows discarded due to insufficient template data on the last period.
Verify NetFlow/IPFIX Template
To confirm the fields included on the NetfFlow/IPFIX template:
1. Log in to SNA Flow Collector CLI with sysadmin credentials.
2. On SystemConfig menu, navigate to: Advanced > Packet Capture
3. Enter the information of the exporter that is not showing flows on SNA:
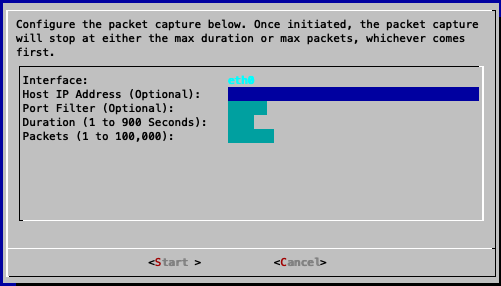
4. Wait until the process is completed.
5. To download the file, log in to SNA Flow Collector Admin UI with admin credentials: https://<Flow Collector IP Address>/swa/login.html
6.On the left panel, navigate to Support > Browse Files
7. Navigate to the next folder: tcpdump
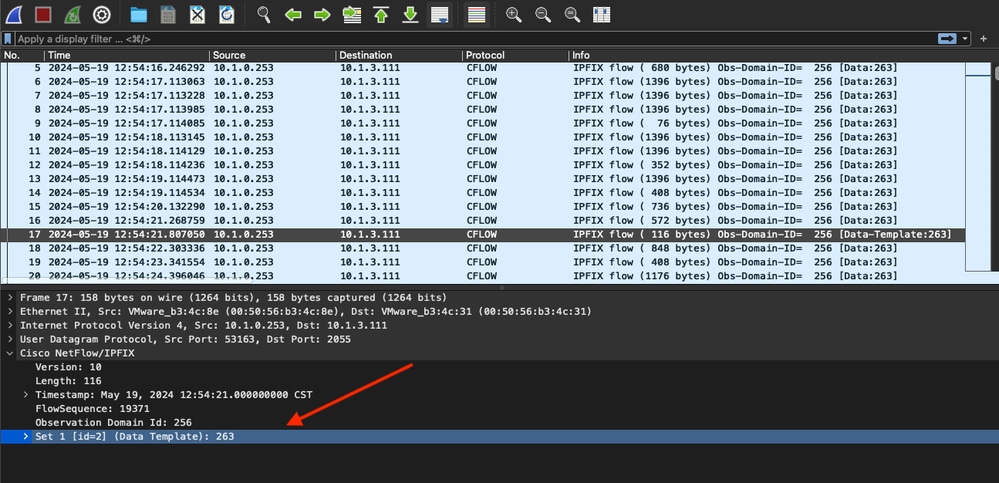
8. Click on the packet capture file to download it in to your local machine and open it on Wireshark:
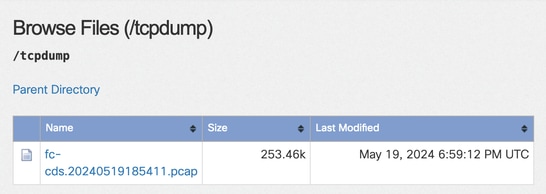
9. Identify the frame in which the NetFlow/IPFIX template was received.
10. Validate that the 9 required fields show on the template
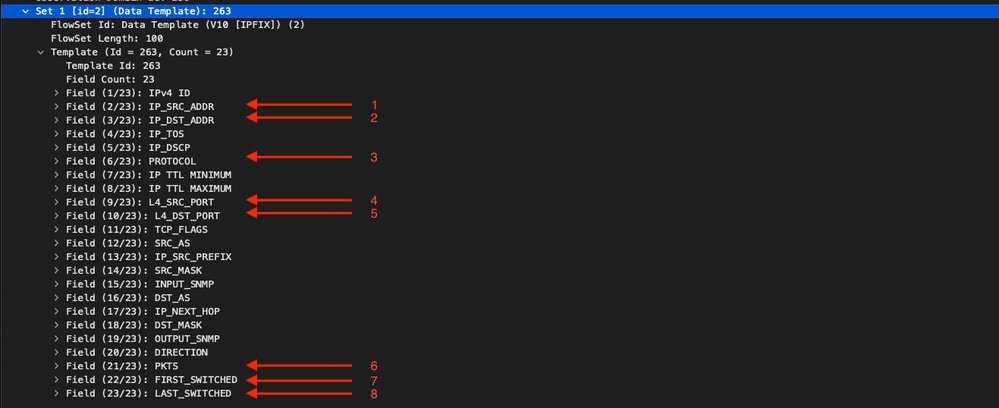

Note: Notice that on the template there are only 8 of the 9 mandatory fields that SNA requires for Telemetry Ingest, for this scenario, BYTES field is missing.
Verify NetFlow/IPFIX Telemetry Ingest after adding the missing field(s)
To confirm if the SNA Flow Collector receives and inserts NetFlow/IPFIX telemetry from the exporter after the change:
- Log in to SNA Flow Collector Admin UI with admin credentials: https://<Flow Collector IP Address>/swa/login.html
- On the left panel, navigate to Support > Browse Files
- Navigate to the next folder: sw > today > logs
- Click on the sw.log file to download it to your local machine and open in on a text editor.
- Search for these lines at the bottom of the log
19:20:00 I-sch-t: process_5_min_period: begin
19:20:00 I-sch-t: process_5_min_period: periods(184)
19:20:00 S-per-t: Performance Period 184
19:20:00 S-per-t: 	Engine status Status normal
19:20:00 S-per-t: 	Processed 10992 flows at 37 fps this period
19:20:00 S-per-t: 	Processed 4176 biflows at 14 fps this period
19:20:00 S-per-t: 	Dropped 0 flows this period
19:20:00 S-per-t: 	Discarded 0 flows this period due to insufficient template data
19:20:00 S-per-t: 	Processed 1896017 flows at 35 fps today
19:20:00 S-per-t: 	Dropped 0 flows today
19:20:00 S-per-t: 	Discarded 36041 flows today due to insufficient template data
19:20:00 S-per-t: 	Process instance 0 processed 5575 flows at 19 fps this period
19:20:00 S-per-t: 	Process instance 0 processed 2195 biflows at 8 fps this period
19:20:00 S-per-t: 	Process instance 1 processed 5417 flows at 19 fps this period
19:20:00 S-per-t: 	Process instance 1 processed 1981 biflows at 7 fps this period
19:20:00 S-per-t: 	Inserted 2878 flow stats at 10 fps this period
19:20:00 S-per-t: 	Inserted 4510 interface stats at 16 fps this period
19:20:00 S-per-t: 	Inserted 486734 flow stats at 9 fps today
19:20:00 S-per-t: 	Inserted 696260 interface stats at 13 fps today

Note: Line 8 indicates that there are no discarded flows on the last period.
Verify NetFlow/IPFIX Telemetry Ingest Port
To confirm if the SNA Flow Collector receives NetFlow/IPFIX telemetry from the exporters on the correct port:
1. Log in to SNA Web UI with an user with admin permissions.
2. On the Top Menu, navigate to Configure and choose Flow Collectors
3. Confirm that the SNA Flow Collector uses the same port that the exporters have configured to send NetFlow/IPFIX
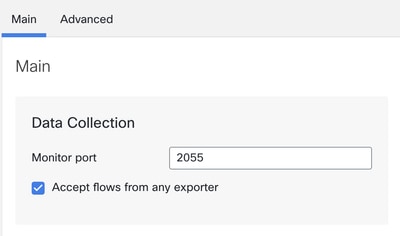

Note: Default port for NetFlow is 2055, however you can select another port, please ensure to use the same port during First Time Setup process on Flow Collector(s).
Verify NetFlow/IPFIX Telemetry Ingest NetFlow option is enabled
To confirm if the SNA Flow Collector option for telemetry ingest of NetFlow/IPFIX is enabled:
- Log in to SNA Flow Collector Admin UI with admin credentials: https://<Flow Collector IP Address>/swa/login.html
- On the left panel, navigate to Support > Advanced Settings
- Confirm that option enable_netflow is set to 1:

Related information


 Feedback