Introduction
This document describes steps to customize and restore Secure Web Appliance (SWA) Dashboard.
Prerequisites
Requirements
Cisco recommends knowledge of these topics:
- Access To Graphic User Interface (GUI) of SWA
- Administrative Access to the SWA.
Components Used
This document is not restricted to specific software and hardware versions.
The information in this document was created from the devices in a specific lab environment. All of the devices used in this document started with a cleared (default) configuration. If your network is live, ensure that you understand the potential impact of any command.
My Dashboard
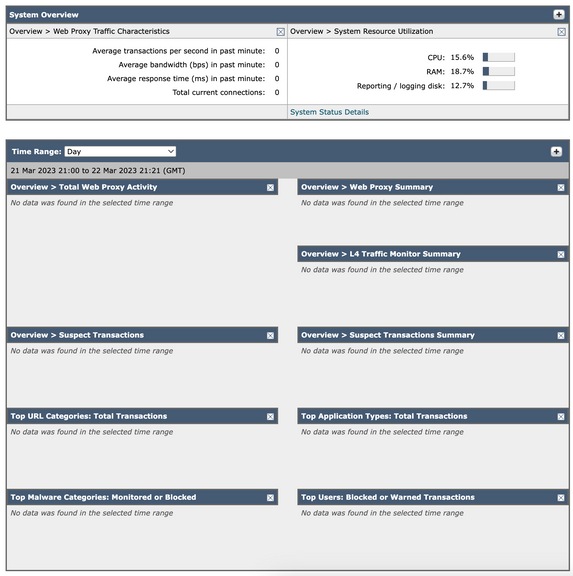
By Default, the SWA landing page is My-Dashboard, which is the page that displays when the user logs into the appliance. My Dashboard contains two main sections:
- System Overview
- Time Range
You can customize various properties of these statistics and reports, such as:
- Data Type
- Time Range
- Position to show on the page
- Show and hide data sets
Default view
By default, the reports and statistics in My-Dashboard are:
- System Overview
- Overview > Web Proxy Traffic Characteristics
- Overview > System Resource Utilization
- Time Range
- Overview > Total Web Proxy Activity
- Overview > Web Proxy Summary
- Overview > L4 Traffic Monitor Summary
- Overview > Suspect Transactions
- Overview > Suspect Transactions Summary
- Top URL Categories: Total Transactions
- Top Application Types: Total Transactions
- Top Malware Categories: Monitored or Blocked
- Top Users: Blocked or Warned Transactions

Web Proxy Traffic Characteristics
Web Proxy Traffic Characteristics lists statistics about transaction:
Average transactions per second in past minute: XX
Average bandwidth (bps) in past minute: XX
Average response time (ms) in past minute: XX
Total current connections: XX
System Resource Utilization
System Resource Utilization lists current Overall Central Processing Unit (CPU) Load, Random Access Memory (RAM) and Report / Log disk usage.
Click System Status Details to switch to the System Status page
(Use the Reporting > System Status page to monitor the System Status. This page displays the current status and configuration of the Secure Web Appliance.).

Note: The CPU utilization value shown on this page and the CPU value shown on the System Status page can differ slightly because they are read separately, at different moments.
Total Web Proxy Activity
You can view the web proxy activity that is reported by the Secure Web Appliances that are currently managed by the Security Management appliance.
This section displays the actual number of transactions and the approximate date that the activity occurred in graphical format.
You can also view the percentage of web proxy activity that are suspect, or clean proxy activity, include the total number of transactions.
Web Proxy Summary
Allows you to view the percentage of Web Proxy activity that are suspect or clean Web Proxy activity.
L4 Traffic Monitor Summary
You can view any L4 traffic that is reported by the Secure Web Appliances that are currently managed by the Security Management appliance, in graphical format.
Suspect Transactions
You can view the web transactions that have been labeled as suspect by the administrator in a graphical format.
This section displays the actual number of transactions and the approximate date that the activity occurred, in graphical format.
Suspect Transactions Summary
You can also view the percentage of blocked or warned transactions that are suspect.
You can see the type of transactions that have been detected and blocked, and the actual number of times that this transaction was blocked.
Top URL Categories: Total Transactions
You can view the top URL Categories that are visited on the site in a graphical format.
Top Application Types: Total Transactions
You can view the top application types that are blocked, which also includes the name of the actual application type and the number of times the specific application has been blocked, in graphical format.
Top Malware Categories: Monitored or Blocked
You can view all the Malware categories that have been detected in graphical format.
Top Users: Blocked or Warned Transactions
You can view the actual users that generated the blocked or warned transactions, in graphical format. Users can be displayed by IP address or by user name.
Modify Time Range
To Modify Time Range date from Day to Hour, Week, 30 days, Yesterday:
Step 1: Select Option (top right)
Step 2: Select Performance
Step 3: Click Edit Preferences
Step 4: Change Reporting Time Range Displayed (default) to one of the available options.
Step 5: Submit There is no need to commit the changes.

Image 2: Steps to edit default time range in My-Dashboard.
Modify Data sets
You can add and remove data sets and reports in the My-Dashboard page. Use plus sign ( + ) to add additional reports, and use X sign on top right of each reports to remove them.

Image 3: Add and Remove reports in My-Dashboard.

Caution: Changes take effect as soon as you change them. There is no need to Submit.
Change Dashboard Design
You can change the order of each data sets in My-Dashboard page. Click on the blue ribbon at the top of each reports, then change the place or that report.
Restore My Dashboard to Default
To restore My-Dashboard to default value, manually edit the configuration file, with these steps:
Step 1: From GUI, Navigate to System Administrations.
Step 2: Select Configuration File.
Step 3: Download the latest Configuration file.

Note: Select Encrypt passwords in the Configuration Files
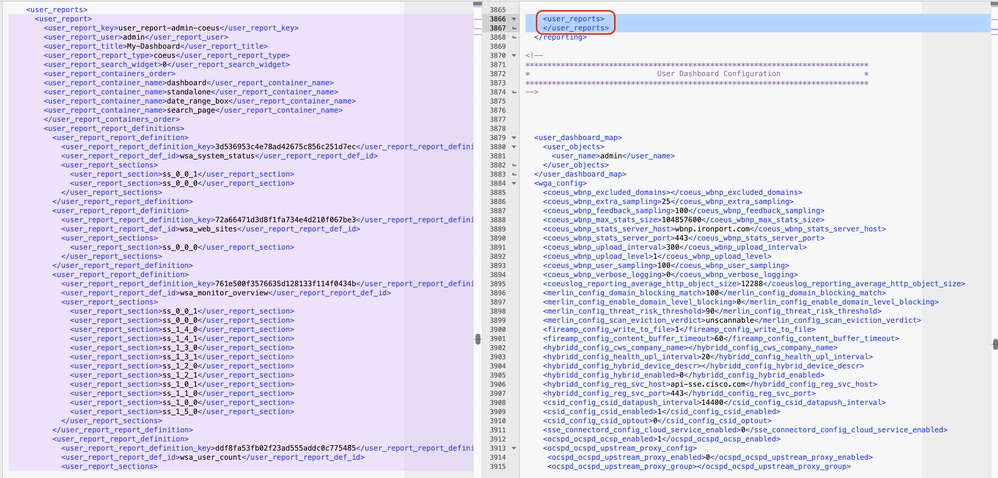
Step 4: Modify the XML file, by remove everything between <user_reports> and </user_reports>.

Image 4: Sample configuration files with customized dashboard (right) and Default configuration file (Left).
Step 5: From Configuration file Page, in Load Configuration section select Load a configuration file from local computer.
Step 6: Upload the modified XML file.
Step 7: Click on Load and commit changes.
Related Information


 Feedback