Introduction
This document describes the steps to add Performance parameter custom field to Secure Web Appliance (SWA) Access Log.
Prerequisites
Requirements
Cisco recommends that you have knowledge of these topics:
- Secure Shell Protocol (SSH) access to SWA management interface.
- Graphical User Interface (GUI) access to the SWA management interface.

Tip: It is best to have more than 20% free disk space on SWA data partition. You can check the disk usage from Command Line Interface (CLI) in the output of status detail command.
Components Used
This document is not restricted to specific software and hardware versions.
The information in this document was created from the devices in a specific lab environment. All of the devices used in this document started with a cleared (default) configuration. If your network is live, ensure that you understand the potential impact of any command.
Background Information
When there is a latency issue and the traffic is proxied through a SWA, the Access Logs can be useful to troubleshoot the root cause of latency. You can change current Access Logs settings or create new Access Logs with Performance Parameters added to Custom Field.
Create Extra Access Log
Under some conditions, due to internal policies or some other configuration, change in current Access Log is not possible. To overcome this limitation, you can create another Access Logs and add the custom Performance parameter in the new Access Logs.
Create New Access Log From GUI
Step 1. Log in to GUI.
Step 2. From System Administration menu choose Log Subscriptions.
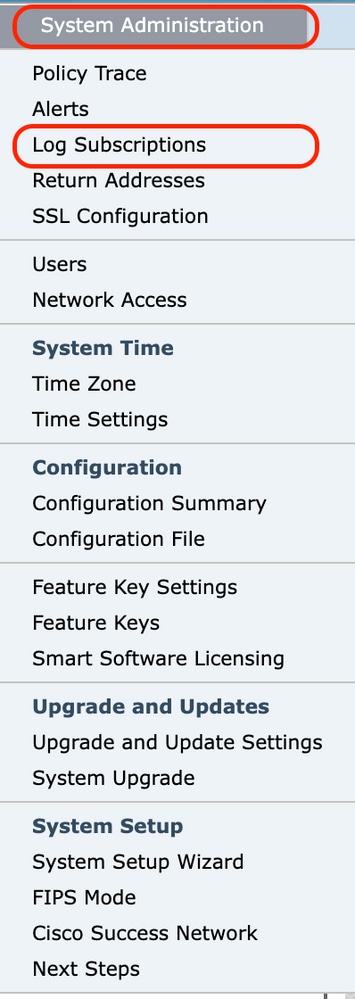 Choose Log Subscription
Step 3. Choose Add Log Subscription ...
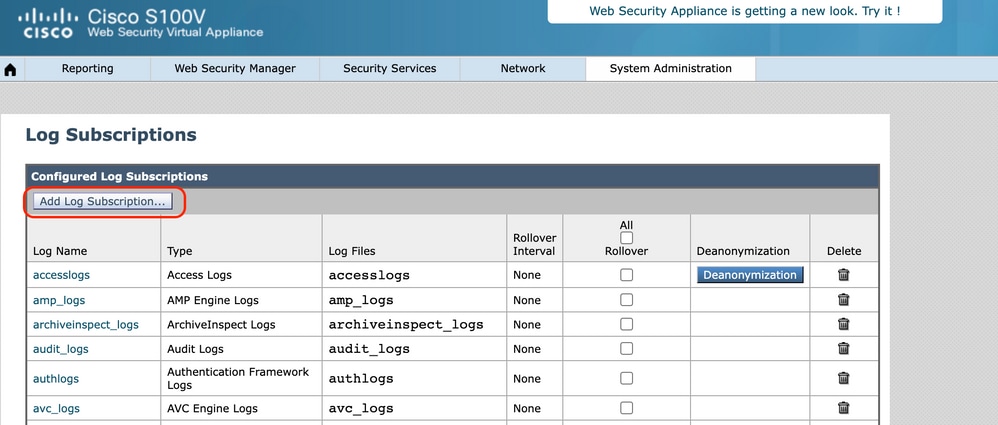 Choose Add Log Subscription
Step 4. From Log Type section choose Access Logs and wait for the page to refresh.
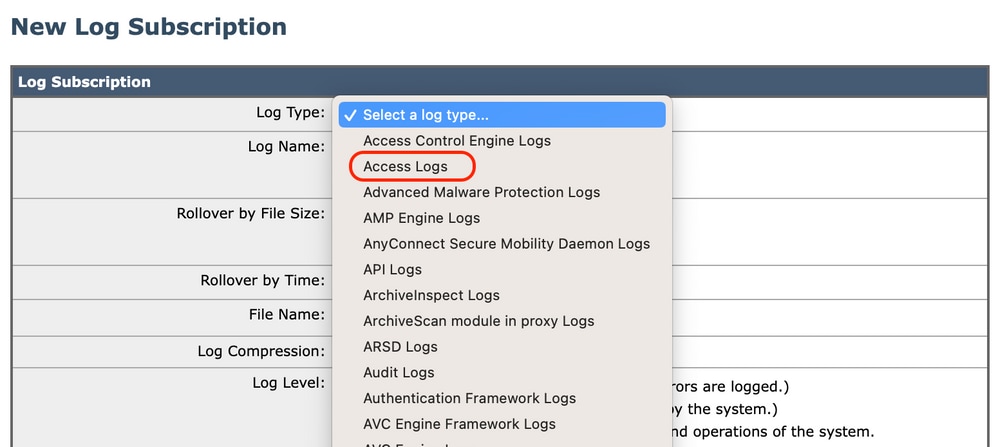 Choose Access logs from log type
Step 5. Type a name for new log in Log Name section. In this example, TAC_access_logs.
Step 6. Enter a value between 102400 (100 Kilobytes) to 10737418240 (10 Gigabytes) for the file size (in byte) before SWA roles over the log to a new file. Number must be an integer, and you can add M to indicate the size in Megabyte, K to indicate the file size in kilobyte and G for gigabyte.

Note: SWA archives (rolls over) log subscriptions when a current log file reaches a user-specified limit of maximum file size, or maximum time since last rollover.
Step 7. Choose Squid for log style.
Step 8. File Name is to define Folder name and the log file name for this new log. It is advised to be same as the log name, which in this example, was TAC_access_logs.
Step 9. You can Enable log compression to compress log file, or keep the logs as a text file.
Step 10. Log Exclusion is to filter Hypertext Transfer Protocol (HTTP) response code. Do not filter HTTP Status codes.
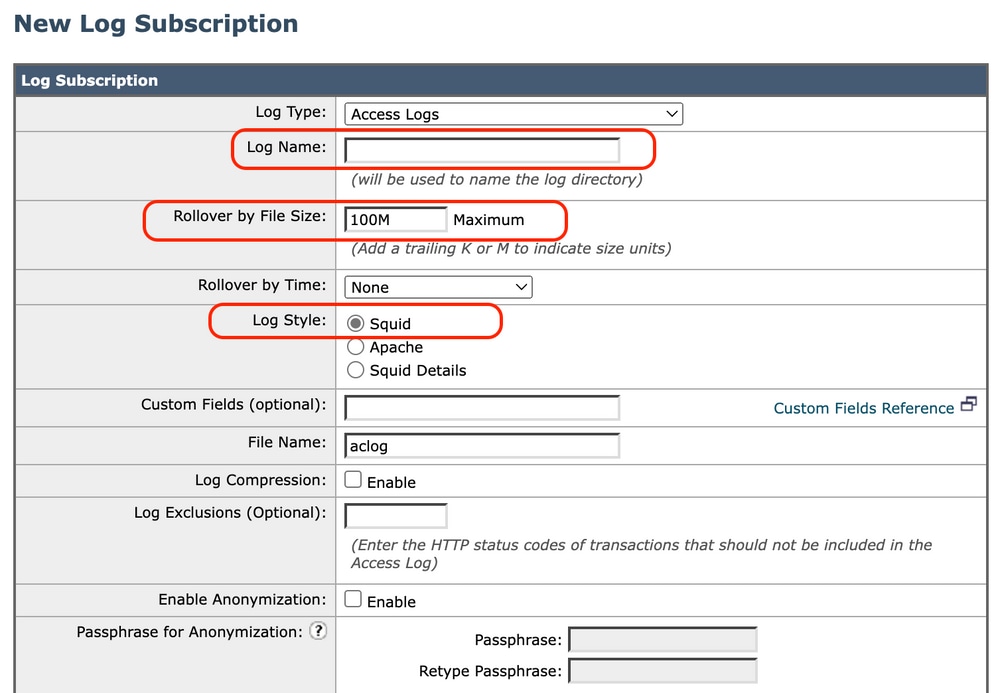 Fill the Mandatory Fields
Step 11. Choose FTP poll to keep the logs in the SWA. Type 1 and press Enter.
Step 12. Submit and commit changes.
Configure New Access Log From CLI
Step 1. Log in to CLI.
Step 2. Run logconfig.
Step 3. To create a new log, type New and press Enter.
Step 4. Find Access Logs in the list, type the number associated with that and press Enter.
Step 5. Type a name for new Log.
Step 6. Type 1 to choose Squid for log style for this subscription, and press Enter.
Step 7. Do not filter HTTP Error Status codes. Press Enter to navigate to next step.
Step 8. Choose FTP poll to keep the logs in the SWA. Type 1 and press Enter.

Note: In order to push the logs to File Transfer Protocol (FTP) server, Secure Copy Protocol (SCP) Server, or Syslog server. You can choose options related to them.
Step 9. This step is to define Folder name and file name for the new log. It is better to be same as the log name, and press Enter.
Step 10. Enter a value between 102400 (100 Kilobytes) to 10737418240 (10 Gigabytes) for the file size (in byte) before SWA role over the log to a new file.

Note: SWA archives (rolls over) log subscriptions when a current log file reaches a user-specified limit of maximum file size, or maximum time since last rollover.
Step 11. Maximum number of files indicates the number of log files stored in the device. If total number of log files reached this value, the older logs are deleted from SWA. Default value is 10 files and you can type the number of logs, due to the available disk space and other logs configuration, then press Enter.
Step 12. In this step, you can choose to compress the logs, or keep them as text file. Type Y for Yes and N for No and hit Enter.

Note: After the file size reached the maximum file size, then it compressed. The compression ratio depends on the network traffic behavior, and could vary between log files.
Step 13. Press Enter to exit the log configuration wizard.
Step 14. Type commit to save the changes.
SWA_CLI> logconfig
...
Choose the operation you want to perform:
- NEW - Create a new log.
- EDIT - Modify a log subscription.
- DELETE - Remove a log subscription.
- HOSTKEYCONFIG - Configure SSH host keys.
[]> NEW

Choose the log file type for this subscription:
1. AVC Engine Framework Logs
2. AVC Engine Logs
3. Access Control Engine Logs
4. Access Logs
....
58. Webroot Logs
59. Welcome Page Acknowledgement Logs
[1]> <=== type the number assosiated with Access Logs and press Enter

Please enter the name for the log:
[]> <=== Chose desiered name, in this example, TAC_access_logs

Choose the log style for this subscription:
1. Squid
2. Apache
3. Squid Details
[1]> <=== Press Enter to keep the default value

Enter the HTTP Error Status codes (comma separated list of 4xx and 5xx codes) you want to filter out from the logs:
[]> <=== Press Enter to keep the default value

Choose the method to retrieve the logs:
1. FTP Poll
2. FTP Push
3. SCP Push
4. Syslog Push
[1]> <=== Choose FTP poll to keep the logs in the SWA

Filename to use for log files:
[aclog]> <=== It is better to have teh same file name as the log, in this example, TAC_access_logs

Do you want to configure time-based log files rollover? [N]> <=== Enter the desiered answer

Please enter the maximum file size:
[104857600]> <=== Enter the desiered answer, or you can leave as default

Please enter the maximum number of files:
[100]> <=== Enter the desiered answer, it depends on free disk space and log file size

Should an alert be sent when files are removed due to the maximum number of files allowed? [N]> <=== Enter the desiered answer

Do you want to compress logs (yes/no)
[n]> <=== Enter the desiered answer

Currently configured logs:
1. "Splunk Logs" Type: "Access Logs" Retrieval: FTP Push - Host 10.0.0.1
2. "TAC_access_logs" Type: "Access Logs" Retrieval: FTP Poll
3. "accesslogs" Type: "Access Logs" Retrieval: FTP Poll
....
40. "webrootlogs" Type: "Webroot Logs" Retrieval: FTP Poll
41. "welcomeack_logs" Type: "Welcome Page Acknowledgement Logs" Retrieval: FTP Poll

Choose the operation you want to perform:
- NEW - Create a new log.
- EDIT - Modify a log subscription.
- DELETE - Remove a log subscription.
- HOSTKEYCONFIG - Configure SSH host keys.
[]> <=== Press Enter to exit the log configuration wizard

SWA_CLI> commit
Please enter some comments describing your changes:
[]> <=== Type the change description and press Enter
Add Custom Fields for Performance Parameter to Access Logs
Step 1. Log in to GUI.
Step 2. From System Administration menu, choose Log Subscriptions.
Step 3. From Log Name column, click accesslogs, or the name of the newly created. In this example, TAC_access_logs.
Step 4. In Custom Fields section, paste this string:
[ Request Details: ID = %I, User Agent = %u, AD Group Memberships = ( %m ) %g ] [ Tx Wait Times (in ms): 1st byte to server = %:<1, Request Header = %:<h, Request to Server = %:<b, 1st byte to client = %:1>, Response Header = %:h>, Client Body = %:b> ] [ Rx Wait Times (in ms): 1st request byte = %:1<, Request Header = %:h<, Client Body = %:b<, 1st response byte = %:>1, Response header = %:>h, Server response = %:>b, Disk Cache = %:>c; Auth response = %:<a, Auth total = %:>a; DNS response = %:<d, DNS total = %:>d, WBRS response = %:<r, WBRS total = %:>r, AVC response = %:A>, AVC total = %:A<, DCA response = %:C>, DCA total = %:C<, McAfee response = %:m>, McAfee total = %:m<, Sophos response = %:p>, Sophos total = %:p<, Webroot response = %:w>, Webroot total = %:w<, Anti-Spyware response = %:<s, Anti-Spyware total = %:>s; AMP response = %:e>, AMP total = %:e<; Latency = %x; %L ] [Client Port = %F, Server IP = %k, Server Port = %p]
Step 5. Submit and commit changes.
Verify the Changes
Step 1. Log in to CLI.
Step 2. Type tail and press enter.
Step 3. Find the number associated to the access Logs which added the Performance Parameter. Type the number and press Enter.
You can see there is extra information added to the Access Logs, same as in this sample.
1680893872.492 1131 172.18.122.156 TCP_MISS/200 379725 GET http://www.cisco.com/en/US/docs/security/wsa/wsa7.7/Release_Notes/WSA_7.7.0_FCS_Release_Notes.pdf - DIRECT/www.cisco.com application/pdf DEFAULT_CASE_12-authenticated_policy-DefaultGroup-DefaultGroup-NONE-NONE-DefaultGroup <IW_comp,6.5,0,"-",0,0,0,0,"-",-1,0,-1,"-",0,262686,"-","-",-,-,IW_comp,-,"Unknown","-","Unknown","Unknown","-","-",2685.94,0,-,"Unknown","-"> - " [ Request Details: ID = 104, User Agent = "Mozilla/5.0 (Windows NT 6.1; WOW64; rv:24.0) Gecko/20100101 Firefox/24.0", AD Group Memberships = ( NONE ) -;] [Tx Wait Times: 1st byte to server = 0, Request Header = 0, Request to Server = 0, 1st byte to client = 290, Response Header = 0, Client Body = 788; Rx Wait Times: 1st request byte = 0, Request Header = 0, Client Body = 0, 1st response byte = 45, Response header = 2, Server response = 779, Disk Cache = 0; Auth response = 0, Auth total = 0; DNS response = 0, DNS total = 0, WBRS response = 0, WBRS total = 2, AVC response = 0, AVC total = 0, DCA response = 0, DCA total = 0, McAfee response = 0, McAfee total = 901, Sophos response = 0, Sophos total = 1028, Webroot response = 0, Webroot total = 0, Anti-Spyware response = 0, Anti-Spyware total = 2; AMP response = 1, AMP total = 1; Latency = 1939; "07/Apr/2023:20:58:55 +0000" ] [Client Port = 3543, Server IP = 10.10.10.10, Server Port = 443]

Tip: You can quit the tail command when you hold Control key and press C. If that did not exit the tail command, type q.
Fields Description in Custom Fields
The values used in the Custom Performance Parameter Field map to these information:

Tip: Latency = AMP total + Anti-Spyware total + Webroot total + Sophos total + McAfee total + AVC total + WBRS total + Auth total
| Custom Field Name |
Custom Field |
Description |
|
Request Header
|
%:<h |
Wait-time to write request header to server after first byte.
|
|
Request to Server
|
%:<b |
Wait-time to write request body to server after header.
|
|
1st byte to client
|
%:1> |
Wait-time for first byte written to client.
|
|
Client Body
|
%:b> |
Wait-time for complete body written to client.
|
|
Rx Wait Times (in ms): 1st request byte
|
%:1< |
The time it takes from the moment the Web Proxy starts to connect to the server to the time it is first able to write to the server. If the Web Proxy has to connect to several servers to complete the transaction, it is the sum of those times.
|
|
Request Header
|
%:h< |
Wait-time for complete client header after first byte.
|
|
Client Body
|
%:b< |
Wait-time for complete client body.
|
|
1st response byte
|
%:>1 |
Wait-time for first response byte from server.
|
|
Response header
|
%:>h |
Wait-time for server header after first response byte.
|
|
Server response
|
%:>b |
This is basically means that SWA got HTTP headers from the server, but SWA waits for the response bytes after that and which would be the actual content from the server.
|
|
Disk Cache
|
%:>c |
Time required for the Web Proxy to read a response from the disk cache.
|
|
Auth response
|
%:<a |
Wait-time to receive the response from the Web Proxy authentication process, after the Web Proxy sent the request.
|
|
Auth total
|
%:>a |
Wait-time to receive the response from the Web Proxy authentication process, includes the time required for the Web Proxy to send the request.
|
|
DNS response
|
%:<d |
Time taken by the Web Proxy to send the Domain Name Request (DNS) request to the Web Proxy DNS process.
|
|
DNS total
|
%:>d |
Time taken by the Web Proxy DNS process to send back a DNS result to the Web Proxy.
|
|
WBRS response
|
%:<r |
Wait-time to receive the response from the Web Reputation Filters, after the Web Proxy sent the request.
|
|
WBRS total
|
%:>r |
Wait-time to receive the verdict from the Web Reputation Filters, includes the time required for the Web Proxy to send the request.
|
|
AVC response
|
%:A> |
Wait-time to receive the response from the Application visibility and Control (AVC )process, after the Web Proxy sent the request.
|
|
AVC total
|
%:A< |
Wait-time to receive the response from the AVC process, includes the time required for the Web Proxy to send the request.
|
|
DCA response
|
%:C> |
Wait-time to receive the response from the Dynamic Content Analysis engine, after the Web Proxy sent the request.
|
|
DCA total
|
%:C< |
Wait-time to receive the verdict from the Dynamic Content Analysis engine, includes the time required for the Web Proxy to send the request.
|
|
McAfee response
|
%:m> |
Wait-time to receive the response from the McAfee scanning engine, after the Web Proxy sent the request.
|
|
McAfee total
|
%:m< |
Wait-time to receive the verdict from the McAfee scanning engine, includes the time required for the Web Proxy to send the request.
|
|
Sophos response
|
%:p> |
Wait-time to receive the response from the Sophos scanning engine, after the Web Proxy sent the request.
|
|
Sophos total
|
%:p< |
Wait-time to receive the verdict from the Sophos scanning engine, includes the time required for the Web Proxy to send the request.
|
|
AMP response
|
%:e> |
Wait-time to receive the response from the AMP engine, after the Web Proxy sent the request.
|
|
AMP total
|
%:e< |
Wait-time to receive the verdict from the AMP engine, includes the time required for the Web Proxy to send the request.
|
|
Latency
|
%x; %L |
Latency and Request local time in human-readable format: DD/MMM/YYYY : hh:mm:ss +nnnn. This field is written with double-quotes in the access logs.
This field allows you to correlate logs to issues without have to calculate local time from epoch time for each log entry.
|
|
Client Port
|
%F |
Port number used from Client side.
|
|
Server IP address
|
%k |
Web Server IP address.
|
|
Server Port number
|
%p |
Web Server Port number.
|
Related Information


 Feedback