FlexPod Common Performance Problems
Available Languages
Contents
Introduction
This document describes common performance problems in FlexPod environments, provides a method to troubleshoot issues, and provides mitigation steps. It is intended as starting point for customers who look to troubleshoot performance in a FlexPod environment. This document was written as a result of issues seen by the Data Center Solutions Technical Assistance Center (TAC) team in recent months.
FlexPod Conceptual Overview
A FlexPod consists of a Unified Computing System (UCS) computer connected via a Nexus switch to NetApp storage and IP networks.
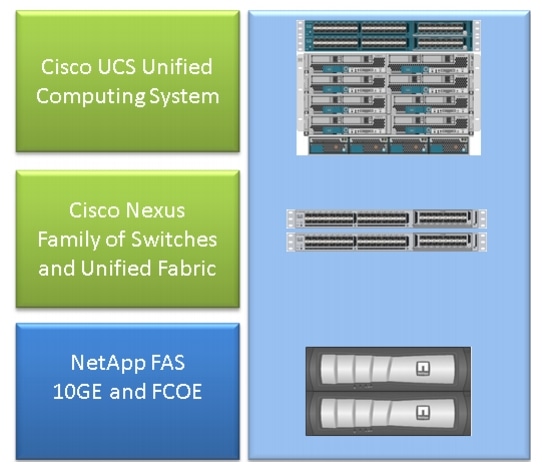
The most common FlexPod consists of a Cisco UCS B-series chassis connected via Fabric Interconnects (FIs) to Nexus 5500 switches to NetApp filers. Another solution, called the FlexPod Express, uses a UCS C-series chassis connected to Nexus 3000 switches. This document discusses the most common FlexPod.
Performance Considerations
In complex environments with multiple responsible parties as typically seen in a FlexPod, you need to consider multiple aspects in order to troubleshoot the issue. Typical performance problems in Layer 2 and IP networks would stem from:
- Packet or frame loss - loss of bits of data causes an adverse effect on performance of applications.
- Buffering - if a packet or frame spends too much time in a queue/buffer certain performance implications might be seen by applications, especially in case of storage networking. Latency, reordering, and normalizer problems fall under this category.
- MTU mismatch problems and fragmentation - a common problem when you reach higher performance. Issues that relate to fragmentation and MTU inconsistency fall in this category.
Environment
It is important to know the environment for which performance is measured. Questions about storage type and protocol, as well as the affected server's operating system (OS) and location, should be raised to properly narrow the problem down. A topology diagram that outlines connectivity is the bare minimum.
Measurement
You need to know what is measured and how it is measured. Certain applications, as well as most storage and hypervisor vendors, provide measurements of some sort that indicate the performance/health of the system. These measurements are a good point to start at as they are not a substitute for most troubleshooting methodologies.
As an example, a Network File System (NFS) storage latency measurement in hypervisor might indicate that performance goes down, however on its own it does not implicate the network. In the case of an NFS, a simple ping from the host to the NFS storage IP network might indicate whether the network is to blame.
Baseline
This point cannot be stressed enough, especially when you open a TAC case. In order to indicate that performance is unsatisfactory, the measured parameter needs to be indicated. This includes the expected and tested value. Ideally, you should show previous data and the testing methodology used to achieve that data.
As an example; 10ms latency achieved when tested, with a write-only from a single initiator to a single Logical Unit Number (LUN), might not be indicative of what the latency is supposed to be for a fully loaded system.
Performance Problems in a FlexPod
Since this document is intended as reference for the majority of FlexPod environments, it outlines only the most frequent problems as seen by the TAC team responsible for Data Center Solutions.
Common Problems
Problems common to storage and IP/Layer 2 networks are discussed in this section.
Frame and Packet Loss
Frame and packet loss is the most frequent factor that impacts performance. One of the common places to look for indications of a problem is at the interface level. From the Nexus 5000 or the UCS Nexus Operating System (NX-OS) CLI, enter the show interface | sec "is up" | egrep ^(Eth|fc)|discard|drop|CRC command. For interfaces which are up, it lists the name and discards counters and drops. Similarly, a great overview is displayed when you enter the show interface counters error command which shows error statistics for all interfaces.
Ethernet World
It is important to know that counters at non-0 might not indicate a problem. In certain scenarios those counters might have been raised in the initial setup or in previous operational changes. An increase of the counters should be monitored.
One can also gather counters from the ASIC level, which might be more indicative. Specifically, for Cyclic Redundancy Check (CRC) error on interfaces, a TAC favorite command to enter is show hardware internal carmel crc. Carmel is the name of the ASIC responsible for port-level forwarding.
Similar output can be taken from 6100 Series FIs or Nexus 5600 switches on a per-port basis. For the FI 6100, the gatos ASIC, enter this command:
show hardware internal gatos port ethernet X/Y | grep
 "OVERSIZE|TOOLONG|DISCARD|UNDERSIZE|FRAGMENT|T_CRC|ERR|JABBER|PAUSE"
For the Nexus 5600, from bigsur ASIC, enter this command:
show hardware internal bigsur port eth x/y | egrep
 "OVERSIZE|TOOLONG|DISCARD|UNDERSIZE|FRAGMENT|T_CRC|ERR|JABBER|PAUSE"
The command for carmel ASIC shows where CRC packets have been received and where they have been forwarded to, and more importantly whether they have been stomped or not.
Since both Nexus 5000 and UCS NX-OS operation is cut-through, switching mode frames with incorrect Frame Check Sequence (FCS) are only stomped before forwarding. It is important to find out where the corrupted frames come from.
bdsol-6248-06-A(nxos)# show hardware internal carmel crc

+----------+------------+------------+------------+------------+------------+------------+------------+
|   Port   | MM rx CRC  | MM Rx Stomp| FI rx CRC  | FI Rx Stomp| FI tx CRC  | FI tx Stomp| MM tx CRC  |
+----------+------------+------------+------------+------------+------------+------------+------------+
(....)
| Eth 1/17 |        --- |        --- |        --- |     908100 |        --- |        --- |        --- |
| Eth 1/18 |        --- |        --- |        --- |     298658 |        --- |        --- |        --- |
(....)
| Eth 1/34 |        --- |        --- |        --- |        --- |        --- |    1206758 |    1206758 |
This example shows stomped packets that come from Eth 1/17 and Eth 1/18, which is an uplink to the Nexus 5000. One can assume that those frames were later on sent down to Eth 1/34, such as Eth 1/17 + Eth 1/18 rx Stomp = Eth 1/34 tx Stomp.
A similar look on the Nexus 5000 shows:
bdsol-n5548-05# show hardware internal carmel crc
+----------+------------+------------+------------+------------+------------+------------+------------+
|   Port   | MM rx CRC  | MM Rx Stomp| FI rx CRC  | FI Rx Stomp| FI tx CRC  | FI tx Stomp| MM tx CRC  |
+----------+------------+------------+------------+------------+------------+------------+------------+
(....)
| Eth 1/14 |         13 |        --- |        --- |         13 |        --- |        --- |        --- |
(.....)
| Eth 1/19 |       7578 |        --- |        --- |       7463 |        --- |        --- |        --- |
This output shows CRCs received on two links and marked as stomps before forwarding. For more information, see the Nexus 5000 Troubleshooting Guide.
Fibre Channel World
A simple way to look for drops (discrds, error, CRCs, B2B credit exhaustion) is via the show interface counters fc command.
This command, available on Nexus 5000 and Fabric Interconnect, gives a good indication of what happens in the Fibre Channel world.
For example:
bdsol-n5548-05# show interface counters fc | i fc|disc|error|B2B|rate|put
fc2/16
 1 minute input rate 72648 bits/sec, 9081 bytes/sec, 6 frames/sec
 1 minute output rate 74624 bits/sec, 9328 bytes/sec, 5 frames/sec
 96879643 frames input, 155712103332 bytes
 0 discards, 0 errors, 0 CRC
 113265534 frames output, 201553309480 bytes
 0 discards, 0 errors
 0 input OLS, 1 LRR, 0 NOS, 0 loop inits
 1 output OLS, 2 LRR, 0 NOS, 0 loop inits
 0 transmit B2B credit transitions from zero
 0 receive B2B credit transitions from zero
 16 receive B2B credit remaining
 32 transmit B2B credit remaining
 0 low priority transmit B2B credit remaining
(...)
This interface is not busy, and the output shows that no discards or error happened.
Additionally, B2B credit transitions from 0 were highlighted; due to Cisco bug IDs CSCue80063 and CSCut08353, those counters cannot be trusted. They work fine on Cisco MDS, but not on the UCS of Nexus5k platforms. Also you can verify Cisco bug ID CSCsz95889.
Similarly to carmel in Ethernet world for Fibre Channel (FC) the fc-mac facility can be used. As an example, for port fc2/1, enter the show hardware internal fc-mac 2 port 1 statistics command. The counters presented are in hexadecimal format.
bdsol-6248-06-A(nxos)# show interface fc1/32 | i disc
        15 discards, 0 errors
        0 discards, 0 errors
bdsol-6248-06-A(nxos)# show hardware internal fc-mac 1 port 32 statistics
 ADDRESS     STAT                                                   COUNT
__________ ________                                           __________________
0x0000003d FCP_CNTR_MAC_RX_BAD_WORDS_FROM_DECODER                           0x70
0x00000042 FCP_CNTR_MAC_CREDIT_IG_XG_MUX_SEND_RRDY_REQ                0x1e4f1026
0x00000043 FCP_CNTR_MAC_CREDIT_EG_DEC_RRDY                             0x66cafd1
0x00000061 FCP_CNTR_MAC_DATA_RX_CLASS3_FRAMES                         0x1e4f1026
0x00000069 FCP_CNTR_MAC_DATA_RX_CLASS3_WORDS                        0xe80946c708
0x000d834c FCP_CNTR_PIF_RX_DROP                                              0xf
0x00000065 FCP_CNTR_MAC_DATA_TX_CLASS3_FRAMES                          0x66cafd1
0x0000006d FCP_CNTR_MAC_DATA_TX_CLASS3_WORDS                        0x2b0fae9588
0xffffffff FCP_CNTR_OLS_IN                                                   0x1
0xffffffff FCP_CNTR_LRR_IN                                                   0x1
0xffffffff FCP_CNTR_OLS_OUT                                                  0x1
The output shows 15 discards on input. This can be matched to FCP_CNTR_PIF_RX_DROP which counted to 0xf (15 in decimal). This information can be again correlated to FWM (Forwarding Manager) information.
bdsol-6248-06-A(nxos)# show platform fwm info pif fc 1/32 verbose | i drop|discard|asic
fc1/32 pd: slot 0  logical port num 31  slot_asic_num 3  global_asic_num 3 fwm_inst 7
  fc 0
fc1/32 pd: tx stats: bytes 191196731188 frames 107908990 discard 0 drop 0
fc1/32 pd: rx stats: bytes 998251154572 frames 509332733 discard 0 drop 15
fc1/32 pd fcoe: tx stats: bytes 191196731188 frames 107908990 discard 0 drop 0
fc1/32 pd fcoe: rx stats: bytes 998251154572 frames 509332733 discard 0 drop 15
However, this tellls the administrator the amount of drops and which is the corresponding ASIC number. The get information about the reason of that dropped ASIC needs to be queried.
bdsol-6248-06-A(nxos)# show platform fwm info asic-errors 3
Printing non zero Carmel error registers:
DROP_SHOULD_HAVE_INT_MULTICAST: res0 = 25 res1 = 0 [36]
DROP_INGRESS_ACL: res0 = 15 res1 = 0 [46]
In this case, traffic was dropped by the ingress Access Control List (ACL), typically in FC world - zoning.
MTU Mismatch
In FlexPod environments it is important to accommodate the end-to-end Maximum Transition Unit (MTU) setting for applications and protocols where it is required. In the case of most environments, this is Fibre Channel over Ethernet (FCoE) and jumbo frames.
Additionally, should fragmentation occur, degraded performance is to be expected. In case of protocols such as Network File System (NFS) and Internet Small Computer System Interface (iSCSI), it is important to test and prove end-to-end IP Maximum Transmission Unit (MTU) and TCP Maximum Segment Size (MSS).
Whether you troubleshoot jumbo frames or FCoE, it is important to remember that both of those need consistent configuration and Class of Service (CoS) marking across the environment in order to operate properly.
In the case of UCS and Nexus, a command that is useful to validate the per-interface, per QoS-group MTU setting is show queuing interface | i queuing|qos-group|MTU.
MTU Display on Nexus 5000 and UCS Platforms
A known aspect of both UCS and Nexus is the display of MTUs on the interface. This output demonstrates an interface configured to queue Jumbo frames and FCoE:
bdsol-6248-06-A(nxos)# show queuing interface e1/1 | i MTU
    q-size: 360640, HW MTU: 9126 (9126 configured)
    q-size: 79360, HW MTU: 2158 (2158 configured)
At the same time , the show interface command displays 1500 bytes:
bdsol-6248-06-A(nxos)# show int e1/1 | i MTU
  MTU 1500 bytes, BW 10000000 Kbit, DLY 10 usec
If compared to carmel ASIC information, the ASIC shows the MTU capability of a given port.
show hardware internal carmel port ethernet 1/1 | egrep -i MTU
        mtu                : 9260
This MTU mismatch in display is expected on aforementioned platforms, and could potentially mislead neophytes.
End-to-end Configuration
End-to-end consistent configuration is the only way to guarantee proper performance. Jumbo frames configuration and steps for the Cisco side, as well as VMware ESXi, are described in UCS with VMware ESXi End-to-End Jumbo MTU Configuration Example.
UCS FCoE Uplink Configuration Example shows a UCS and Nexus 5000 configuration. See Appendix A in the referenced document for an outline of a basic Nexus 5000 configuration.
Set up FCoE Connectivity for a Cisco UCS Blade focuses on UCS configuration for FCoE. Nexus 5000 NPIV FCoE with FCoE NPV Attached UCS Configuration Example focuses on the Nexus configuration.
Test End-to-end Jumbo Frames
Most modern day operating systems offer the ability to test a proper jumbo frames configuration with a simple Internet Control Message Protocol (ICMP) test.
Calculation
9000 bytes - IP header without options (20 bytes) - ICMP header (8 bytes) = 8972 bytes of data
Commands in Popular Operating Systems
Linux
ping a.b.c.d -M do -s 8972
Microsoft Windows
ping -f -l 8972 a.b.c.d
ESXi
vmkping -d -s 8972 a.b.c.d
Buffer Related Problems
Buffering and other latency related problems are among the common performance degradation causes in the FlexPod environment. Not all problems reported as latency stem from actual buffering problems, quite a few measurements might indicate end-to-end latency. For example, in the case of NFS, the reported time period might be needed to successfully read/write to storage and not actual network latency.
Congestion is the most common cause for buffering. In the Layer 2 world, congestion can cause buffering and even tails drops of frames. In order to avoid drops during congestion periods, IEEE 802.3x pause frames and Priority Flow Control (PFC) were introduced. Both rely on asking the end point to hold transmissions for a short period of time while congestion lasts. This can be caused by network congestion (overwhelm the received with amount of data) or because a prioritized frame needs to pass, as in the case for FCoE.
Flow Control - 802.3x
In order to verify which interfaces have flow control enabled, enter the show interface flowcontrol command. It is important to follow the recommendation of the storage vendor in regards to flow control being enabled.
An illustration that shows how 802.3x flow control works is shown here.

PFC - 802.1Qbb
PFC is not required for all setups, but is recommended for most. In order to verify which interfaces have PFC enabled, the show interface priority-flow-control | i On command can be run on the UCS's NX-OS and the Nexus 5000.
The interfaces between FIs and the Nexus 5000 should be visible on that list. If not, the QoS configuration needs to be verified. QoS needs to be consistent end-to-end in order to take advantage of PFC. In order to check why the PFC does not come up on a particular interface, enter the show system internal dcbx log interface ethernet x/y command in order to obtain the Data Center Bridging Capabilities Exchange Protocol (DCBX) log.
An illustration that shows how pause frames work with PFC is shown here.

The show interface priority-flow-control command allows the administrator to observe the per-QoS class behavior of priority pause frames.
Here's an example :
bdsol-6120-05-A(nxos)# show queuing interface ethernet 1/1 | i prio
 Per-priority-pause status : Rx (Inactive), Tx (Inactive)
 Per-priority-pause status : Rx (Inactive), Tx (Active)
This output shows that, in second class, the device was just transmitting (TX) a PPP frame.
In this case, Ethernet 1/1 is port facing IOM and while the overall port will not have PFC enabled, it might process PPP frames for FEX ports.
bdsol-6120-05-A(nxos)# show interface e1/1 priority-flow-control
============================================================
Port Mode Oper(VL bmap) RxPPP TxPPP
============================================================
Ethernet1/1 Auto Off 4885 3709920
In this case, FEX interfaces are involved.
bdsol-6120-05-A(nxos)# show interface priority-flow-control | egrep .*\/.*\/
Ethernet1/1/1 Auto Off 0 0
Ethernet1/1/2 Auto Off 0 0
Ethernet1/1/3 Auto Off 0 0
Ethernet1/1/4 Auto Off 0 0
Ethernet1/1/5 Auto On (8) 8202210 15038419
Ethernet1/1/6 Auto On (8) 0 1073455
Ethernet1/1/7 Auto Off 0 0
Ethernet1/1/8 Auto On (8) 0 3956077
Ethernet1/1/9 Auto Off 0 0
The FEX ports that are involved can be also checked via show fex X detail where X is the chassis number.
bdsol-6120-05-A(nxos)# show fex 1 detail | section "Fex Port"
 Fex Port State Fabric Port
 Eth1/1/1 Down Eth1/1
 Eth1/1/2 Down Eth1/2
 Eth1/1/3 Down None
 Eth1/1/4 Down None
 Eth1/1/5 Up Eth1/1
 Eth1/1/6 Up Eth1/2
 Eth1/1/7 Down None
 Eth1/1/8 Up Eth1/2
 Eth1/1/9 Up Eth1/2
See these documents for more information about pause mechanisms.
- Fibre Channel over Ethernet Operations
- Unified Fabric White Paper-Fibre Channel over Ethernet (FCoE)
Queuing Discards
Both the Nexus 5000 and the UCS NX-OS keep track of ingress discards due to queuing on a per QOS-group basis. For example:
bdsol-6120-05-A(nxos)# show queuing interface
Ethernet1/1 queuing information:
  TX Queuing
    qos-group  sched-type  oper-bandwidth
        0       WRR             50
        1       WRR             50
  RX Queuing
    qos-group 0
    q-size: 243200, HW MTU: 9280 (9216 configured)
    drop-type: drop, xon: 0, xoff: 243200
    Statistics:
        Pkts received over the port             : 31051574
        Ucast pkts sent to the cross-bar        : 30272680
        Mcast pkts sent to the cross-bar        : 778894
        Ucast pkts received from the cross-bar  : 27988565
        Pkts sent to the port                   : 34600961
        Pkts discarded on ingress               : 0
        Per-priority-pause status               : Rx (Inactive), Tx (Active)
Ingress discard should happen only in queues which are configured to allow drops.
Ingress queueing discards can happen due to these reasons:
- Switched Port Analyzer (SPAN)/Monitoring session enabled on some of the interfaces (see Cisco bug ID CSCur25521)
- Back pressure from another interface, pause frames are typically seen when enabled
- Traffic punted to the CPU
Driver Problem
Cisco provides two operating system drivers for UCS, enic and fnic. Enic is responsible for Ethernet connectivity and fnic is responsible for Fibre Channel and FCoE connectivity. It is very important that enic and fnic drivers are exactly as specified in the UCS interoperability matrix. Problems introduced by incorrect drivers range from packet loss and added latency to a longer boot process or complete lack of connectivity.
Adapter Information
A Cisco-provided adapter can provide a good measurement about traffic that is passed, as well as drops. This example shows how to connect to chassis X, server Y, and adapter Z.
bdsol-6248-06-A# connect adapter X/Y/Z
adapter X/Y/Z # connect
No entry for terminal type "dumb";
using dumb terminal settings.
From here, the administrator can log in to the Monitoring Center for Performance (MCP) facility.
adapter 1/2/1 (top):1# attach-mcp
No entry for terminal type "dumb";
using dumb terminal settings
The MCP facility allows you to monitor usage of traffic per logical interface (LIF).
adapter 1/2/1 (mcp):1# vnic
(...)
---------------------------------------- --------- --------------------------
                v n i c                    l i f             v i f
id  name           type    bb:dd.f state lif state uif  ucsm   idx vlan state
--- -------------- ------- ------- ----- --- ----- --- ----- ----- ---- -----
 13 vnic_1         enet    06:00.0 UP      2 UP    =>0   834    20 3709 UP
 14 vnic_2         fc      07:00.0 UP      3 UP    =>0   836    17  970 UP
Chassis 1, sever 1, and adapter 1 have two Virtual Network Interface Cards (VNICs) associated with virtual interfaces (Virtual Ethernet or Virtual Fibre Channel) 834 and 836. Those have numbers 2 and 3. The statistics for LIF 2 and 3 can be checked as shown here:
adapter 1/2/1 (mcp):3# lifstats 2
               DELTA                TOTAL DESCRIPTION
                   4                    4 Tx unicast frames without error
               53999                53999 Tx multicast frames without error
               69489                69489 Tx broadcast frames without error
                 500                  500 Tx unicast bytes without error
             8361780              8361780 Tx multicast bytes without error
            22309578             22309578 Tx broadcast bytes without error
                   2                    2 Rx unicast frames without error
             2791371              2791371 Rx multicast frames without error
             4595548              4595548 Rx broadcast frames without error
                 188                  188 Rx unicast bytes without error
           260068999            260068999 Rx multicast bytes without error
           514082967            514082967 Rx broadcast bytes without error
             3668331              3668331 Rx frames len == 64
             2485417              2485417 Rx frames 64 < len <= 127
              655185               655185 Rx frames 128 <= len <= 255
              434424               434424 Rx frames 256 <= len <= 511
              143564               143564 Rx frames 512 <= len <= 1023
              94.599bps                   Tx rate
               2.631kbps                  Rx rate
It is important to note that the administrator of UCS is provided with the total and delta (between two subsequent executions of lifstats) columns as well as current traffic load per-LIF and information about any errors which might have occurred.
The previous example shows interfaces without any errors with a very small load. This example shows a different server.
adapter 4/4/1 (mcp):2# lifstats 2
              DELTA                TOTAL DESCRIPTION
           127927993            127927993 Tx unicast frames without error
              273955               273955 Tx multicast frames without error
              122540               122540 Tx broadcast frames without error
         50648286058          50648286058 Tx unicast bytes without error
            40207322             40207322 Tx multicast bytes without error
            13984837             13984837 Tx broadcast bytes without error

              28008032             28008032 Tx TSO frames
           262357491            262357491 Rx unicast frames without error
            55256866             55256866 Rx multicast frames without error
            51088959             51088959 Rx broadcast frames without error
        286578757623         286578757623 Rx unicast bytes without error
          4998435976           4998435976 Rx multicast bytes without error
          7657961343           7657961343 Rx broadcast bytes without error

                    96                   96 Rx rq drop pkts (no bufs or rq disabled)

                136256               136256 Rx rq drop bytes (no bufs or rq disabled)
             5245223              5245223 Rx frames len == 64
           136998234            136998234 Rx frames 64 < len <= 127
             9787080              9787080 Rx frames 128 <= len <= 255
            14176908             14176908 Rx frames 256 <= len <= 511
            11318174             11318174 Rx frames 512 <= len <= 1023
            61181991             61181991 Rx frames 1024 <= len <= 1518
           129995706            129995706 Rx frames len > 1518

               136.241kbps                  Tx rate

             784.185kbps                  Rx rate
Two interesting bits of information show that 96 frames were dropped by the adapter due to lack of buffer or buffering disabled and additionally TCP Segment Offloading (TSO) segments being processed.
Logical Packet Flow
The diagram shown here outlines logical packet flow in a FlexPod environment.
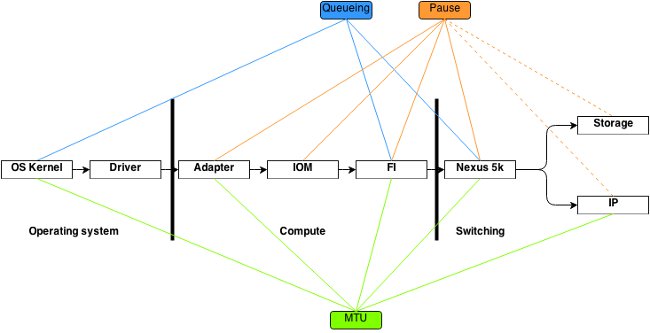
This diagram is meant as a breakdown of components a frame passed through on the way via the FlexPod environment. It does not reflect complexity of any of the blocks and is simply a way to memorize where particular features should be configured and verified.
Input/Output Module
As shown in logical packet flow diagram, the Input/Output Module (IOM) is a component in the middle of all communication that goes through the UCS. In order to connect to the IOM in chassis X, enter the connect iom x command.
Here are several other useful commands:
- Topology information - the show platform software [woodside|redwood] sts command shows topological information from the IOM's point of view.
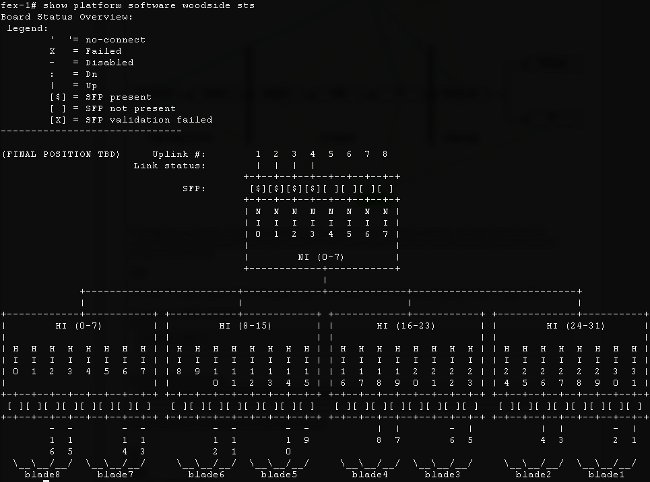
It shows network interfaces (NIs) that lead up to FIs, in this case there are eight of them, with four of them up. Additionally, it shows host interfaces (HIs) that lead, within the chassis, to particular blades.
- Traffic rate - the show platform software [woodside|redwood] rate command is used to check the rate of traffic that passes through the HI interfaces once the topology and HI interface to blade mapping is known.

- Traffic loss - enter the show platform software [woodside|redwood] loss command. The execution of this command zeros the loss counters. It allows you to see pause frames and drops on a per-interface basis.
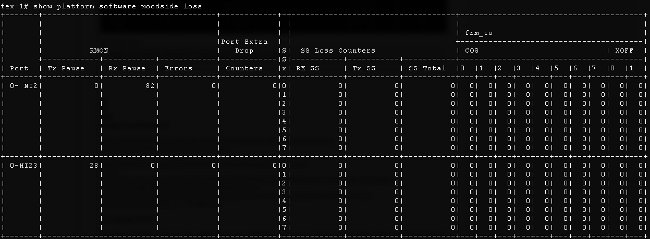
Due to the way the underlying infrastructure works, the counters are shown only for interfaces which have experienced any loss in between execution of the two commands. In this example, you see that the NI2 interface received 82 pause frames and that 28 pause frames were transmitted to interface HI23, which you know is attached to blade 3.
Design Considerations
A FlexPod allows for a flexible configuration and set up of storage and data networking. With flexibility also comes additional challenges. It is vital to follow best practices documents and a Cisco Validated Design (CVD):
- CVD - FlexPod Deployment Guide
- NetApp storage best practices (not specific to Flexpod) - Cisco Unified Computing System (UCS) Storage Connectivity Options and Best Practices with NetApp Storage
Port Speed Selection and Port Channel Considerations
A common problem seen by TAC engineers is overutilization of links due to the selection of 1 Gbit Ethernet instead of 10 Gbit Ethernet referenced in best practice documents. As a pointed example, single flow performance will not be better on ten 1 Gbit links compared to one 10 Gbit link. In port channel a single flow can go over a single link.
In order to find out what load balancing method is used on Nexus and/or FI's NX-OS, enter the show port-channel load-balance command. The administrator can also find out which interface in a port channel will be chosen as the outgoing interface for a packet or frame. A simple example of a frame on VLAN49 between two hosts is shown here:
show port-channel load-balance forwarding-path interface port-channel 928 vlan 49
 src-mac 70ca.9bce.ee24 dst-mac 8478.ac55.2fc2
Missing params will be substituted by 0's.
Load-balance Algorithm on switch: source-dest-ip
crc8_hash: 2    Outgoing port id: Ethernet1/27
Param(s) used to calculate load-balance:
        dst-mac:  8478.ac55.2fc2
        src-mac:  70ca.9bce.ee24
Storage Specific Problems
The problems discussed previously are common to both data and storage networking. For the sake of completeness, performance problems specific to Storage Area Network (SAN) are also mentioned. Storage protocols were built with resiliency and mutli-pathing are still augmented. With the advent of technologies such as Asymmetric Logical Unit Assignment (ALUA) and Multi-path IO (MPIO), more flexibility and options are presented to administrators.
Storage Placement
Another consideration is placement of storage. A FlexPod design dictates that storage is to be attached on Nexus switches. Directly attached storage does not conform to CVD. Designs with directly attached storage are supported, if best practices are followed. At the same time, those designs are not strictly FlexPod.
Optimal Path Selection
This is technically not a Cisco issue, as most of those options are transparent to Cisco devices. It is a common problem to pick and stick to an optimal path. A modern Device Specific Module (DSM) can be presented with multiple paths and needs to pick an optimal one(s), based on certain criteria to provide resiliency and load balancing. This screenshot shows four paths available to NetApp DSM for Microsoft Windows and load balancing options.
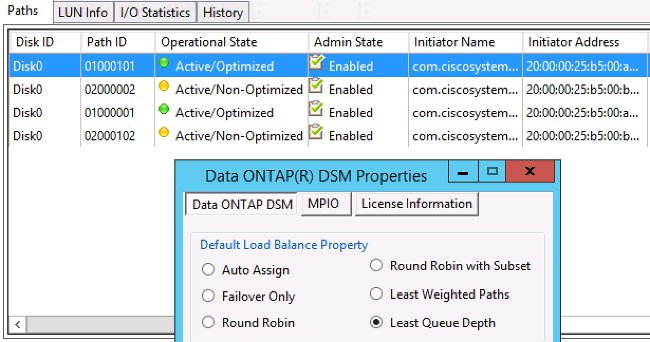
The recommended settings should be picked based on a discussion with the storage vendor. Those settings might affect performance problems. A typical test that the TAC might ask you to perform is a read/write test through only fabric A or fabric B. This typically allows you to narrow down performance problems to situations discussed in the "Common Problems" section of this document.
VM and Hypervisor Traffic Sharing
This point is specific to the compute component, regardless of the vendor. An easy way to set up a storage network for hypervisors from the compute point of view is to create two Host Bus Adapters (HBAs), one for each Fibre, and run both the boot LUN traffic and Virtual Machine (VM) storage traffic over those two interfaces. It is always recommended to split the boot LUN traffic and VM storage traffic. This allows for better performance and additionally allows a logical split between the two kinds of traffic. See the "Known Issues" section for an example.
Troubleshoot Tips
Narrow Down the Problem
As in the case of any fast troubleshooting, it is very important to narrow down the problem and ask the right questions.
- Which devices/applications/VM are (/not) affected?
- Which storage controller are (/not) affected?
- Which paths are (/not) affected?
- How often does the problem (/not) appear?
Cisco
Counter Limitations
In this document interface, ASIC queuing counters are discussed. Counters also give a view at a point in time, so it is important to monitor the increase of counters. Certain counters cannot be cleared by design. For example, the carmel ASIC mentioned previously.
In order to give a pointed example, the presence of CRC or discards on an interface might not be ideal, but it might be expected that their values are non-zero. The counters could have risen at some point in time, possibly during transition or initial setup. Hence it is important to note the increase of the counters and when was the last time they were cleared.
Control Plane Considerations
While it is useful to review counters, it is important to know that certain data plane problems might not find an easy reflection to control plane counters and tools. As a pointed example, the ethanalyzer is a very useful tool that is available on both UCS and Nexus 5000. However, it can only capture control plane traffic. A traffic capture is what the TAC often requests, especially when it is not clear where the fault lies.
Capture Traffic
A reliable traffic capture taken on the end hosts can shed light on a performance problem and narrow it down quite fast. Both the Nexus 5000 and UCS offer traffic SPAN. Specifically, UCS's options of SPANing particular HBAs and fabric sides are useful. In order to learn more about the traffic capture capabilties when you monitor a session on UCS, see these references:
- UCS Traffic Analysis for Physical and Virtual Adapters (video)
- Cisco UCS Manager GUI Configuration Guide - Monitoring Traffic
NetApp
NetApp offers a complete set of utilities in order to troubleshoot their storage controllers, among them are:
- perfstat - a very useful utility, typically run for NetApp support personnel
- systat - provides information about how busy the filer is and what the filer is doing - NetApp Support Library
There are among the most common commands:
sysstat -x 2
sysstat -M 2
Here are some things to look for in sysstat -x 2 output which might indicate overloaded NetApp array or disks:
- Sustained CP ty column with lots of : or F
- Sustained HDD util column above 20%
This article describes how to configure NetApp: NetApp Ethernet Storage Best Practices .
- VLAN tagging
- VLAN trunking
- Jumbo MTU
- IP Hashing
- Disable FlowControl
VMware
ESXi provides Secure Shell (SSH) access, through which you can troubleshoot. Among the most useful tools provided to administrators are esxtop and perfmon.
- esxtop - much like Linux/BSD top, it allows users to monitor real-time performance related parameters
Using esxtop to identify storage performance issues for ESX / ESXi - perfmon - allows users to troubleshoot Microsoft Windows Virtual Machines (VM)
Collecting the Windows Perfmon log data to diagnose virtual machine performance issues - Collect diagnostic bundle on ESXi - Collecting diagnostic information for VMware ESX/ESXi using the vSphere Client (653)
- VMware vSwitch Load Balancing requirement for Cisco B-Series servers - Route based on IP hash is not supported with Cisco UCS B200 M1/M2 blade servers that use UCS 6100 Series Fabric Interconnects
Known Issues and Enhancements
- Cisco bug ID CSCuj86736 - with passive twinax cables CRC errors may increase. This is caused when Nexus 5000 does not optimize DFE. Enter the show hardware internal carmel eye command in order to verify that the "Eye height" parameter is above 100 mv. This was fixed in Releases 5.2(1)N1(7) and 7.0(4)N1(1).
- Cisco bug ID CSCuo76425 - similar to the previous bug and also exists on the UCS fabric interconnects. This is fixed in Release 2.2(3a).
- Cisco bug ID CSCuo76425 - same as bug CSCuj86736 except for UCS Fabric Interconnect.
- Cisco bug ID CSCup40056 - timing problem caused by sharing of boot traffic with VM traffic described in Unified Computing System Virtual Machine Live Migration Fails with Virtual Fibre Channel Adapters.
- Slow drain detection and avoidance - very often FC and FCoE are affected by slow drain. NX-OS Release 7.0(0)N1(1) introduces means to detect and avoid it. Learn more about the feature in the Cisco Nexus 5500 Series NX-OS Interfaces Configuration Guide and Slow Drain Device Detection and Congestion Avoidance.
- Cisco bug ID CSCuj81245 - a limitation exists in PALO based cards (VIC1240 and others) that causes FC aborts.
- Cisco bug ID CSCuh61202 - after upgrade to Release 2.1(3), UCS firmware FC aborts and multiple other problems can be seen.
- Cisco bug ID CSCtw91018 - a mix of MTU settings for VNICs on a single, PALO-based adapter can cause starvation for some of traffic classes.
- Cisco bug ID CSCuq40256 - will cause PFC to be disabled on links from Fabric Interconnect down to server adapters. This will cause variety of problems that start with Fibre Channel aborts and Out-of-Order frames reported on the storage side. Storage disconnects and other performance problems might be reported.
TAC Cases
In many of the cases, the TAC engineer will ask you to collect some basic information before an investigation can be started.
- Topology diagram - which includes port numbers and line speeds, absolutely necessary.
- UCSM technical support - Visual Guide to collect Tech Support files (B and C series).
- UCS chassis technical support for one chassis that experiences problems - see previous link.
- Both Nexus 5000 technical support and any other network devices between the UCS and the NetApp - Redirecting output of the show tech-support details command.
- Output of the show queueing interface command on both of the FIs.
connect nxos A|B
show queuing interface | no-more
show interface priority-flow-control | no-more
show interface flowcontrol | no-more. - Host driver versions on the ESXi perform - enter these commands:
- vmkload_mod -s enic
- vmkload_mod -s fnic
- Linux -
dmesg | egrep -i 'enic|fnic'
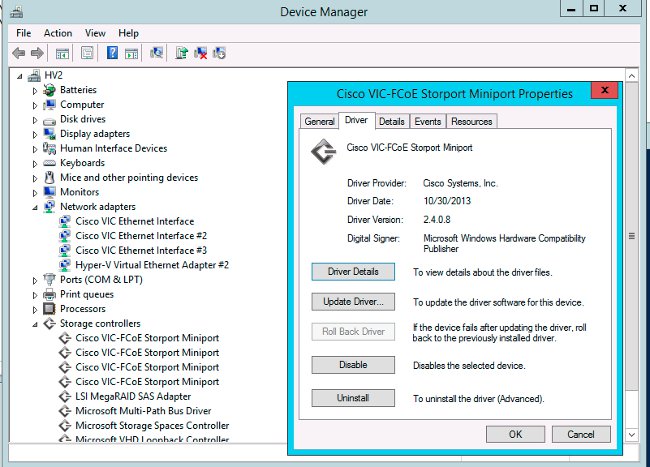
- Windows - check the driver version in "device manager". An example from Window 2012 R2 shows three Cisco VIC Ethernet interfaces and four VIC FCoE miniport interfaces (responsible also for Fibre Channel, not only FCoE) and Release 2.4.0.8 of the fnic driver.
Feedback
Use the feedback button to provide feedback about this document or your experiences. We will continuously update this document as developments occur and after feedback is received.
Revision History
| Revision | Publish Date | Comments |
|---|---|---|
1.0 |
20-Feb-2015 |
Initial Release |
Contact Cisco
- Open a Support Case

- (Requires a Cisco Service Contract)


 Feedback