Manage the Dashboard of the FindIT Network Probe
Available Languages
Objective
The Dashboard in the Cisco FindIT Network Probe allows you to view the performance of the network as well as the devices connected to it in real time, allowing you to take necessary steps as soon as you see the status of the network. Widgets are used to display the data in graphical form. By default, Device Health, WLAN Client Count, Device Client Count, and Traffic are the widgets displayed in the Dashboard. This can be customized by choosing only the information you want to be displayed while hiding the others. The layout of the Dashboard can also be changed according to your preference.
This article aims to show you how to manage the Dashboard on the FindIT Network Probe. It assumes that you already have the necessary settings configured on the devices to be discovered by the FindIT Network Probe.
Manage the Dashboard of the FindIT Network Probe
Adding a New Widget
Step 1. Log in to the FindIT Network Probe Administration GUI then choose Dashboard.
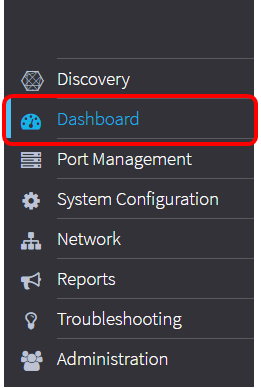
Step 2. Click the enable edit mode icon.

Step 3. Click the add new widget icon.

Step 4. Click the items that you need to add. The options are:

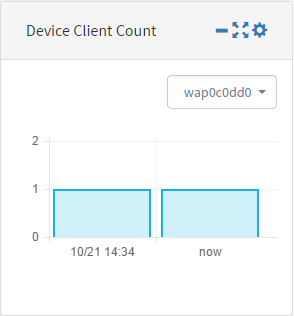
- Device Client Count — Displays a graph of the number of hosts connected to the device at a preset interval. This widget can be set to refresh every minute, 5 minutes, 10 minutes, 1 hour, 2 hours, or 1 day. In this example, there is only one client connected.
- Device Health — Indicates the status of the device with its color. Green means that the device status is Normal. Orange indicates that the device is in Warning status. Gray indicates that the status of the device is unknown.

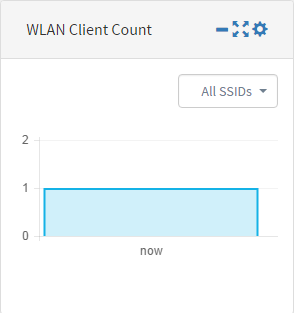
- Network Client Count — Displays a graph of the number of devices connected to the network at a preset interval. This widget can be set to refresh every minute, 5 minutes, 10 minutes, 1 hour, 2 hours, or 1 day.
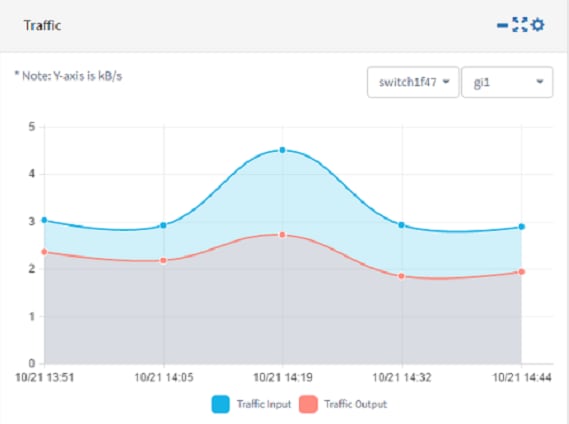
- Traffic — Displays a graph of the flow of traffic on the selected interface of a device. The refresh rate for this widget can be from 1 minute to 1 day, depending on the setting. However, it can only display data for a specific interval and cannot be backtracked.
Step 5. Click Save.

You should now have successfully added widgets to the Dashboard.
Remove a Widget
Widgets may be removed to allow you to organize the Dashboard. Each widget has a change location, minimize, full screen, settings, and remove widget icon. Follow these steps to remove a widget.
Step 1. Choose the widget that needs to be removed.
Step 2. Click the enable edit mode icon.

Step 3. Click the remove widget icon.
Note: In this example, the Device Client Count widget is being removed.

Step 4. Click the Save icon.

You should now have successfully removed a widget from the Dashboard.
Change the Layout of the Dashboard
Step 1. Click the enable edit mode icon.

Step 2. Click the settings icon.

Step 3. (Optional) Enter a name for the new layout in the Title field. In this example, Dashboard is used.

Step 4. Under Structure, click the button of the layout that you prefer. In this example, 3-9(6-6:12) is chosen.
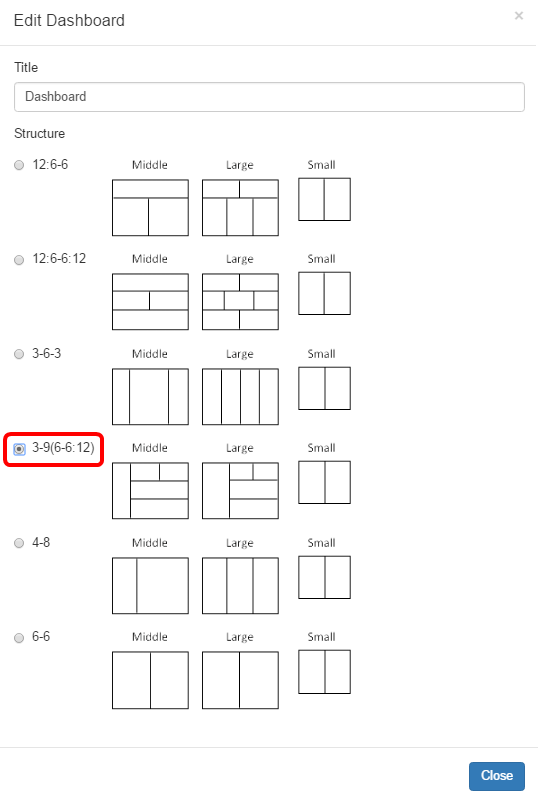
Step 5. Click Close.
Step 6. (Optional) While still on Edit Mode, choose the widget that needs to be moved.
Step 7. Click and hold the change widget location icon and then drag the widget to its new location.

Step 8. Click Save.

You should now have successfully changed the layout of the Dashboard.
Manage the Device Client Count Widget
Step 1. Choose the device whose client count needs to be displayed from the drop-down menu. In this example, wap0c0dd0 is chosen, and there is one host connected to the device.
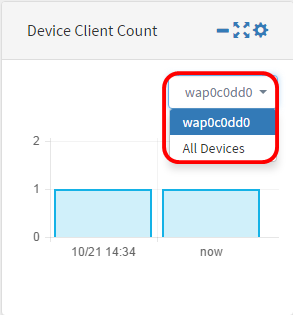
Step 2. (Optional) To hide the Device Client Count widget, click the minimize widget icon.

Step 3. (Optional) To adjust the size of the Device Client Count widget, click the fullscreen widget icon.

Step 4. (Optional) To change the name and refresh interval of the widget, click the settings icon.

Step 5. (Optional) Enter the new name of the widget in the Title field. The default name of the widget is Device Client Count.
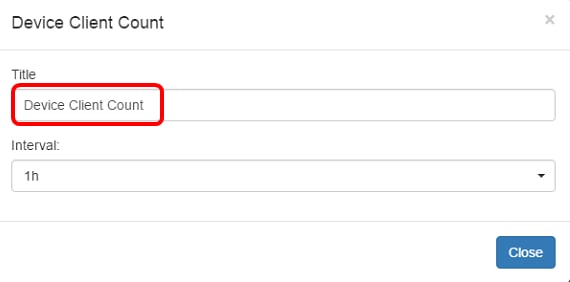
Step 6. Choose the refresh interval from the Interval drop-down menu. The default setting is 1h.

Step 7. Click Close.

You should now have successfully changed the name and interval of the Device Client Count widget.
Manage the Device Health Widget
Step 1. Hover your mouse over the Device Health icon to view the details of a device such as Status, Hostname, CPU Load, Status Level, Device Type, and MAC Address.

Step 2. (Optional) To hide the Device Health widget, click the minimize widget icon.

Step 3. (Optional) To adjust the size of the Device Health widget click the fullscreen widget icon.

Step 4. (Optional) Click settings on the Device Health widget.

Step 5. (Optional) Enter the new name of the widget in the Title field. In this example, the name of the widget is Device Health.

Step 6. Click Close.
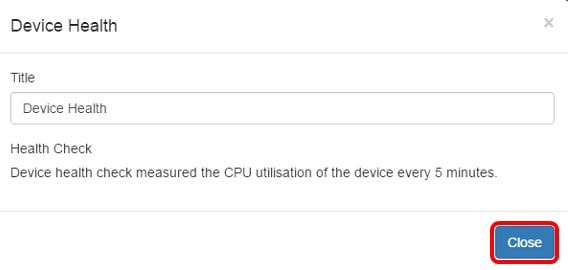
You should now have successfully changed the settings of the Device Health Widget.
Manage the WLAN Client Count Widget
Step 1. (Optional) To hide the WLAN Client Count widget, click the minimize widget icon.

Step 2. (Optional) To increase the size of the WLAN Client Count widget, click the fullscreen widget icon.

Step 3. Click the settings icon on the WLAN Client Count widget.
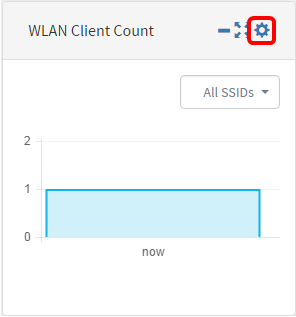
Step 4.(Optional) Enter a new name for the WLAN Client Count widget. In this example, it is named WLAN Client Count.

Step 5. (Optional) Choose the Interval from the drop-down menu. In this example, 1h is chosen.

Step 6. Click Close.

You should now have successfully changed the name and interval of the WLAN Client Count widget.
Manage the Traffic Widget

Step 1. (Optional) To hide the Traffic widget, click the minimize widget icon on the Traffic widget.

Step 2. (Optional) To increase the size of the Traffic widget, click the fullscreen widget icon.

Step 3. Click the settings icon on the Traffic widget.

Step 4. Enter the name of the widget in the Title field. In this example, the widget is named Traffic.
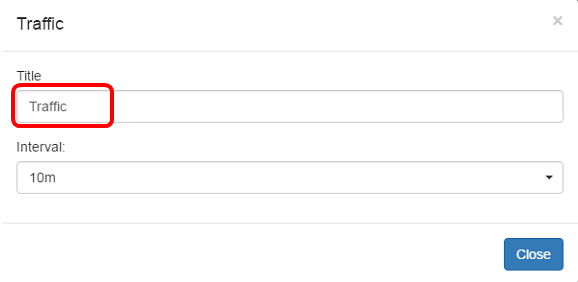
Step 5. (Optional) Choose the Interval from the drop-down menu. In this example, 10m is chosen. The default value is 1h.

Step 6. Click Close.

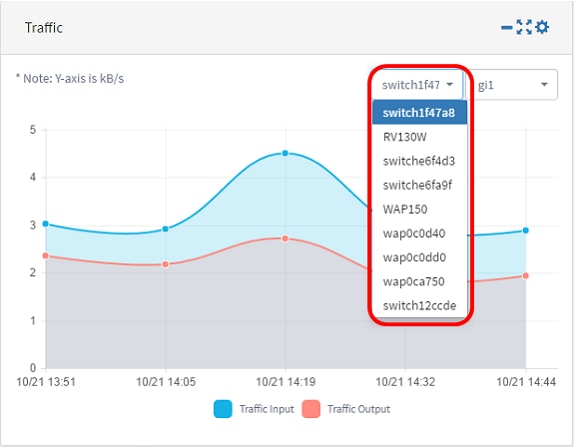
Step 7. (Optional) Choose the device whose traffic needs to be displayed in the graph from the drop-down menu. In this example, switch1f47a8 is chosen.
Step 8. (Optional) Choose the Interface whose traffic needs to be displayed in the graph from the drop-down menu. In this example, traffic for the gi1 interface of switch1f47a8 is chosen.
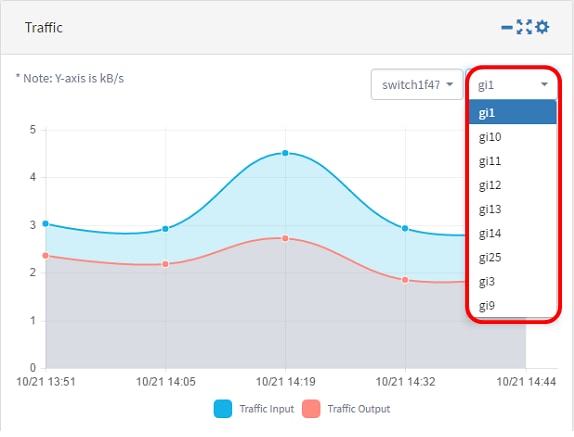
You should now have successfully changed the settings of the Traffic widget.
Contact Cisco
- Open a Support Case

- (Requires a Cisco Service Contract)
 Feedback