Configure Log Settings on the RV130 and RV130W
Available Languages
Objective
Log settings define the logging rules and output destinations for error messages, authorization violation messages, and trace data as various events are recorded on the network. Log settings can also specify which system messages are logged based on the facility that generated the message and its severity level.
Remote log servers can make managing networks easier by centralizing where messages are logged and archived for improved organization. As a result, they are not lost if the router is reset or power cycled.
The objective of this document is to explain how to configure log settings on the RV130 and the RV130W.
Applicable Devices
• RV130
• RV130W
Software Version
• v1.0.1.3
Configuring Log Settings
Step 1. Log in to the web configuration utility and choose Administration > Logging > Log Settings. The Log Settings window opens:
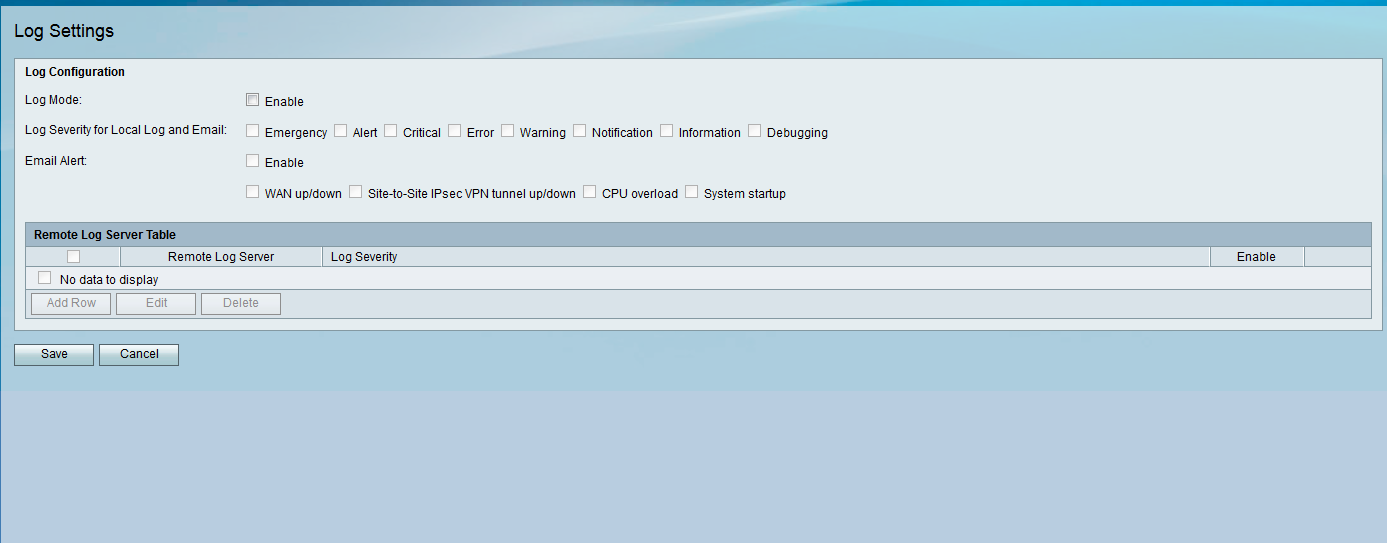
Step 2. In the Log Mode field, check the Enable check box to enable logging on the device.
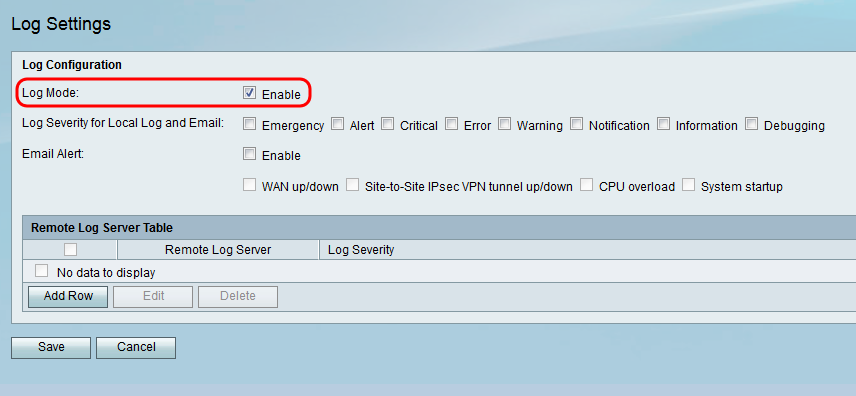
Step 3. Check the desired check boxes in the Log Severity for Local Log and Email field that correspond to the categories of events you would like to be logged.
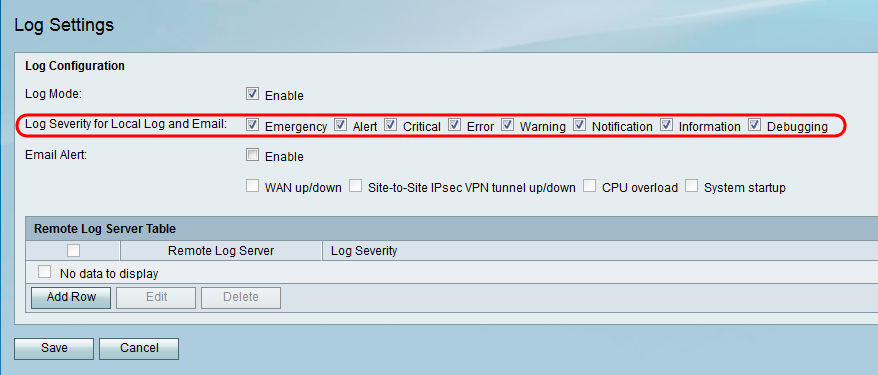
The available options are defined as follows and listed in order of highest to lowest priority:
• Emergency — Message is logged if a device is down or unusable. The message is normally broadcast to all processes.
• Alert — Message is logged if there is a serious device malfunction, such as a case in which all device features stop working.
• Critical — Message is logged if there is critical device malfunction, such as two ports not functioning properly while the remaining ports work fine.
• Error — Message is logged if there is an error within a device, such as a single port being offline.
• Warning — Message is logged if a device is functioning properly, but an operational problem occurs.
• Notification — Message is logged if a device is functioning properly, but a system notice occurs.
• Information — Message is logged if a condition that is not an error condition exists on the device, but may require attention or special handling.
• Debugging — Provides all detailed debugging messages.
Note: Selecting log severity options placed at lower priority levels will automatically include and check any log severity options with higher priority levels. For example, choosing Error logs automatically includes Emergency, Alert, and Critical logs in addition to Error logs.
Step 4. In the Email Alert field, check the Enable check box to allow your device to send email alerts for specific events or behaviors that may impact performance and security, or for debugging purposes.
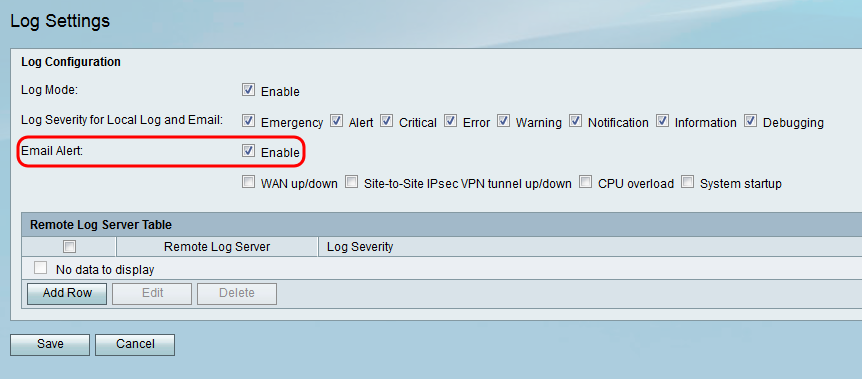
Note: In order to fully configure Email Alerts, your email settings must also be configured to the device. Refer to Email Settings on the RV130 and RV130W for more information.
Step 5. (Optional) If Email Alert is enabled in Step 4, check the check boxes that correspond to the events you would like to receive email alerts for.
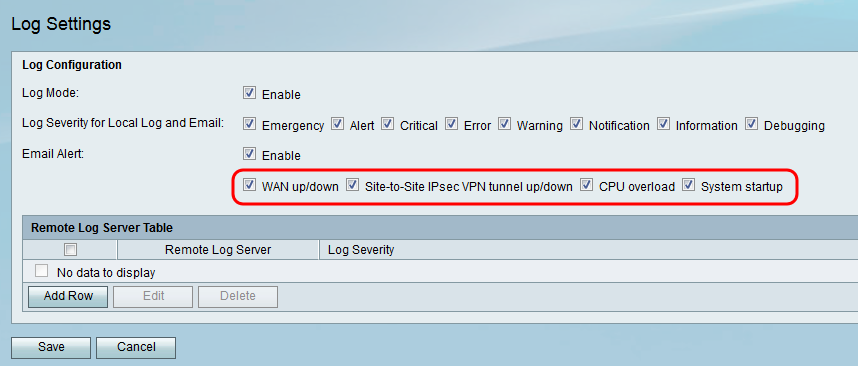
The available options are defined as follows:
• WAN up/down — Sends an email alert if the WAN link is up or down.
• Site-to-Site IPsec VPN tunnel up/down — Sends an email alert when a VPN tunnel is established, a VPN tunnel is down, or the VPN tunnel negotiation fails.
• CPU overload — Sends an email alert if the CPU utilization is higher than the specified threshold for over a minute and sends another email alert when the utilization drops back to normal levels for over a minute.
• System startup — Sends an email alert each time the system is booted up.
Add/Edit Remote Log Servers
Step 1. In the Remote Log Server table, click Add Row.

A new row appears with new fields and options available:

Step 2. Under the Remote Log Server column, enter the IP address of the log server that will collect the logs in the field of the row.

Step 3. Under the Log Severity column, check the desired severity of the logs for the corresponding remote log server.

Step 4. Under the Enable column, check the check box to enable the logging settings for the corresponding remote log server.

Step 5. To edit the information for a particular remote log server, select the entry by checking its corresponding check box and clicking the Edit button.

Note: You must click Save after creating a new row to be able to edit it.
Step 6. Click Save to save your settings.
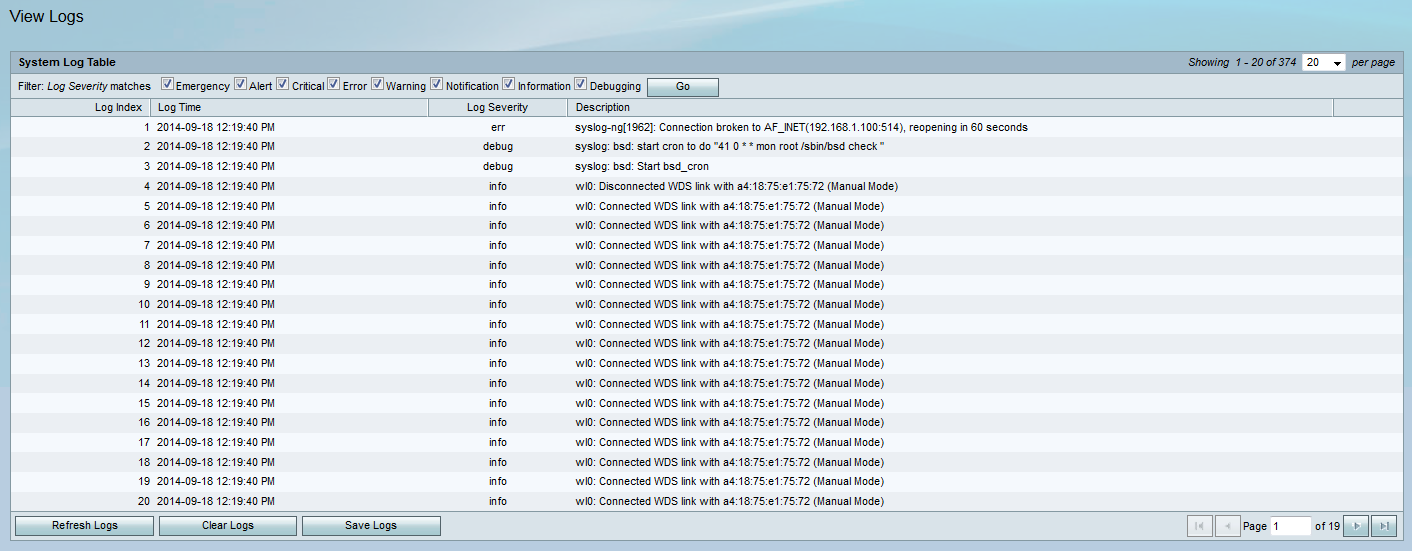
If you would like to view the logs, navigate to Status > View Logs in the web configuration utility. The View Logs page opens and displays the System Log Table:
Revision History
| Revision | Publish Date | Comments |
|---|---|---|
1.0 |
13-Dec-2018 |
Initial Release |
 Feedback