View the Port Traffic Statistics on the RV34x Series Router
Available Languages
Objective
Port traffic statistics allows an administrator to view the state of the interfaces and the traffic that comes through it. These statistics assist the network administrator in troubleshooting the devices that are connected to the router. An administrator may also use these statistics to determine how much data and power should be allocated per port.
The Wireless Statistics page on the RV340W router allows an administrator to view the state of the Service Set Identifiers (SSIDs) and their corresponding data transmission between client and router. With the help of information such as radio frequency which the SSID broadcasts, it can help triangulate problems in the network that are related to radio signals.
The objective of this document is to show you how to view and define the port traffic on the RV34x Series Router.
Applicable Devices
- RV34x Series
Software Version
- 1.0.01.16
View the Port Traffic Statistics
View Port Traffic
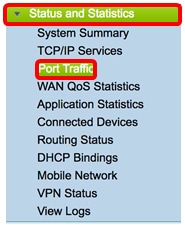
Step 1. Log in to the web-based utility of the router and choose Status and Statistics > Port Traffic.
Step 2. View the Port Traffic table below. The contents of the table are as follows:
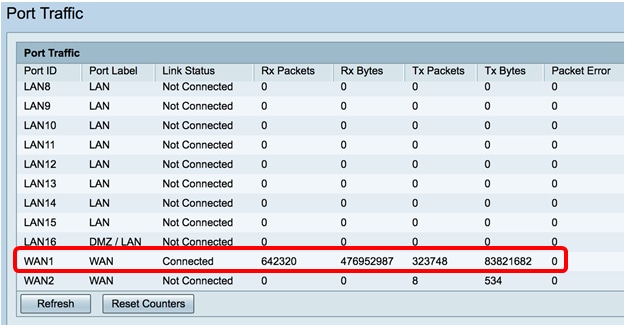
- Port ID — Defined name and number of the interface.
- Port Label — The type of port. This can either be a Local Area Network (LAN) port, a Demilitarized Zone (DMZ) port, or Wide Area Network (WAN) port.
- Link Status — The status of the interface. The status can either be Connected or Not Connected.
- Rx Packets — Number of packets received on the port.
- Rx Bytes — Number of packets received, measured in bytes.
- Tx Packets — Number of packets sent on the port.
- Tx Bytes — Number of packets sent and measured in bytes.
- Packet Error — Details about the error packets.
Note: In this example, WAN1 displays the most traffic.
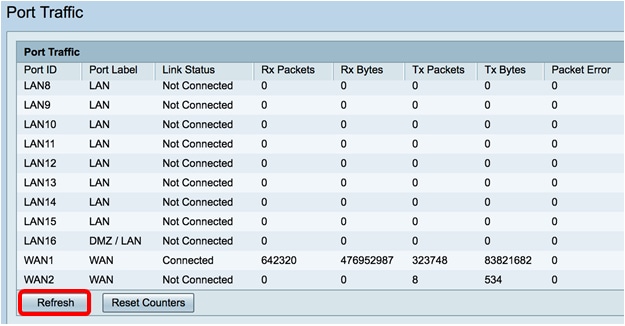
Step 3. (Optional) Click on Refresh to allow the counters to update the displayed statistics.
Step 4. (Optional) Click on Reset Counters to reset all values to zero.
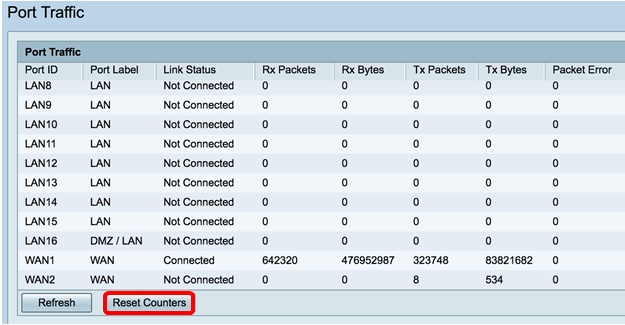
You should now have successfully viewed the Port Traffic on an RV34x Series Router.
View Wireless Traffic
Note: This area is only applicable to RV340W.
Step 1. View the Wireless Traffic below. The contents of the table are as follows:

- SSID Name — Defined name of the Service Set Identifier (SSID).
- VLAN — The Virtual Local Area Network (VLAN) the SSID has been assigned.
- Radio Name — The radio frequency from which the SSID is broadcasted. This can either be the 2.4 GHz band or the 5 GHz band.
- Status — The status of the interface. The status can either be Active or Inactive.
- Rx Packets — Number of packets received on the port.
- Rx Bytes — Number of packets received, measured in bytes.
- Tx Packets — Number of packets sent on the port.
- Tx Bytes — Number of packets sent and measured in bytes.
- Multicast Packets — Number of multicast packets that were sent.
- Packet Error — Details about the error packets.
- Packets Dropped — Number of packets dropped on the SSID.
- Collisions — Number of collisions that occurred on the network.
- No. of Clients — Number of clients connected to the SSID.
Step 2. (Optional) Click on Refresh to allow the counters to update the displayed statistics.

Step 3. (Optional) Click on Reset Counters to reset all values to zero.

You should now have successfully viewed the wireless traffic on the RV340W.
View Port Status
Step 1. View the Port Status table below. The contents of the table are as follows:
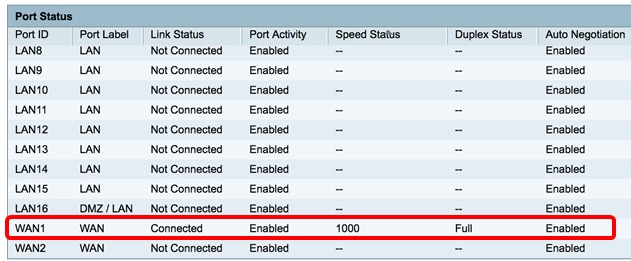
- Port ID — Defined name and number of the port.
- Port Label — The type of port. This can either be a LAN, DMZ, or a WAN port.
- Link Status — The status of the interface. The status can either be Connected or Not Connected.
- Port Activity — Status of the port. This can be port enabled or disabled or connected.
- Speed Status — The speed in Mbps of the device after auto negotiation.
- Duplex Status — The Duplex mode can be either Half or Full.
- Auto Negotiation — Status of the auto negotiation parameter. When enabled, it detects the duplex mode, and if the connection requires a crossover, it automatically chooses the Medium Dependent Interface (MDI) or Medium Dependent Interface Crossover (MDIX) configuration that matches the other end of the link.
Note: In this example, WAN1 displays its connection with a speed of 1000 Mbps.
You should now have successfully viewed the Port Status on the Rv34x Series Router.
 Feedback