View the Wide Area Network (WAN) Quality of Service (QoS) Statistics on the RV34x Series Router
Available Languages
Objective
The Wide Area Network (WAN) Quality of Service (QoS) statistics is a useful tool in troubleshooting problems on the network depending on the direction of the traffic on an interface.
The Quality of Service (QoS) allows you to prioritize traffic for different applications, users, or data flows. It can also be used to guarantee performance to a specified level, thus, affecting the QoS of the client. QoS is generally affected by the following factors: jitter, latency, and packet loss.
This article explains how to view the Inbound and Outbound WAN QoS Statistics on the Rv34x Series Router.
Applicable Devices
- RV34x Series
Software Version
- 1.0.01.16
Perform Diagnosis
Step 1. Log in to the web-based utility of the router and choose Status and Statistics > WAN QoS Statistics.

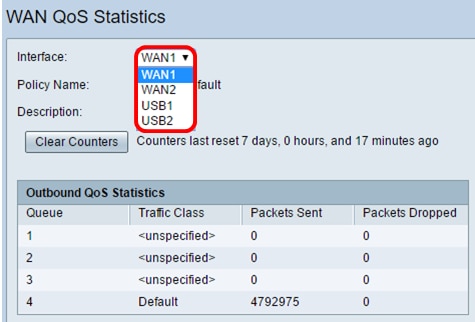
Step 2. From the Interface drop-down menu, choose an interface to view the WAN QoS. The options are:
- WAN1 — WAN port 1 interface
- WAN2 — WAN port 2 interface
- USB1 — USB port 1 interface
- USB2 — USB port 2 interface
Note: In this example, WAN1 is chosen.

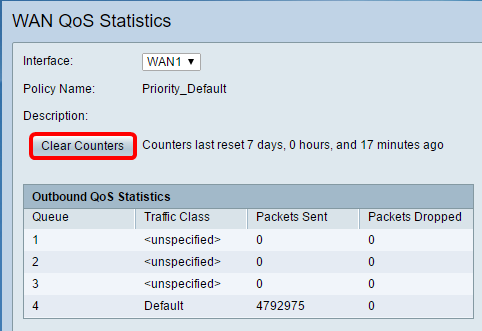
Step 3. The Policy Name area specifies which QoS policy is applied to the interface chosen and the description of the Policy name.
Note: In this example, Priority_Default is the name of the policy and the description is blank.

Step 4. (Optional) Click the Clear Counters button to clear and reset the Outbound and Inbound QoS Statistics.

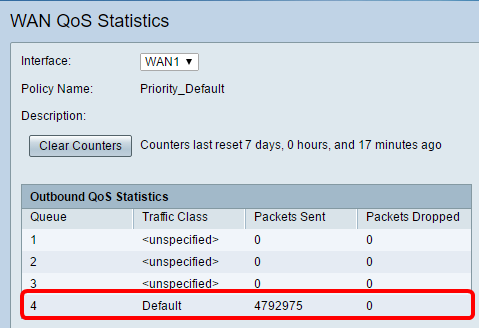
In the Outbound QoS Statistics table, the following columns are described:

- Queue — The number of outbound queues.
- Traffic Class — The name of the traffic class assigned to the queue.
- Packets Sent — The number of outbound packets of the traffic class sent.
- Packets dropped — The number of outbound packets dropped.
Note: In this example, the fourth outbound queue with the Default Traffic Class has sent 4792975 packets and has dropped 0 packets.
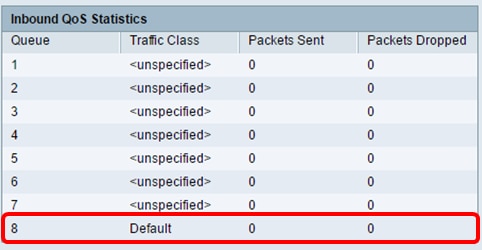
In the Inbound QoS Statistics table, the following columns are described:

- Queue — The number of inbound queues.
- Traffic Class — The name of the traffic class assigned to the queue.
- Packets Sent — The number of inbound packets of the traffic class sent.
- Packets dropped — The number of inbound packets dropped.
Note: In this example, the eighth queue with the Default traffic class has sent 0 packets and dropped 0 packets.
You should now have successfully viewed the WAN QoS Statistics on the RV34x Series Router.
 Feedback