How to Display QoS Queue Statistics on a Switch
Available Languages
Objective
Quality of Service (QoS) is a feature that is used to optimize network performance. It provides classifications of incoming traffic to traffic classes based to attributes that include device configuration, ingress interface, packet content, and combination of these attributes. QoS is achieved by managing the delay, delay variation or jitter, bandwidth, and packet loss. This feature is commonly used for time-sensitive data for Voice over Internet Protocol (VoIP), video, and mission critical applications.
Queue management is used in QoS internetwork architecture. Queueing is a technique used in network devices such as routers and switches to handle congestion. Packets are held in queues for processing. After processing, packets are sent to the destination. Queue statistics provide information about the number of packets forwarded and number of packets dropped depending upon the interface, queue and drop precedence.
This article provides instructions on how to display QoS queue statistics through the web-based utility and the Command Line Interface (CLI) of your switch.
Applicable Devices
- Sx350 Series
- SG350X Series
- Sx550X Series
Software Version
- 2.3.0.130
Display QoS Queue Statistics
Display QoS Queue Statistics on an Interface through the Web-based Utility
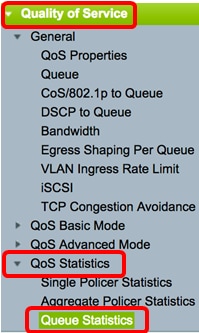
Step 1. Log in to the web-based utility of the switch then choose Quality of Service > QoS Statistics > Queue Statistics.
Note: The available menu options may vary depending on the device model. In this example, SG350X-48MP is used.
Step 2. Choose refresh rate from the Refresh Rate drop-down list. This is the time period that passes before the interface Ethernet statistics are refreshed. The options are:
- No Refresh — Statistics are not refreshed. This is the default option.
- 15 sec — Statistics are refreshed every 15 seconds.
- 30 sec — Statistics are refreshed every 30 seconds.
- 60 sec — Statistics are refreshed every 60 seconds.
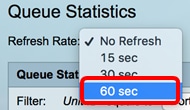
Note: In this example, 60 sec is chosen.
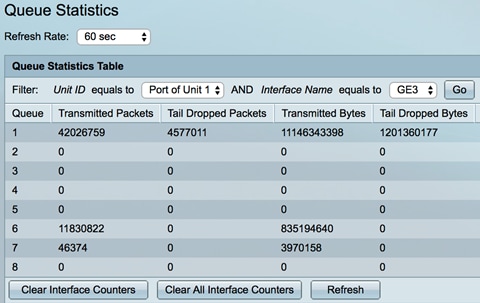
Step 3. (Optional) For stacked switches, choose the switch that you want to configure from the Unit ID drop-down list.

Note: In this example, Port of Unit 1 is chosen.
Step 4. Choose an interface from the Interface Name drop-down list.

Note: In this example, interface GE3 is chosen.
Step 5. Click the Go button to view the QoS queue statistics of the specific interface.

The Queues Statistics table displays the following fields for each queue:
- Queue — Packets forwarded or tail dropped from this queue.
- Transmitted Packets — Number of packets that were transmitted.
- Tail Dropped Packets — Percentage of packets that were tail dropped.
- Transmitted Bytes — Number of bytes that were transmitted.
- Tail Dropped Bytes — Percentage of bytes that were tail dropped.
Step 6. (Optional) To clear the counters of the chosen interface, click the Clear Interface Counters button then click OK on the pop-up window.
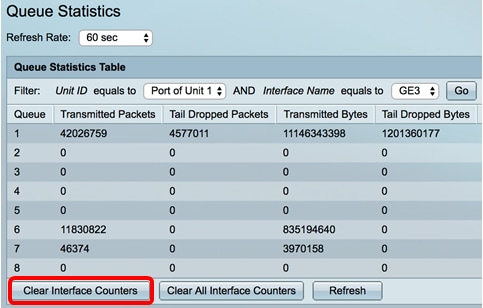

Step 7. (Optional) To clear the counters of all interfaces on the chosen switch, click the Clear All Interface Counters button then click OK on the pop-up window.
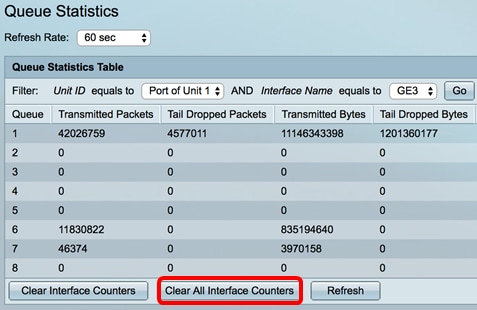

Step 8. (Optional) To refresh the counters on the chosen interface, click the Refresh button. The table will immediately reflect the refreshed statistics.
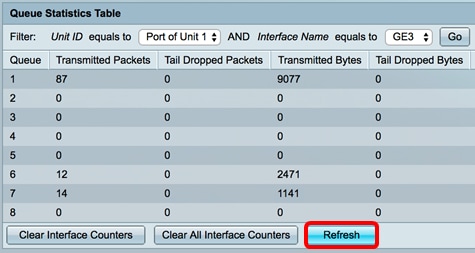
You should now have successfully displayed the QoS queue statistics on a specific interface or interfaces through the web-based utility of your switch.
Display QoS Queue Statistics on an Interface through the CLI
Step 1. Log in to the switch console. The default username and password is cisco/cisco. If you have configured a new username or password, enter the credentials instead.

Note: The commands may vary depending on the exact model of your switch. In this example, the SG350X switch is accessed through Telnet.
Step 2. From the Privileged EXEC mode of the switch, enter the following:

- interface-id — Specifies an interface ID.
- The Queues Statistics table displays the following fields for each queue:
- Interface — The specified interface.
- Queue — Packets forwarded or tail dropped from this queue.
- Tx Packets — Number of packets that were transmitted.
- Tx Bytes — Number of bytes that were transmitted.
- Tail-Dropped Packets — Percentage of packets that were tail dropped.
- Tail-Dropped Bytes — Percentage of bytes that were tail dropped.
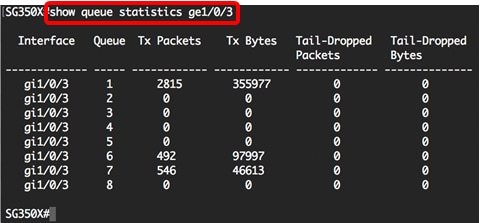
Step 3. (Optional) To display the Differentiated Services Code Point (DSCP) to queue mapping, enter the following:

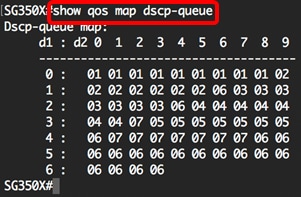
Step 4. (Optional) To clear QoS statistics counters on your switch, enter the Global Configuration context by entering the following:


You should now have successfully displayed the QoS queue statistics on a specific interface or interfaces through the CLI of your switch.
Contact Cisco
- Open a Support Case

- (Requires a Cisco Service Contract)
 Feedback