View Power over Ethernet (PoE) Statistics and Power Savings of the 350X and 550X Series Managed Switches
Available Languages
Objective
Viewing Power over Ethernet (PoE) energy consumption and historical statistics of a device or an interface allows you to track and calculate the average PoE energy consumption and savings of the device or port overtime. This is very useful for examination and debugging of PoE behavior and performance since the trend will be easily monitored.
The PoE consumption readings are taken every 60 seconds and the information can be displayed for the following:
- Last hour — sampled every 60 seconds
- Last day — 24 samples (sample every 1 hour)
- Last week — 7 samples (sample every 1 day)
- Last year — 52 samples (sample every 1 week)
You can view the PoE consumption information either per port or per device as a whole.
The objective of this article is to show you how to view the PoE statistics and power savings of the 350X and 550X Series Managed Switches.
Applicable Devices
- SG350X Series
- Sx550X Series
Software Version
- 2.2.5.68
View PoE Statistics
View PoE Statistics per Device
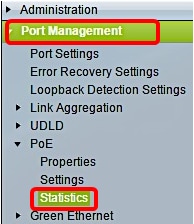
Step 1. Log in to the web-based utility of the switch and choose Port Management > PoE > Statistics.
Step 2. If your device belongs to a stack, choose the unit by clicking the Unit drop-down list for the Interface.
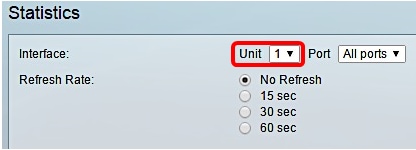
Note: In this example, Unit 1 is chosen.
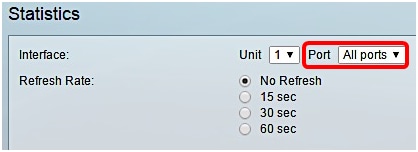
Step 3. Make sure the Port is set to the default setting All ports. This will enable you to view the statistics of the device as a whole.
Step 4. Click a radio button for the Refresh Rate. This will enable the page to refresh based on the interval that you specify.
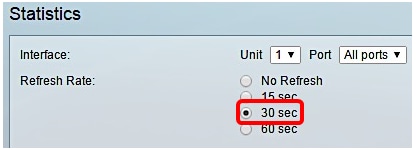
Note: In this example, 30 sec is chosen.
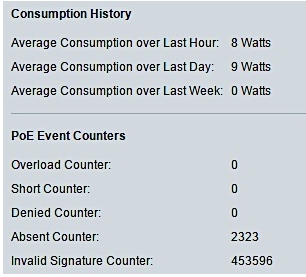
The following information will be displayed:
Consumption History
- Average Consumption over Last Hour — Average of all PoE consumption readings in the last hour.
- Average Consumption over Last Day — Average of all PoE consumption readings in the last day.
- Average Consumption over Last Week — Average of all PoE consumption readings in the last week.
PoE Event Counters
- Overload Counter — Number of overload conditions detected.
- Short Counter — Number of short conditions detected.
- Denied Counter — Number of denied conditions detected.
- Absent Counter — Number of absent conditions detected.
- Invalid Signature Counter — Number of invalid signature conditions detected.
View PoE Statistics per Port
Step 1. Click the Port drop-down list and choose the specific port you want to view.
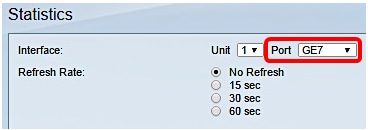
Note: In this example, Port GE7 is chosen.
Step 2. Click a radio button for the Refresh Rate. This will enable the page to refresh based on the interval that you specify.
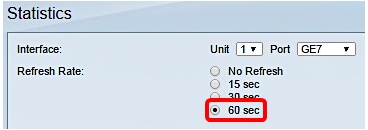
Note: In this example, 60 sec is chosen.
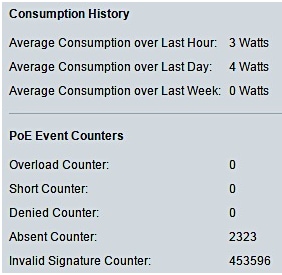
The following information will be displayed for the chosen port:
Consumption History
- Average Consumption over Last Hour—Average of all PoE consumption readings in the last hour.
- Average Consumption over Last Day—Average of all PoE consumption readings in the last day.
- Average Consumption over Last Week—Average of all PoE consumption readings in the last week.
PoE Event Counters
- Overload Counter—Number of overload conditions detected.
- Short Counter—Number of short conditions detected.
- Denied Counter—Number of denied conditions detected.
- Absent Counter—Number of absent conditions detected.
- Invalid Signature Counter—Number of invalid signature conditions detected.
The following actions can be performed in the Statistics page:
- Clear Event Counters — Clears the displayed event counters and enable the counters to start from zero.

- View All Interfaces Statistics — Redirects you to the PoE Statistics Table, which displays all the above statistics for all the interfaces in the device.

- View Interface History Graph — Displays the counters in graph format. You can choose a radio button for the Time Span to see the trend based on the following:
- Last Hour
- Last Day
- Last Week
- Last Year

Note: In this example, Last Hour is chosen.
- Refresh — Refreshes the displayed counters manually.
View Power Savings
Step 1. Log in to the web-based utility of the switch and choose Status and Statistics > Health and Power.

The following Power Savings information will be displayed:
- Current Green Ethernet and Port Power Savings — The current amount of the power savings on all the ports on the device.
- Cumulative Green Ethernet and Port Power Savings — The accumulative amount of power savings on all the ports since the device was powered up.
- Projected Annual Green Ethernet and Port Power Savings — The projection of the amount of power that will be saved on the device in one week. This value is calculated based on the savings that occurred during the previous week.
- Current PoE Power Savings — The current amount of the PoE power saved on ports that have Powered Devices (PDs) connected to them and on which PoE is not operational due to the Time Range feature.
- Cumulative PoE Power Savings — The cumulative amount of the PoE power since the device was powered up, amount of the PoE power saved on ports which have PDs connected to them and to which PoE is not operational due to the Time Range feature.
- Projected Annual PoE Power Savings — The yearly projected amount of PoE power since device was powered up, amount of PoE power saved on ports that have PDs connected to them and to which PoE is not operational due to the Time Range feature. This projection is based on the savings during the previous week.

You should now have successfully viewed the PoE statistics and power savings on your switch.
 Feedback